Identification and Comprehensive Genome-Wide Analysis of Glutathione S-Transferase Gene Family in Sweet Cherry (Prunus avium) and Their Expression Profiling Reveals a Likely Role in Anthocyanin Accumulation
- PMID: 35903236
- PMCID: PMC9315441
- DOI: 10.3389/fpls.2022.938800
Identification and Comprehensive Genome-Wide Analysis of Glutathione S-Transferase Gene Family in Sweet Cherry (Prunus avium) and Their Expression Profiling Reveals a Likely Role in Anthocyanin Accumulation
Abstract
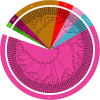
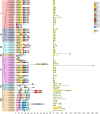
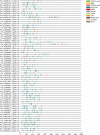
Glutathione S-transferases (GSTs) in plants are multipurpose enzymes that are involved in growth and development and anthocyanins transportation. However, members of the GST gene family were not identified in sweet cherry (Prunus avium). To identify the GST genes in sweet cherry, a genome-wide analysis was conducted. In this study, we identified 67 GST genes in P. avium genome and nomenclature according to chromosomal distribution. Phylogenetic tree analysis revealed that PavGST genes were classified into seven chief subfamily: TCHQD, Theta, Phi, Zeta, Lambda, DHAR, and Tau. The majority of the PavGST genes had a relatively well-maintained exon-intron and motif arrangement within the same group, according to gene structure and motif analyses. Gene structure (introns-exons) and conserved motif analysis revealed that the majority of the PavGST genes showed a relatively well-maintained motif and exons-introns configuration within the same group. The chromosomal localization, GO enrichment annotation, subcellular localization, syntenic relationship, Ka/Ks analysis, and molecular characteristics were accomplished using various bioinformatics tools. Mode of gene duplication showed that dispersed duplication might play a key role in the expansion of PavGST gene family. Promoter regions of PavGST genes contain numerous cis-regulatory components, which are involved in multiple stress responses, such as abiotic stress and phytohormones responsive factors. Furthermore, the expression profile of sweet cherry PavGSTs showed significant results under LED treatment. Our findings provide the groundwork for future research into induced LED anthocyanin and antioxidants deposition in sweet cherries.
Keywords: Glutathione S-transferases; Prunus avium; anthocyanin; expression analysis; phylogeny.
Copyright © 2022 Sabir, Manzoor, Shah, Liu, Jiu, Wang, Alam, Abdullah and Zhang.
Conflict of interest statement
The authors declare that the research was conducted in the absence of any commercial or financial relationships that could be construed as a potential conflict of interest.
Figures


Similar articles
-
Genome-Wide Identification of Glutathione S-Transferase Genes in Eggplant (Solanum melongena L.) Reveals Their Potential Role in Anthocyanin Accumulation on the Fruit Peel.Int J Mol Sci. 2024 Apr 11;25(8):4260. doi: 10.3390/ijms25084260. Int J Mol Sci. 2024. PMID: 38673847 Free PMC article.
-
MYB transcription factor family in sweet cherry (Prunus avium L.): genome-wide investigation, evolution, structure, characterization and expression patterns.BMC Plant Biol. 2022 Jan 3;22(1):2. doi: 10.1186/s12870-021-03374-y. BMC Plant Biol. 2022. PMID: 34979911 Free PMC article.
-
A Sweet Cherry Glutathione S-Transferase Gene, PavGST1, Plays a Central Role in Fruit Skin Coloration.Cells. 2022 Mar 30;11(7):1170. doi: 10.3390/cells11071170. Cells. 2022. PMID: 35406734 Free PMC article.
-
Genome-wide in silico identification of glutathione S-transferase (GST) gene family members in fig (Ficus carica L.) and expression characteristics during fruit color development.PeerJ. 2023 Jan 25;11:e14406. doi: 10.7717/peerj.14406. eCollection 2023. PeerJ. 2023. PMID: 36718451 Free PMC article. Review.
-
Genome-Wide Identification, Characterization, and Expression Analysis of the Copper-Containing Amine Oxidase Gene Family in Mangrove Kandelia obovata.Int J Mol Sci. 2023 Dec 9;24(24):17312. doi: 10.3390/ijms242417312. Int J Mol Sci. 2023. PMID: 38139139 Free PMC article. Review.
Cited by
-
Comprehensive characterization and expression profiling of sucrose phosphate synthase (SPS) and sucrose synthase (SUS) family in Cucumis melo under the application of nitrogen and potassium.BMC Plant Biol. 2025 Mar 5;25(1):285. doi: 10.1186/s12870-025-06308-0. BMC Plant Biol. 2025. PMID: 40038633 Free PMC article.
-
BrGSTF12, an anthocyanin-related glutathione S-transferase gene, is essential for light-induced anthocyanin accumulation in zicaitai (Brassica Rapa Var. purpuraria).BMC Plant Biol. 2025 Apr 12;25(1):468. doi: 10.1186/s12870-025-06486-x. BMC Plant Biol. 2025. PMID: 40221672 Free PMC article.
-
Genome-wide identification and expression analysis of glutathione S-transferase gene family to reveal their role in cold stress response in cucumber.Front Genet. 2022 Sep 29;13:1009883. doi: 10.3389/fgene.2022.1009883. eCollection 2022. Front Genet. 2022. PMID: 36246659 Free PMC article.
-
Genome-Wide Identification and Expression Analysis of GST Genes during Light-Induced Anthocyanin Biosynthesis in Mango (Mangifera indica L.).Plants (Basel). 2024 Sep 29;13(19):2726. doi: 10.3390/plants13192726. Plants (Basel). 2024. PMID: 39409596 Free PMC article.
-
Sweet cherry TCP gene family analysis reveals potential functions of PavTCP1, PavTCP2 and PavTCP3 in fruit light responses.BMC Genomics. 2024 Jan 2;25(1):3. doi: 10.1186/s12864-023-09923-z. BMC Genomics. 2024. PMID: 38166656 Free PMC article.
References
-
- Abdullah M., Cheng X., Cao Y., Su X., Manzoor M. A., Gao J., et al. (2018b). Zinc finger-homeodomain transcriptional factors (ZHDs) in upland cotton (Gossypium hirsutum): genome-wide identification and expression analysis in fiber development. Front. Genet. 9:357. 10.3389/fgene.2018.00357 - DOI - PMC - PubMed
-
- Azad M. O. K., Adnan M., Son J., Choi D., Park C. H. (2020). Effect of artificial LED on the growth, anthocyanin, chlorophyll and total phenolic content of buckwheat seedling. Biomed. J. Sci. Tech. Res. 13 10274–10277. 10.26717/BJSTR.2019.13.002467 - DOI
LinkOut - more resources
Full Text Sources
Research Materials

