. 2022 Jul 12:13:949578.
doi: 10.3389/fpls.2022.949578. eCollection 2022.

Distinctive in vitro ATP Hydrolysis Activity of AtVIPP1, a Chloroplastic ESCRT-III Superfamily Protein in Arabidopsis

Affiliations

Distinctive in vitro ATP Hydrolysis Activity of AtVIPP1, a Chloroplastic ESCRT-III Superfamily Protein in Arabidopsis

Norikazu Ohnishi et al. Front Plant Sci. .

Abstract

Vesicle-inducing protein in plastid 1 (VIPP1), characteristic to oxygenic photosynthetic organisms, is a membrane-remodeling factor that forms homo-oligomers and functions in thylakoid membrane formation and maintenance. The cyanobacterial VIPP1 structure revealed a monomeric folding pattern similar to that of endosomal sorting complex required for transport (ESCRT) III. Characteristic to VIPP1, however, is its own GTP and ATP hydrolytic activity without canonical domains. In this study, we found that histidine-tagged Arabidopsis VIPP1 (AtVIPP1) hydrolyzed GTP and ATP to produce GDP and ADP in vitro, respectively. Unexpectedly, the observed GTPase and ATPase activities were biochemically distinguishable, because the ATPase was optimized for alkaline conditions and dependent on Ca2+ as well as Mg2+, with a higher affinity for ATP than GTP. We found that a version of AtVIPP1 protein with a mutation in its nucleotide-binding site, as deduced from the cyanobacterial structure, retained its hydrolytic activity, suggesting that Arabidopsis and cyanobacterial VIPP1s have different properties. Negative staining particle analysis showed that AtVIPP1 formed particle or rod structures that differed from those of cyanobacteria and Chlamydomonas. These results suggested that the nucleotide hydrolytic activity and oligomer formation of VIPP1 are common in photosynthetic organisms, whereas their properties differ among species.

Keywords: ATPase; ESCRT-III superfamily; GTPase; calcium; chloroplast; photosynthesis; thylakoid membrane.


Conflict of interest statement

The authors declare that the research was conducted in the absence of any commercial or financial relationships that could be construed as a potential conflict of interest.

Figures
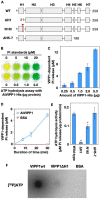
FIGURE 1
FIGURE 1
ATP hydrolysis and binding by recombinant AtVIPP1 proteins. (A) Schematic illustration of the secondary structure of Arabidopsis VIPP1 (adopted from Ohnishi et al. (2018)). H indicates a predicted α-helical structure. The numbers indicate the positions of first (left) to last (right) amino acid of the proteins. The mutation site of N16I is approximately indicated by an arrowhead. The detailed sequence of H1 is shown in Supplementary Figure 4. (B) A photograph of typical a malachite green-based assay for ATP hydrolysis. Green color indicates the presence of free inorganic phosphate (Pi). (C) The level of Pi released from ATP was analyzed using various amounts of wild-type VIPP1 protein (0.25–5.0 μg in 200 μL reaction mixture) by the malachite green-based assay. (D) Time-dependent increase in released Pi in the presence of VIPP1-His protein. The reaction mixtures were incubated for 0, 7.5, 15, and 30 min at 37°C, then free Pi was quantified. Each data point and error bar represents the means and SE, respectively, which were calculated from the results from 4–6 independent experiments. (E) The ATP hydrolysis activity of wild-type, N-terminally, and C-terminally mutated VIPP1-His proteins was analyzed. All the analyses were carried out in standard condition (see Methods). Each bar graph and error bar represents the means and SE, respectively, of results from 4–6 independent experiments. Asterisks denote significant differences in the activity from wild-type proteins (Welch’s t-test with p < 0.01). (F) Direct ATP-binding test of VIPP1-His protein. VIPP1-His, ΔH1, and BSA were dotted on a nitrocellulose membrane and then incubated with radio-labeled ATP ([α−32P]ATP) at room temperature for 1 h. The signals were detected using a BAS1000 system.
FIGURE 2
FIGURE 2
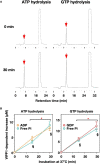
Time-dependent increase in ADP/GDP and Pi. (A) Representative elution profiles obtained from the reaction mixtures after ATP- and GTP-hydrolysis. To obtain high enough signals to detect, the reactions were carried out with the addition of 2.5 μg VIPP1-His protein instead of 1.0 μg protein in standard conditions. The elution peaks corresponding to ADP (column for ATP hydrolysis) and GDP (column for GTP hydrolysis) are indicated with red arrows. (B) Time course graphs indicating increases in the levels of ADP and GDP, which were obtained by quantification of the results from HPLC analyses in panel (A). The increase in level of Pi analyzed in the same conditions (using 2.5 μg VIPP1-His protein) is also shown in the graphs. Asterisks indicate significant differences between the two time points according to a statistical analysis. § Under the data points denotes no significant difference between the concentration of ADP/GDP and that of free Pi at each time point (Welch’s t-test, p < 0.05). Error bars: ± SE.
FIGURE 3
FIGURE 3
Characterization of ATP hydrolysis activity. (A) The pH preferences of both ATP- and GTP-hydrolysis activities were analyzed. Asterisks denote significant differences in the activity from those at pH 7.5 (Welch’s t-test with p < 0.01). (B) Analyses of Vmax and KM of the ATP hydrolysis activity. ATP hydrolysis activity was measured in the presence four ATP concentrations (0.5–4.0 mM). Each bar graph and error bar represents the means and SD, respectively, of results from 5–9 independent experiments (left graph). The concentration of ATP and the average of VIPP1-dependent Pi release are plotted on the graph in accordance with the Cornish–Bowden plot method. The X and Y values of the intersection points represent KM and Vmax, respectively (right graph).
FIGURE 4
FIGURE 4
Requirement for divalent cations. (A) Both ATP- and GTP-hydrolysis activities were measured in the absence (shown as “–”) or presence of four species of divalent cation (Mg2+, Ca2+, Mn2+, and Zn2+). n.s.: No significant differences according to a statistical analysis (Welch’s t-test, p < 0.01). (B) Time course graphs indicating the increase in ADP and GDP in the presence of Ca2+, which were obtained from HPLC analyses on Supplementary Figure 4. The level of Pi analyzed in the same conditions (with 2.5 μg VIPP1-His protein) is also plotted on the graphs. An asterisk indicates a significant difference between the two time points, whereas there was no significant difference at the time points shown as “n.s.” according to a statistical analysis. § Denotes that there was no significant difference between the levels of ADP/GDP and that of free Pi at each time point (Welch’s t-test, p < 0.01, n = 4-6).
FIGURE 5
FIGURE 5
Properties of the Ca2+-dependent ATP hydrolysis. (A) A photograph of typical results of a malachite green-based assay (upper panel) and the quantified activity of ATP hydrolysis (lower panel) in the presence of Ca2+. The reactions were carried out at pH levels (6.5, 7.5, and 8.5). Asterisks in the bar graph denote significant differences from the activity at pH 7.5 (Welch’s t-test with p < 0.01). (B) Analyses for Vmax and KM for ATP hydrolysis activity in the presence of Ca2+ at pH 7.5 and 8.5. ATP hydrolysis activity was measured in the presence of various ATP concentrations, which are indicated at the bottom of the bar graphs. Each bar graph and error bar represents the means and SD, respectively, of results from 5–9 independent experiments (left graphs). The concentration of ATP and the average of VIPP1-dependent Pi release are plotted on the graph in accordance with the Cornish–Bowden plot method. The X and Y values of the intersection point represent KM and Vmax, respectively (right graphs).
FIGURE 6
FIGURE 6
Mutations in the nucleotide-binding pocket predicted from the structure of SynVIPP1. (A) Multiple alignment of partial amino acid sequence (1–180) among a PspA (Escherichia coli) and three VIPP1s (Synechocystis, Chlamydomonas, and Arabidopsis). The amino acids that contribute to ATP/GTP-binding in cyanobacterial VIPP1 are shown with arrows (R44, E126, and E179). (B) ATP- and GTP-hydrolysis activities of wild-type and four point-mutated proteins were analyzed based on Synechocystis VIPP1 previously. Asterisks in the bar graphs denote significant differences in activity from the wild-type protein (Welch’s t-test with p < 0.01). (C) Representative elution profiles of ADP and GDP obtained from the reactions of E126Q/E179Q mutant protein. (D) The level of major products obtained in 30-min hydrolysis reactions. There were no significant differences between the values of graphs, which is shown as “n.s.” according to a statistical analysis (Welch’s t-test, p < 0.01). Error bars: ± SE.
FIGURE 7
FIGURE 7
Analyses based on electron micrographs of negative-stained AtVIPP1-His proteins. (A) Typical electron micrographs of wild-type, ΔH1, V11E, N16I, and E126Q/E179Q recombinant proteins. White and red arrows indicate spherical and rod-like structures, respectively. Yellow arrowheads on photos of N16I and E126Q/E179Q point to spherical structures that are characteristic in each species. Scale bars represent 200 nm. (B) The ratio of spheres to rods in each protein preparation was roughly estimated in accordance with the method in Gupta et al. (2021). The details are shown in Supplementary Figure 8A. (C) Examples of spherical structures observed in wild-type, V11E, N16I, and E126Q/E179Q protein preparations. For the three mutants, the upper photos show wild-type-like structures, and the lower two photos represent the structures specifically observed in each mutant. Yellow arrows indicate hole-like shadows located in the center of V11E particles. Scale bars represent 100 nm. (D) Distribution of the size of spherical structures in wild-type, V11E, N16I, and E126Q/E179Q protein preparations. The diameters of 100–280 spherical structures were measured manually, as shown in Supplementary Figure 8B, and plotted on box plot graphs. The distribution of every species of protein differed from each other with p values of <0.001, which was calculated using the statistical Brunner–Munzel test.

Similar articles

Cited by

References

    1. Akhova A. V., Tkachenko A. G. (2019). HPLC-UV method for simultaneous determination of adenosine triphosphate and Its metabolites in Mycobacterium smegmatis. Acta Chromatogr. 31 45–48. 10.1556/1326.2017.00344 - DOI
    1. Aseeva E., Ossenbuhl F., Sippel C., Cho W. K., Stein B., Eichacker L. A., et al. (2007). Vipp1 is required for basic thylakoid membrane formation but not for the assembly of thylakoid protein complexes. Plant Physiol. Biochem. 45 119–128. 10.1016/j.plaphy.2007.01.005 - DOI - PubMed
    1. Berges J. A., Montagnes D. J. S., Hurd C. L., Harrison P. J. (1994). Fitting ecological and physiological data to rectangular hyperbolae - a comparison of methods using Monte Carlo simulations. Mar. Ecol. Prog. Ser. 114 175–183. 10.3354/meps114175 - DOI
    1. Cheung M. Y., Li X., Miao R., Fong Y. H., Li K. P., Yung Y. L., et al. (2016). ATP binding by the P-loop NTPase OsYchF1 (an unconventional G protein) contributes to biotic but not abiotic stress responses. Proc. Natl. Acad. Sci. U. S. A. 113 2648–2653. 10.1073/pnas.1522966113 - DOI - PMC - PubMed
    1. Diekmann D., Hall A. (1995). In vitro binding assay for interactions of Rho and Rac with GTPase-activating proteins and effectors. Methods Enzymol. 256 207–215. 10.1016/0076-6879(95)56025-4 - DOI - PubMed

LinkOut - more resources