. 2022 Jul 16:2022:3674931.
doi: 10.1155/2022/3674931. eCollection 2022.

Energy Metabolism and Lipidome Are Highly Regulated during Osteogenic Differentiation of Dental Follicle Cells

Affiliations

Energy Metabolism and Lipidome Are Highly Regulated during Osteogenic Differentiation of Dental Follicle Cells

Oliver Pieles et al. Stem Cells Int. .

Abstract

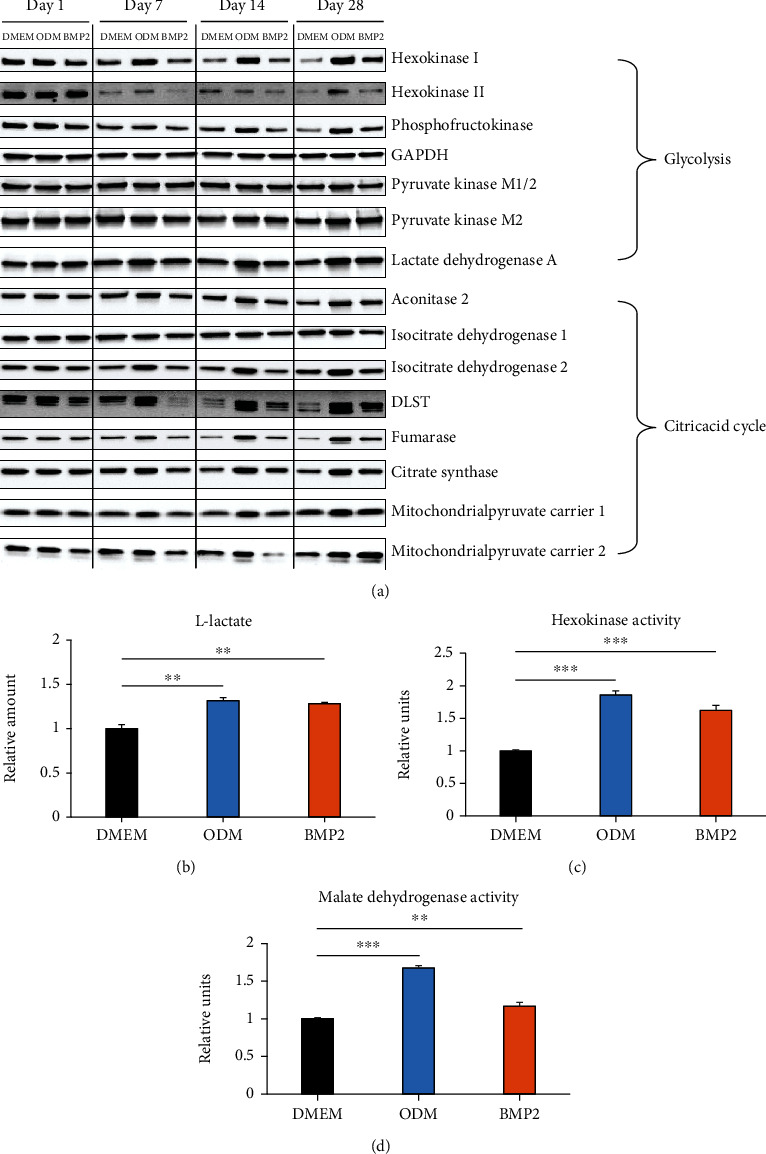
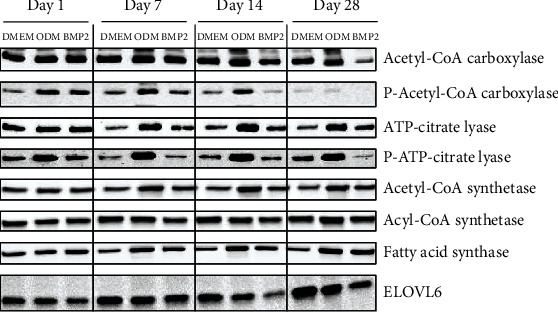
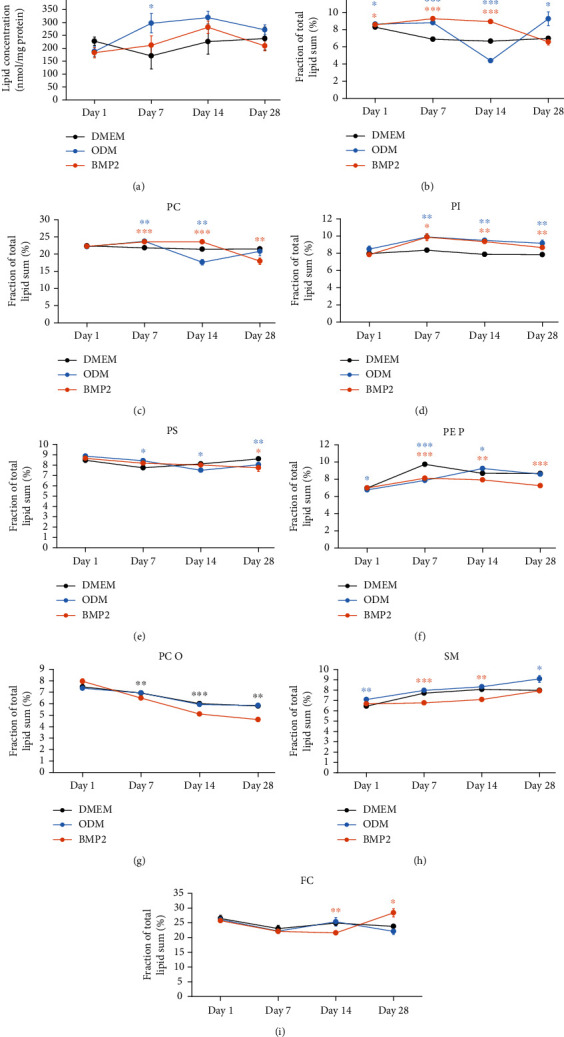
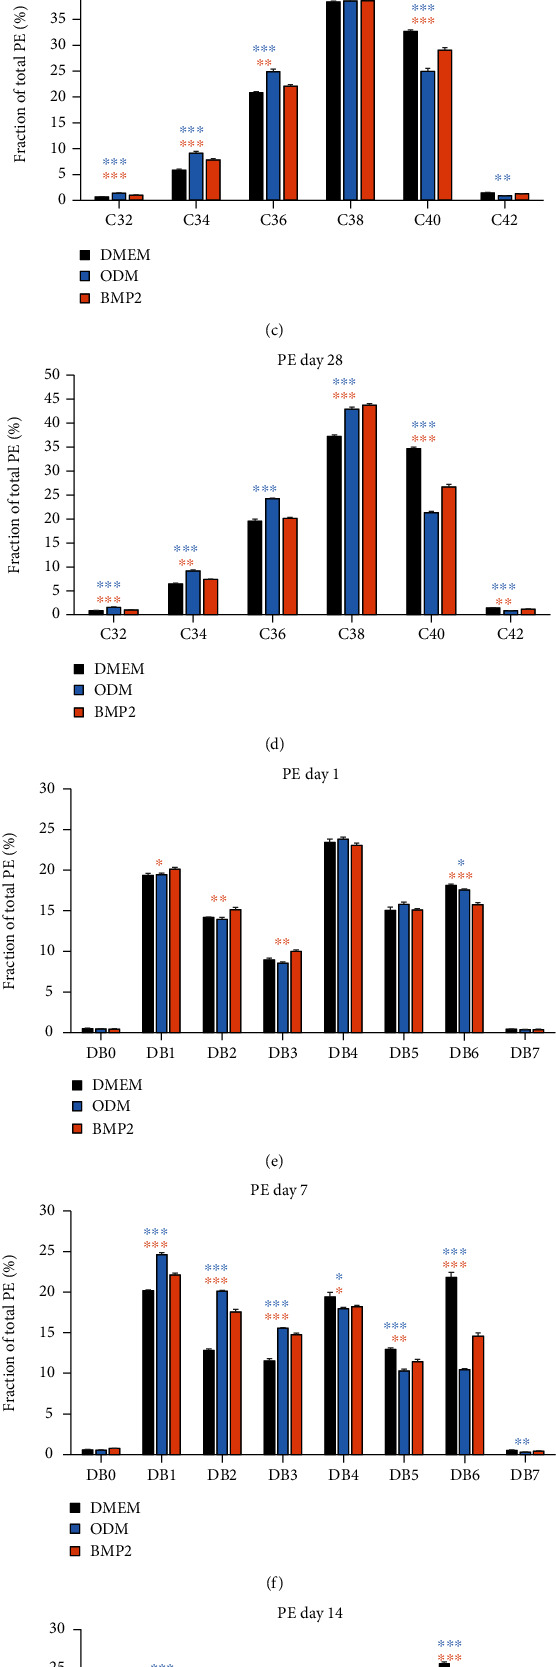
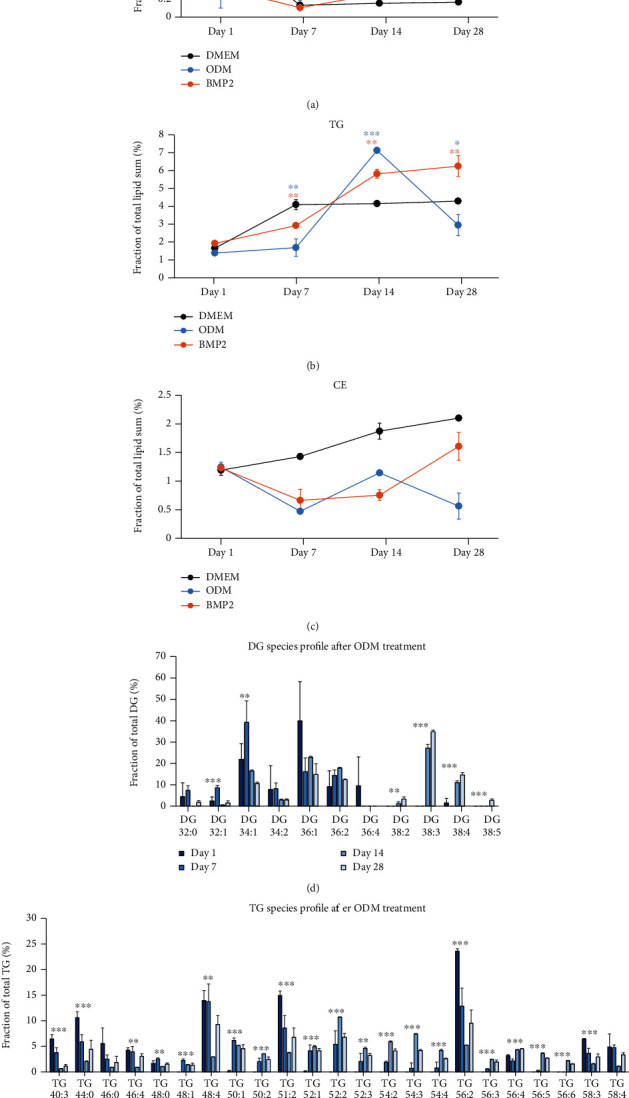
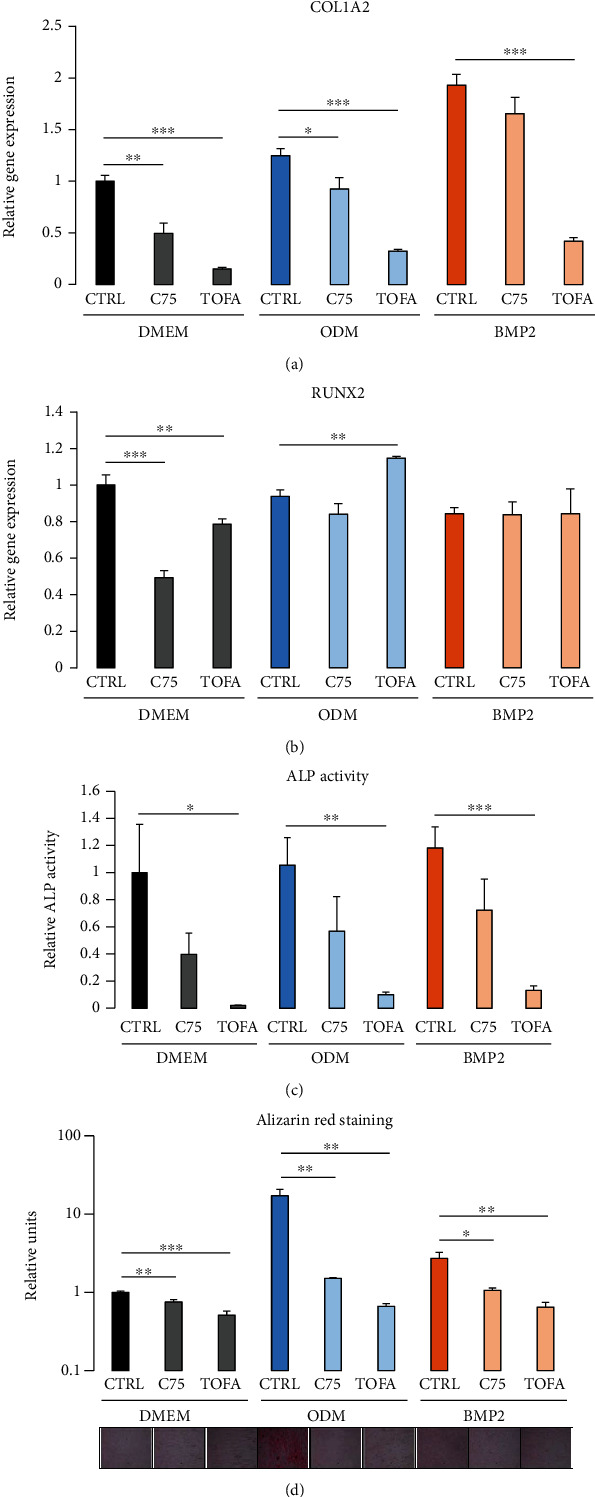
Dental follicle cells (DFCs) are stem/progenitor cells of the periodontium and give rise to alveolar osteoblasts. However, understanding of the molecular mechanisms of osteogenic differentiation, which is required for cell-based therapies, is delimited. This study is aimed at analyzing the energy metabolism during the osteogenic differentiation of DFCs. Human DFCs were cultured, and osteogenic differentiation was induced by either dexamethasone or bone morphogenetic protein 2 (BMP2). Previous microarray data were reanalyzed to examine pathways that are regulated after osteogenic induction. Expression and activity of metabolic markers were evaluated by western blot analysis and specific assays, relative amount of mitochondrial DNA was measured by real-time quantitative polymerase chain reaction, the oxidative state of cells was determined by a glutathione assay, and the lipidome of cells was analyzed via mass spectrometry (MS). Moreover, osteogenic markers were analyzed after the inhibition of fatty acid synthesis by 5-(tetradecyloxy)-2-furoic acid or C75. Pathway enrichment analysis of microarray data revealed that carbon metabolism was amongst the top regulated pathways after osteogenic induction in DFCs. Further analysis showed that enzymes involved in glycolysis, citric acid cycle, mitochondrial activity, and lipid metabolism are differentially expressed during differentiation, with most markers upregulated and more markedly after induction with dexamethasone compared to BMP2. Moreover, the cellular state was more oxidized, and mitochondrial DNA was distinctly upregulated during the second half of differentiation. Besides, MS of the lipidome revealed higher lipid concentrations after osteogenic induction, with a preference for species with lower numbers of C-atoms and double bonds, which indicates a de novo synthesis of lipids. Concordantly, inhibition of fatty acid synthesis impeded the osteogenic differentiation of DFCs. This study demonstrates that energy metabolism is highly regulated during osteogenic differentiation of DFCs including changes in the lipidome suggesting enhanced de novo synthesis of lipids, which are required for the differentiation process.


Conflict of interest statement

The authors declare that there is no conflict of interest regarding the publication of this article.

Figures

Figure 1
Figure 1
Expression of glycolysis and citric acid cycle markers during osteogenic differentiation of DFCs. (a) DFCs were cultured in osteogenic differentiation medium (ODM), BMP2 differentiation medium, or control medium (DMEM) for one, seven, 14, and 28 days before protein expression of the glycolysis markers hexokinase I, hexokinase II, phosphofructokinase, glycerinaldehyd-3-phosphat-dehydrogenase (GAPDH), pyruvate kinase M1/2, pyruvate kinase M2, and lactate dehydrogenase A, and protein expression of the citric acid cycle markers aconitase 2, isocitrate dehydrogenase 1, isocitrate dehydrogenase 2, dihydrolipoamide succinyltransferase (DLST), fumarase, citrase synthase, mitochondrial pyruvate carrier 1, and mitochondrial pyruvate carrier 2 were determined by western blot analysis. Quantification results and statistical analysis are shown in the Supplementary Table 2. (b–d) DFCs were cultured in osteogenic differentiation medium (ODM), BMP2 differentiation medium, or control medium (DMEM) for seven days before the amount of produced L-lactate (b) and hexokinase activity (c) were determined as markers of glycolysis and malate dehydrogenase activity was measured (d) as marker of citric acid cycle. Results are shown as means + standard deviation, and Student's t-test was performed to compare differentiation medium with control medium. ∗∗p < 0.01, ∗∗∗p < 0.001.
Figure 2
Figure 2
Evaluation of mitochondrial metabolism during osteogenic differentiation of DFCs. (a) DFCs were cultured in osteogenic differentiation medium (ODM), BMP2 differentiation medium, or control medium (DMEM) for one, seven, 14, and 28 days before protein expression of cytochrome c, prohibitin 1, cytochrome c oxidase subunit 4 (COX IV), pyruvate dehydrogenase, succinate dehydrogenase complex subunit A (SDHA), heat shock protein 60 (HSP60), and voltage-dependent anion channel (VDAC) was determined by western blot analysis. Quantification results and statistical analysis are shown in the Supplementary Table 2. (b) DFCs were cultured in osteogenic differentiation medium (ODM), BMP2 differentiation medium, or control medium (DMEM) for seven days before complex I activity was determined in isolated mitochondria. (c, d) DFCs were cultured in osteogenic differentiation medium (ODM), BMP2 differentiation medium, or control medium (DMEM) for one, seven, 14, and 28 days before the amount of mitochondrial DNA relative to genomic DNA was measured by qPCR analysis (c) and protein expression of HIF-1α was determined by western blot analysis (n = 1, d). (e) DFCs were cultured in osteogenic differentiation medium (ODM), BMP2 differentiation medium, or control medium (DMEM) for seven days. The amount of oxidized glutathione from total glutathione was measured as indicator for oxidative stress. Results are shown as means + standard deviation, and Student's t-test was performed to compare differentiation medium with control medium at the same time point (b, c, e). p < 0.05, ∗∗p < 0.01, ∗∗∗p < 0.001.
Figure 3
Figure 3
Expression of lipid metabolism markers during osteogenic differentiation of DFCs. DFCs were cultured in osteogenic differentiation medium (ODM), BMP2 differentiation medium, or control medium (DMEM) for one, seven, 14, and 28 days before protein expression of acetyl-CoA carboxylase, phospho-acetyl-CoA carboxylase, ATP-citrate lyase, phospho-ATP-citrate lyase, acetyl-CoA synthetase, acyl-CoA synthetase, fatty acid synthase, and elongation of very long chain fatty acids protein 6 (ELOVL6) was determined by western blot analysis. Quantification results and statistical analysis are shown in the Supplementary Table 2.
Figure 4
Figure 4
Regulation of membrane lipids during osteogenic differentiation of DFCs. DFCs were cultured in osteogenic differentiation medium (ODM), BMP2 differentiation medium, or control medium (DMEM) for one, seven, 14 and 28 days before the lipidome was analyzed by MS. This figure shows the regulation of total lipids (a) and the fraction of phosphatidylethanolamines (PE, b), phosphatidylcholines (PC, c), phosphatidylinositols (PI, d), phosphatidylserines (PS, e), phosphatidylethanolamine-based plasmalogens (PE P, f), phosphatidylcholine-ethers (PC O, g), sphingomyelins (SM, h), and free cholesterol (FC, i). Data points show means ± standard deviation, and Student's t-test was performed to compare differentiation medium with control medium at the same time point. p < 0.05, ∗∗p < 0.01, ∗∗∗p < 0.001. Asterisks relate to the differentiation medium with data points and line in same color.
Figure 5
Figure 5
Regulation of phosphatidylethanolamines with different numbers of C-atoms and double bonds during osteogenic differentiation of DFCs. DFCs were cultured in osteogenic differentiation medium (ODM), BMP2 differentiation medium, or control medium (DMEM) for one, seven, 14, and 28 days before the lipidome was analyzed by MS. This figure shows the regulation of phosphatidylethanolamines (PE) with different C-atom numbers at day 1 (a), day 7 (b), day 14 (c), and day 28 (d), and PEs with different numbers of double bonds (DB) at day 1 (e), day 7 (f), day 14 (g), and day 28 (h). Results are shown as means + standard deviation, and Student's t-test was performed to compare differentiation medium with the control medium at the same time point. p < 0.05, ∗∗p < 0.01, ∗∗∗p < 0.001. Asterisks relate to the differentiation medium with bars in same color.
Figure 6
Figure 6
Regulation of storage lipids and diacylglycerol during osteogenic differentiation of DFCs. DFCs were cultured in osteogenic differentiation medium (ODM), BMP2 differentiation medium, or control medium (DMEM) for one, seven, 14, and 28 days before the lipidome was analyzed by MS. (a–c) The line charts show the fraction of diacylglycerols (DG, a), triacylglycerols (TG, b), and cholesteryl esters (CE, c). Data points show means ± standard deviation, and Student's t-test was performed to compare differentiation medium with control medium at the same time point. p < 0.05, ∗∗p < 0.01, ∗∗∗p < 0.001. Asterisks relate to the differentiation medium with data points and line in same color. (d, e) Furthermore, the composition of DG species (d) and TG species (e) in cells treated with ODM at the different time points is shown. Only species with an abundance of more than 2% for at least one time point are shown as means + standard deviation, and one-way ANOVA was performed to determine significant differences in the fraction of a specific species at different time points. ∗∗p < 0.01, ∗∗∗p < 0.001.
Figure 7
Figure 7
Regulation of osteogenic differentiation in DFCs after inhibition of fatty acid synthesis. DFCs were cultured in osteogenic differentiation medium (ODM), BMP2 differentiation medium, or control medium (DMEM) and simultaneously treated with 5 μg/ml fatty acid synthesis inhibitors TOFA or C75 or vehicle control for different time periods before evaluation of osteogenic differentiation markers: (a, b) Gene expressions of COL1A2 (a) and RUNX2 (b) relative to gene expression of GAPDH were determined after three days treatment by RT-qPCR. (c) Activity of alkaline phosphatase (ALP) relative to total protein was measured after seven days treatment. (d) Mineralization of extracellular matrix was determined by Alizarin Red staining after 28 days treatment. Photographic pictures of the staining are shown below the bar chart which shows the relative quantification results as means + standard deviation. Student's t-tests were performed to compare inhibitor treatment with the vehicle control. p < 0.05, ∗∗p < 0.01, ∗∗∗p < 0.001.

Similar articles

Cited by

References

    1. Larsson L., Decker A. M., Nibali L., Pilipchuk S. P., Berglundh T., Giannobile W. V. Regenerative medicine for periodontal and peri-implant diseases. Journal of Dental Research . 2016;95(3):255–266. doi: 10.1177/0022034515618887. - DOI - PMC - PubMed
    1. Liu J., Ruan J., Weir M. D., et al. Periodontal bone-ligament-cementum regeneration via scaffolds and stem cells. Cells . 2019;8(6):p. 537. doi: 10.3390/cells8060537. - DOI - PMC - PubMed
    1. Zavan B., Bressan E., editors. Dental Stem Cells: Regenerative Potential . Cham: Springer International Publishing; 2016. - DOI
    1. Zhou T., Pan J., Wu P., et al. Dental follicle cells: roles in development and beyond. Stem Cells International . 2019;2019:17. doi: 10.1155/2019/9159605.9159605 - DOI - PMC - PubMed
    1. Morsczeck C., Reichert T. E. Dental stem cells in tooth regeneration and repair in the future. Expert Opinion on Biological Therapy . 2018;18(2):187–196. doi: 10.1080/14712598.2018.1402004. - DOI - PubMed

LinkOut - more resources