

A Pilot Pre and Post 4 Week Intervention Evaluating the Effect of a Proprietary, Powdered, Plant Based Food on Micronutrient Status, Dietary Intake, and Markers of Health in a Healthy Adult Population
- PMID: 35903454
- PMCID: PMC9315961
- DOI: 10.3389/fnut.2022.945622
A Pilot Pre and Post 4 Week Intervention Evaluating the Effect of a Proprietary, Powdered, Plant Based Food on Micronutrient Status, Dietary Intake, and Markers of Health in a Healthy Adult Population
Abstract
Background: A "balanced, adequate, and varied diet" is recommended as the basis of nutritionally sound diet by the World Health Organisation and national public health agencies. Huel is a proprietary, on-the-go, powdered, plant based food, providing all 26 essential vitamins and minerals, protein, essential fats, carbohydrate, fibre, and phytonutrients.
Objectives: Assessing the effect of solely consuming Huel on micronutrient status, dietary intake and markers of health was achieved through a 4-week intervention of solely Huel powder.
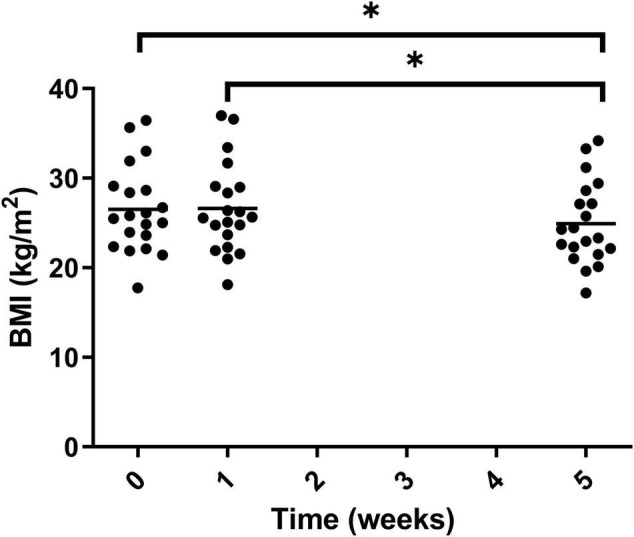
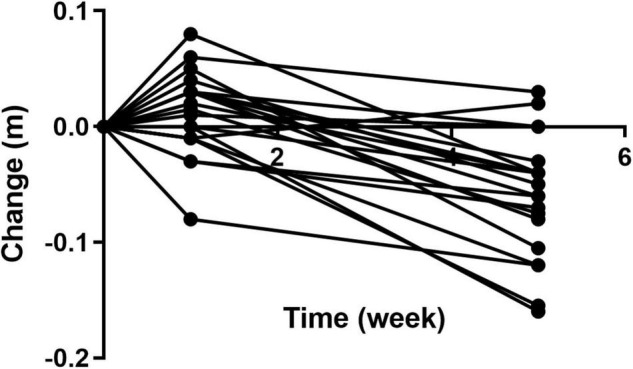
Methods: Habitual energy intake was assessed through a one-week lead in period with healthy adult participants (aged 18 or over) logging their food intake, after which only Huel was consumed for 4 weeks. Blood samples and body composition was assessed before and after the lead in week as well the end of the intervention. Thirty participants were recruited with 20 (11 females, median age 31, range 22-44) completing the study, 19 sets of blood samples were collected. 22 blood markers were analysed along with weight, BMI, waist circumference, visceral adipose tissue (VAT), and body composition. All blood micronutrients, except for Thyroid Stimulating Hormone and choline were sent to Royal Victoria Infirmary NHS, Newcastle Laboratory (Newcastle upon Tyne, United Kingdom) for analysis.
Results: Fourteen of the parameters significantly changed over the course of the study with circulating haemoglobin, iron, vitamins B12 and D as well as selenium significantly increasing (p < 0.05). HbA1c, total and non-HDL cholesterol, vitamins A and E, potassium, BMI, VAT, and waist circumference all significantly decreased (p < 0.05) post intervention.
Conclusion: Although energy intake decreased during the intervention period, the adherence to recommended micronutrient intake, as quantified by the dietary Total Adherence Score, significantly increased which tallies with the preservation or improvement of micronutrient status. This study potentially demonstrates that consuming only Huel for 4 weeks does not negatively affect micronutrient status.
Keywords: Huel; intervention study; micronutrient; micronutrient status; vitamin status.
Copyright © 2022 Wilcox, Chater, Stanforth, Williams, Brownlee and Pearson.
Conflict of interest statement
This study received funding from Huel Ltd. The funder had the following involvement with the study: design of research question and input in the design of the study. MW, PC, IB, and JP are co-founds and shareholders in Aelius Biotech. The remaining authors declare that the research was conducted in the absence of any commercial or financial relationships that could be construed as a potential conflict of interest.
Figures


Similar articles
-
Folic acid supplementation and malaria susceptibility and severity among people taking antifolate antimalarial drugs in endemic areas.Cochrane Database Syst Rev. 2022 Feb 1;2(2022):CD014217. doi: 10.1002/14651858.CD014217. Cochrane Database Syst Rev. 2022. PMID: 36321557 Free PMC article.
-
A Landscape of Micronutrient Dietary Intake by 15- to 65-Years-Old Urban Population in 8 Latin American Countries: Results From the Latin American Study of Health and Nutrition.Food Nutr Bull. 2024 Sep;45(2_suppl):S11-S25. doi: 10.1177/03795721231215267. Epub 2023 Dec 19. Food Nutr Bull. 2024. PMID: 38112070
-
Micronutrient Inadequacy Differs by Intake of Fat Amount and Class Among Adults That Consume a Restricted Carbohydrate Diet: National Health and Nutrition Examination Survey, 2007-2018.J Acad Nutr Diet. 2025 Apr;125(4):501-514.e1. doi: 10.1016/j.jand.2024.11.001. Epub 2024 Nov 7. J Acad Nutr Diet. 2025. PMID: 39521380
-
Marginal Micronutrient Intake in High-Performance Male Wheelchair Basketball Players: A Dietary Evaluation and the Effects of Nutritional Advice.PLoS One. 2016 Jul 6;11(7):e0157931. doi: 10.1371/journal.pone.0157931. eCollection 2016. PLoS One. 2016. PMID: 27383836 Free PMC article.
-
Fortification of rice with vitamins and minerals for addressing micronutrient malnutrition.Cochrane Database Syst Rev. 2019 Oct 25;2019(10):CD009902. doi: 10.1002/14651858.CD009902.pub2. Cochrane Database Syst Rev. 2019. PMID: 31684687 Free PMC article.
Cited by
-
The Nutritional Quality of Food Provision at UK Government-Funded Holiday Clubs: A Cross-Sectional Analysis of Energy and Nutrient Content.Nutrients. 2023 Apr 18;15(8):1937. doi: 10.3390/nu15081937. Nutrients. 2023. PMID: 37111156 Free PMC article.
References
-
- British-Nutrition-Foundation. A Healthy, Balanced Diet. (2022). Available online at: https://www.nutrition.org.uk/healthy-sustainable-diets/healthy-and-susta... (accessed Feb, 2022).
-
- World-Health-Organisation. Benefits of a Balanced Diet. (2022). Available online at: https://www.euro.who.int/en/health-topics/disease-prevention/nutrition/a... (accessed Feb, 2022).
-
- World-Health-Organisation. Food Based Dietary Guidelines in the WHO European Region (Eur/03/5045414). Contract No.: E79832. Europe: World Health Organisation; (2003).
Grants and funding
LinkOut - more resources
Full Text Sources