. 2022 Jul 5;7(1):ysac009.
doi: 10.1093/synbio/ysac009. eCollection 2022.

Signal amplification of araC pBAD using a standardized translation initiation region

Affiliations

Signal amplification of araC pBAD using a standardized translation initiation region

Patrick J Shilling et al. Synth Biol (Oxf). .

Abstract

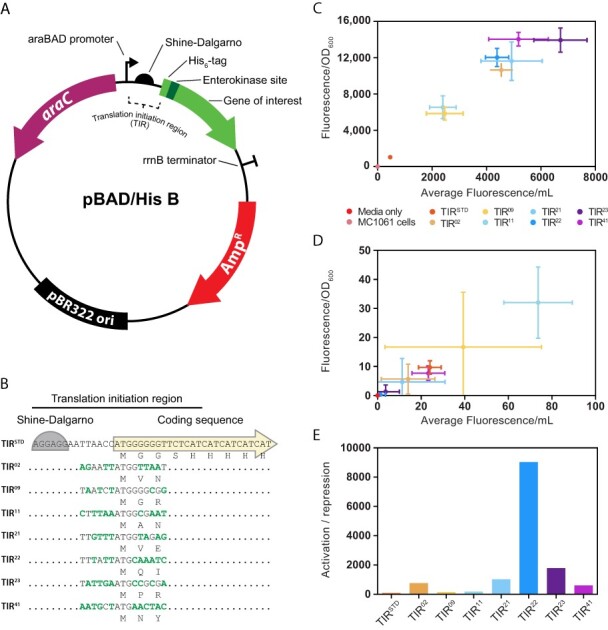
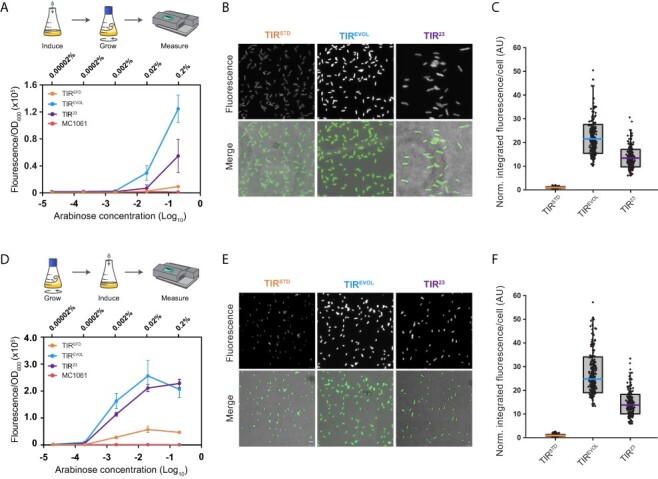
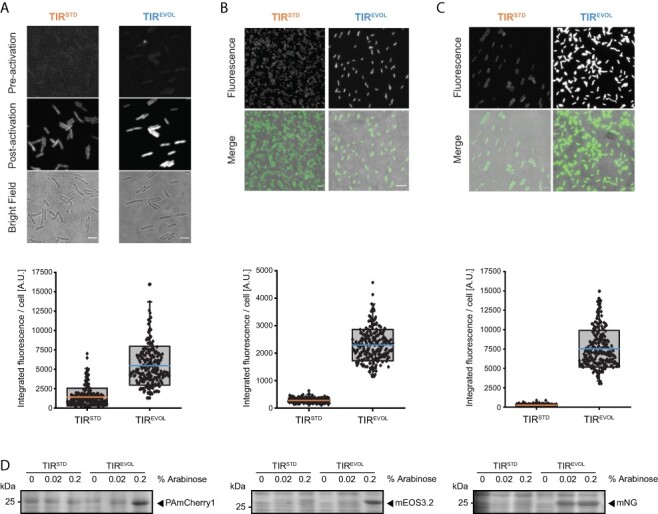
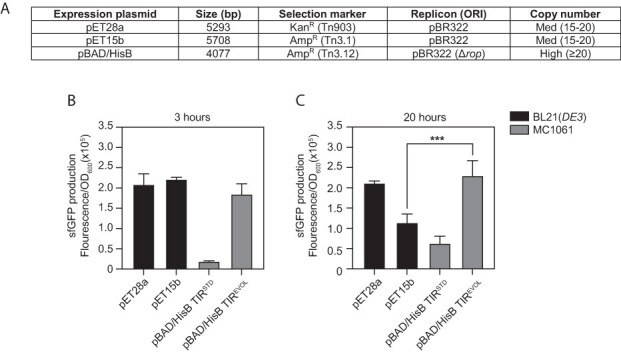
araC pBAD is a genetic fragment that regulates the expression of the araBAD operon in bacteria, which is required for the metabolism of L-arabinose. It is widely used in bioengineering applications because it can drive regulatable and titratable expression of genes and genetic pathways in microbial cell factories. A notable limitation of araC pBAD is that it generates a low signal when induced with high concentrations of L-arabinose (the maximum ON state). Herein we have amplified the maximum ON state of araC pBAD by coupling it to a synthetically evolved translation initiation region (TIREVOL ). The coupling maintains regulatable and titratable expression from araC pBAD and yet increases the maximal ON state by >5-fold. The general principle demonstrated in the study can be applied to amplify the signal from similar genetic modules. Graphical Abstract.

Keywords: araC pBAD; genetic sensor module; pBAD/HisB; synthetic evolution; translation initiation region.


Figures

Figure 1.
Figure 1.
Performance of the araC pBAD genetic sensor in the pBAD/HisB expression plasmid. (A) Illustration of the pBAD/HisB expression plasmid that was used in the study. Genes of interest are cloned downstream of a region encoding for a poly-Histidine purification tag, an Xpress™ epitope for detection of recombinant proteins and an enterokinase cleavage site. Resistance to ß-lactam antibiotics is conferred by the bla gene encoding the TEM-1 ß-lactamase (denoted AmpR). AmpR is harbored on a Tn3.12 fragment (44). (B) The translation initiation region embedded in pBAD/HisB, denoted TIRSTD, stretches from the Shine–Dalgarno sequence to the poly-Histidine purification tag. TIRs identified in this study, isolated from individual colonies, are denoted with a number. The resulting nucleotide changes are marked in bold text and corresponding amino acid changes are denoted. Note that TIR22 was renamed TIREVOL. (C) The efficiency of araC pBAD with various TIRs was calculated by transforming pBAD/HisB into MC1061 and inducing cells with 0.2% (w/v) L-arabinose for 2 h (i.e. activation). Data are presented as mean ± S.D. (n = 3). (D) As for (C) except that 0.2% (w/v) D-glucose was used (i.e. ‘repression’). (E) The activation:repression ratio (i.e. average activation/average repression) of araC pBAD together with various TIRs was calculated using values obtained in (C) and (D).
Figure 2.
Figure 2.
araC pBAD is titratable with different TIRs. (A) MC1061 cells harboring pBAD/HisB-sfGFP with either TIRSTD, TIREVOL or TIR23 were incubated in the presence of varying concentrations of L-arabinose and grown to mid-exponential phase as described by Guzman et al. (4). sfGFP fluorescence was then quantified from whole-cell pellets. Data are presented as mean ± S.D. (n = 3). (B) Visualization of cells by fluorescence microscopy. These cells were induced with 0.2% (w/v) L-arabinose, as described in Panel (A). Scale bars = 4 µm. (C) Box and whisker plot of fluorescence values obtained from individual cells is shown in Panel (B). Values were normalized to TIRSTD. n = 244 for TIRSTD, n = 257 for TIREVOL and n = 226 for TIR23. Fluorescence intensity per cell was on average 21.5 times higher when TIREVOL was used and 13.5 times higher when TIR23 was used (i.e. compared to TIRSTD). (D) As for Panel (A) except that cells were grown to mid-exponential phase before varying concentrations of L-arabinose were added, as per the manufacturers’ instructions (41). Data are presented as mean ± S.D. (n = 3). (E) Visualization of cells by fluorescence microscopy. These cells were induced with 0.2% (w/v) L-arabinose, as described in Panel (D). Scale bars = 4 µm. (F) Box and whisker plot of fluorescence values obtained from individual cells shown in Panel (E) (n = 242 for TIRSTD, n = 262 for TIREVOL and n = 211 for TIR23). The fluorescence intensity per cell was on average 26.5 times higher when TIREVOL was used and 14 times higher when TIR23 was used (compared to TIRSTD). Note in (C) and (F) that raw fluorescence values of TIREVOL and TIR23 were normalized by the average value of the respective TIRSTD. The edges of the box show S.D., colored mid line is mean and whiskers indicate the 1–99% interval. Note also that variability in the data was partly caused by the fact that measurements were made on cells that were at different stages of their cell cycle (which affects cell size and, therefore, total fluorescence).
Figure 3.
Figure 3.
Output from araC pBAD and TIREVOL is increased across multiple coding sequences. Expression of (A) PAmCherry1, (B) mEos3.2 and (C) mNeonGreen from pBAD/HisB-sfGFP (TIRSTD and TIREVOL). All plasmids were harbored in the MC1061 strain and induced with 0.2% (w/v) L-arabinose. Cells were visualized by fluorescence microscopy (top panels) (scale bars = 4 µm). Note that PAmCherry1 has to be activated for visualization and that mEos3.2 was imaged in its green state. Fluorescence intensity values from individual cells were quantified (bottom panels): PAmCherry1 (TIRSTD) = 1414 ± 1137 (mean ± S.D.) (n = 244), PAmCherry1 (TIREVOL) = 5457 ± 2516 (n = 219). mEos3.2 (TIRSTD) = 257 ± 81 (n = 217), mEos3.2 (TIREVOL) = 2291 ± 571 (n = 243). mNeonGreen (TIRSTD) = 227 ± 67 (n = 251), mNeonGreen (TIREVOL) = 7037 ± 1456 (n = 229). The edges of the box show S.D., colored mid line is mean and whiskers indicate the 1–99% interval. Note also that variability in the data was partly caused by the fact that measurements were made on cells that were at different stages of their cell cycle (which affects cell size and, therefore, total fluorescence) (D) Cells were induced with different concentrations of L-arabinose and then separated by SDS-PAGE and stained with Coomassie. Unprocessed gel images are available in the Online Supplement, Supplementary Figures S2 and S3.
Figure 4.
Figure 4.
araC pBAD and TIREVOL cooperate effectively in recombinant protein production. (A) Salient features of the pBAD/HisB, pET28a and pET15b expression plasmids, which were used in this experiment. Comparative expression levels of sfGFP after (B) 3 h or (C) 20 h of induction. Fluorescence values were normalized by the OD600 of the culture. pET28a and pET15b were harbored in the BL21(DE3) strain and induced with 1 mM IPTG. pBAD/HisB-sfGFP (TIRSTD and TIREVOL) were harbored in the MC1061 strain and induced with 0.2% (w/v) L-arabinose. Data are presented as mean ± S.D. (n = 3). A statistically significant difference of P < 0.001 is denoted by *** (two-tailed Student’s t-test).

References

    1. Voigt C.A. (2006) Genetic parts to program bacteria. Curr. Opin. Biotechnol., 17, 548–557. - PubMed
    1. Zhang J., Jensen M.K. and Keasling J.D. (2015) Development of biosensors and their application in metabolic engineering. Curr. Opin. Chem. Biol., 28, 1–8. - PubMed
    1. Brophy J.A.N. and Voigt C.A. (2014) Principles of genetic circuit design. Nat. Methods, 11, 508–520. - PMC - PubMed
    1. Hossain G.S., Saini M., Miyake R., Ling H. and Chang M.W. (2020) Genetic biosensor design for natural product biosynthesis in microorganisms. Trends Biotechnol., 38, 797–810. - PubMed
    1. Rogers J.K., Taylor N.D. and Church G.M. (2016) Biosensor-based engineering of biosynthetic pathways. Curr. Opin. Biotechnol., 42, 84–91. - PubMed

LinkOut - more resources