. 2022 Nov 2;73(19):6891-6901.
doi: 10.1093/jxb/erac320.

Enhanced abundance and activity of the chloroplast ATP synthase in rice through the overexpression of the AtpD subunit

Affiliations

Enhanced abundance and activity of the chloroplast ATP synthase in rice through the overexpression of the AtpD subunit

Maria Ermakova et al. J Exp Bot. .

Abstract

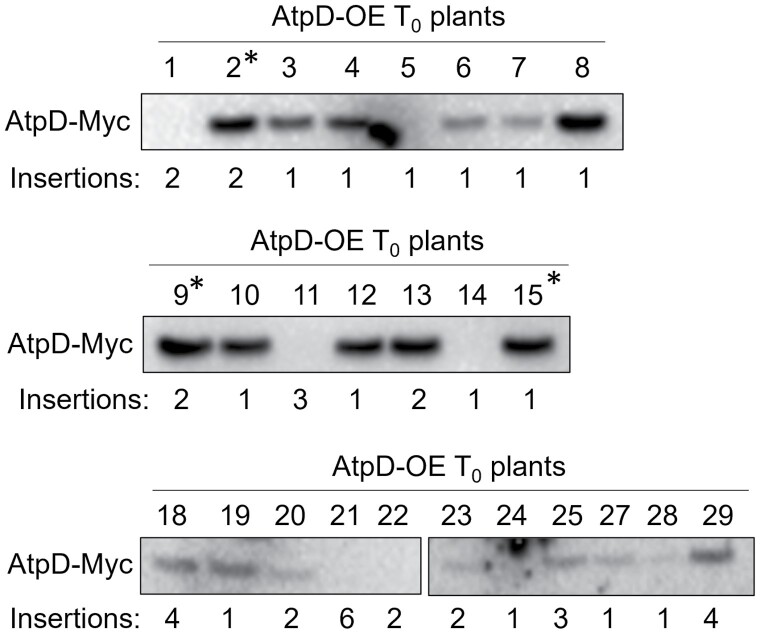
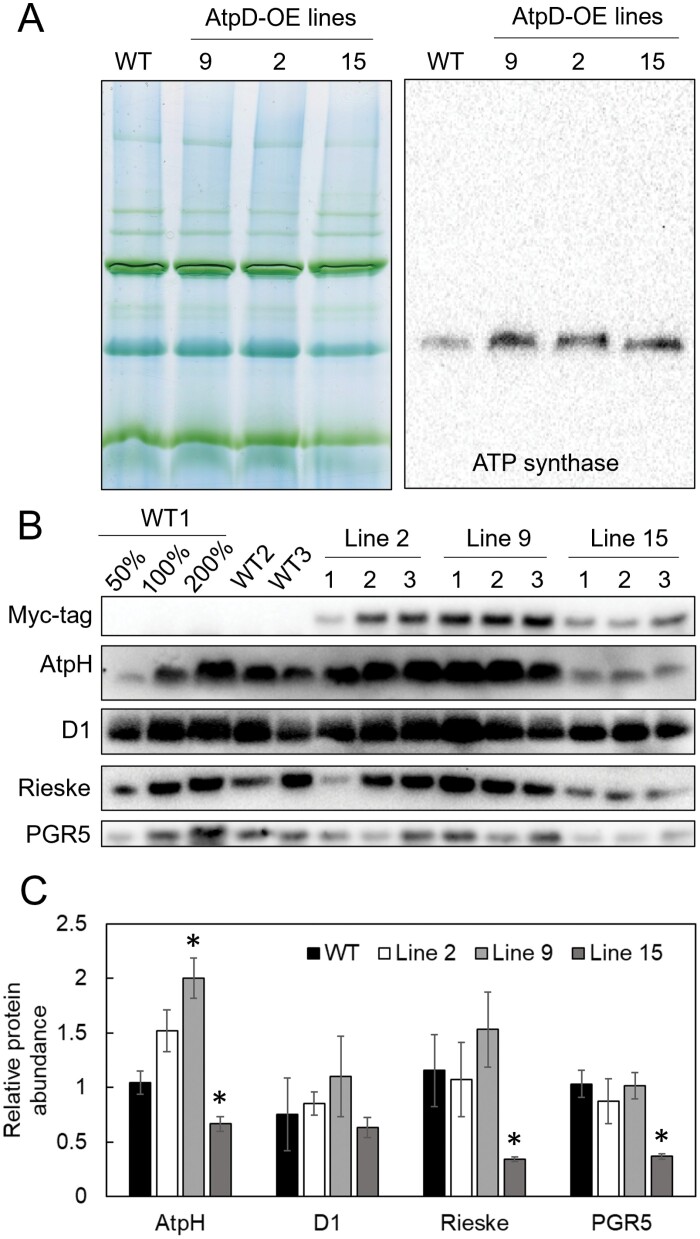
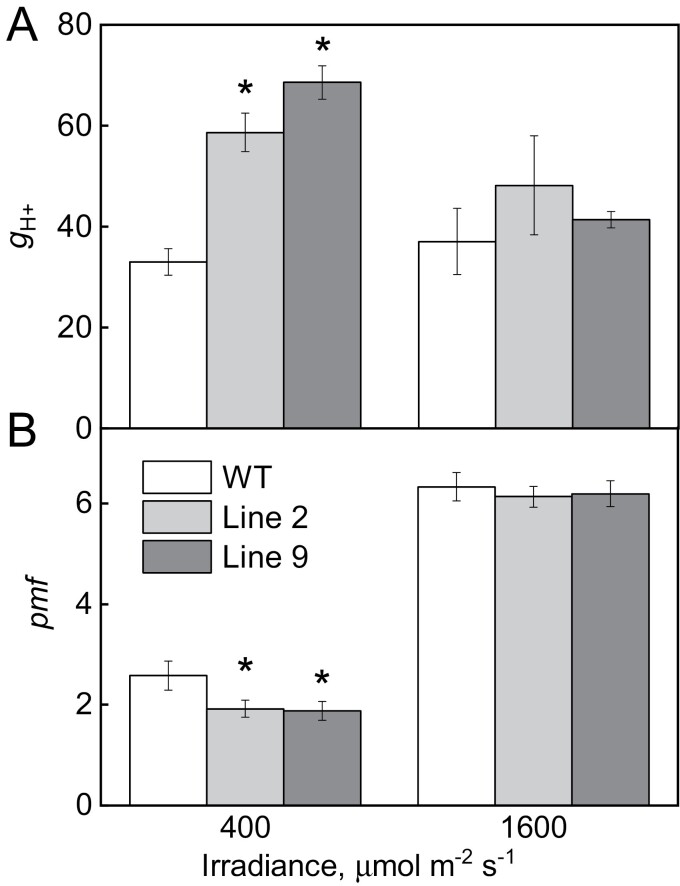
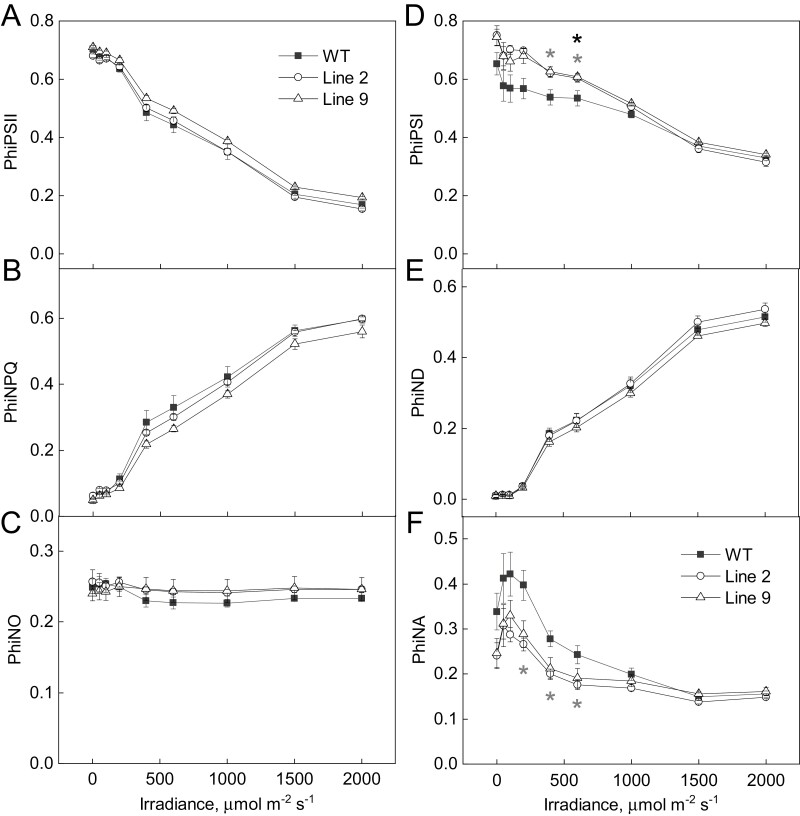
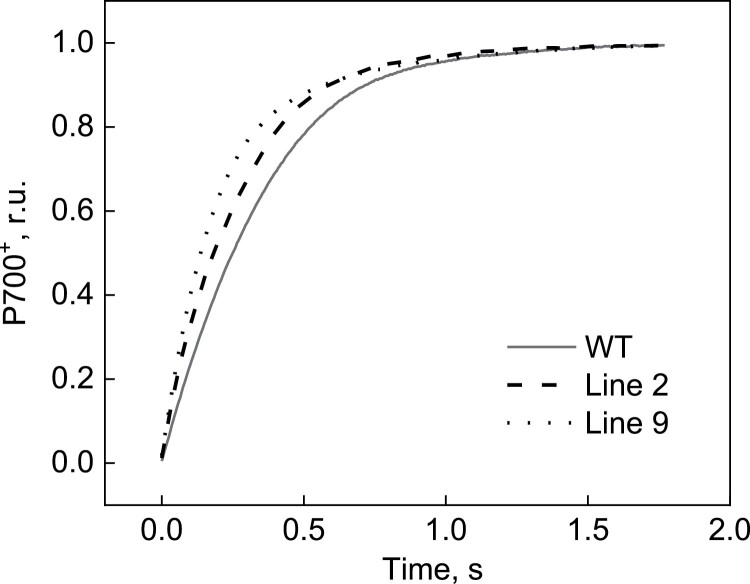
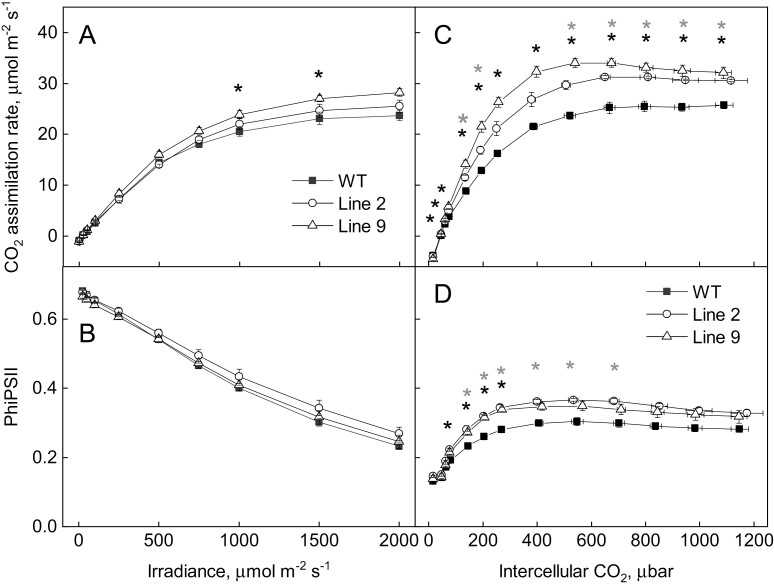
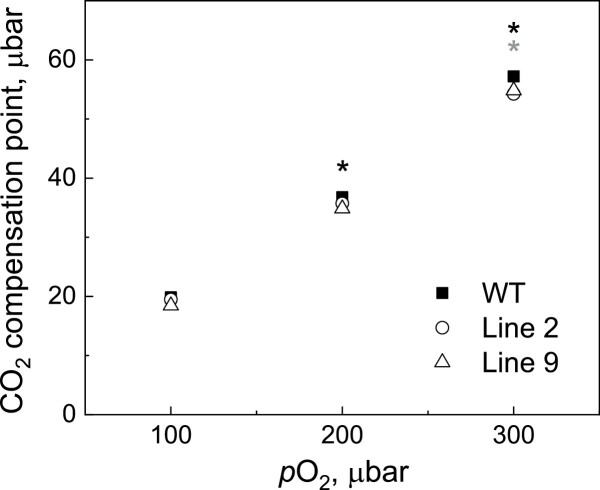
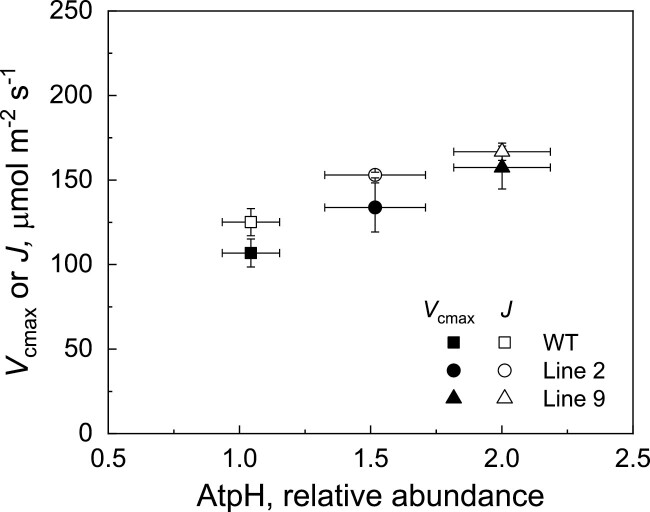
ATP, produced by the light reactions of photosynthesis, acts as the universal cellular energy cofactor fuelling all life processes. Chloroplast ATP synthase produces ATP using the proton motive force created by solar energy-driven thylakoid electron transport reactions. Here we investigate how increasing abundance of ATP synthase affects leaf photosynthesis and growth of rice, Oryza sativa variety Kitaake. We show that overexpression of AtpD, the nuclear-encoded subunit of the chloroplast ATP synthase, stimulates both abundance of the complex, confirmed by immunodetection of thylakoid complexes separated by Blue Native-PAGE, and ATP synthase activity, detected as higher proton conductivity of the thylakoid membrane. Plants with increased AtpD content had higher CO2 assimilation rates when a stepwise increase in CO2 partial pressure was imposed on leaves at high irradiance. Fitting of the CO2 response curves of assimilation revealed that plants overexpressing AtpD had a higher electron transport rate (J) at high CO2, despite having wild-type-like abundance of the cytochrome b6f complex. A higher maximum carboxylation rate (Vcmax) and lower cyclic electron flow detected in transgenic plants both pointed to an increased ATP production compared with wild-type plants. Our results present evidence that the activity of ATP synthase modulates the rate of electron transport at high CO2 and high irradiance.

Keywords: ATP synthase; CO2 assimilation; electron transport; photosynthesis; proton motive force; thylakoid membrane.


Figures

Fig. 1.
Fig. 1.
Selection of T0 rice plants transformed with the construct for AtpD overexpression (AtpD-OE). Immunodetection of AtpD-Myc in leaf protein extracts, 15 µg of protein loaded for each sample. The copy number of the hygromycin phosphotransferase gene (hpt) detected by digital PCR was used to estimate the number of construct insertions. *Lines 2, 9, and 15 were selected for further experiments.
Fig. 2.
Fig. 2.
Immunodetection of photosynthetic proteins in WT O. sativa and transgenic lines overexpressing AtpD. (A) Thylakoid protein complexes separated by Blue Native-PAGE and probed with antibodies against whole ATP synthase; 10 µg of Chl (a+b) loaded in each lane. (B) Leaf protein samples loaded on a leaf area basis and probed with antibodies against Myc-tag, AtpH (subunit c of ATP synthase), D1 subunit of PSII, Rieske subunit of Cyt b6f, and PGR5 (PROTON GRADIENT REGULATION5). (C) Relative quantification of immunoblots. Mean ±SE, n=3 biological replicates. Asterisks indicate statistically significant differences between transgenic lines and the WT (t-test, P<0.05).
Fig. 3.
Fig. 3.
Proton conductivity of the thylakoid membrane (gH+) and proton motive force (pmf) estimated from the dark interval relaxation kinetics of ECS in WT O. sativa and transgenic lines overexpressing AtpD. Mean ±SE, n=3-4 biological replicates. Asterisks indicate statistically significant differences between transgenic lines and the WT (t-test, P<0.05).
Fig. 4.
Fig. 4.
Electron transport properties of WT O. sativa and transgenic lines overexpressing AtpD at different irradiances. PhiPSII, quantum yield of PSII; PhiNPQ, quantum yield of non-photochemical quenching; PhiNO, quantum yield of non-regulated non-photochemical quenching; PhiPSI, quantum yield of PSI; PhiND, non-photochemical loss due to the oxidized PSI donors; PhiNA, non-photochemical loss due to the reduced PSI acceptors. Mean ±SE, n=3 biological replicates. Grey asterisks indicate statistically significant differences between line 2 and the WT, black asterisks—between line 9 and the WT (t-test, P<0.05).
Fig. 5.
Fig. 5.
Oxidation kinetics of the reaction centres of PSI (P700) in WT O. sativa and transgenic lines overexpressing AtpD during an increase of irradiance from 218 µmol m−2 s−1 to 417 µmol m−2 s−1. Curves were normalized to the same amplitude to facilitate comparison of the kinetics and present an average of three biological replicates.
Fig. 6.
Fig. 6.
Gas exchange and fluorescence analysis of WT O. sativa and transgenic lines overexpressing AtpD. Mean ±SE, n=4 biological replicates. Grey asterisks indicate statistically significant differences between line 2 and the WT, black asterisks—between line 9 and the WT (t-test, P<0.05).
Fig. 7.
Fig. 7.
Leaf CO2 compensation point measured at different O2 partial pressures (pO2). Mean ±SE, n=3 biological replicates; SE is smaller than the symbols. Grey asterisks indicate statistically significant differences between line 2 and the WT, black asterisks—between line 9 and the WT (t-test, P<0.05).
Fig. 8.
Fig. 8.
Gas exchange parameters obtained by fitting the CO2 response curves of assimilation versus relative protein abundance of AtpH from the immunoblots in Fig. 2.
Fig. 9.
Fig. 9.
Biomass and seed yield of WT O. sativa and transgenic lines overexpressing AtpD. (A) Phenotype of plants during the mid-tillering stage, 4 weeks after germination. (B) Dry weight of the plants harvested at mid-tillering stage, mean ±SE, n=8 biological replicates. (C) Total weight of seeds produced by the plants, mean ±SE, n=4 biological replicates. Asterisks indicate statistically significant differences between transgenic lines and the WT (t-test, P<0.05).

Similar articles

Cited by

References

    1. Azcon-Bieto J, Osmond CB.. 1983. Relationship between photosynthesis and respiration. Plant Physiology 71, 574–581. - PMC - PubMed
    1. Capaldi RA, Aggeler R.. 2002. Mechanism of the F1F0-type ATP synthase, a biological rotary motor. Trends in Biochemical Sciences 27, 154–160. - PubMed
    1. Carmo-Silva E, Scales JC, Madgwick PJ, Parry MAJ.. 2015. Optimizing Rubisco and its regulation for greater resource use efficiency. Plant, Cell & Environment 38, 1817–1832. - PubMed
    1. Carrillo LR, Froehlich JE, Cruz JA, Savage LJ, Kramer DM.. 2016. Multi-level regulation of the chloroplast ATP synthase: the chloroplast NADPH thioredoxin reductase C (NTRC) is required for redox modulation specifically under low irradiance. The Plant Journal 87, 654–663. - PubMed
    1. Chida H, Nakazawa A, Akazaki H, et al. . 2007. Expression of the algal cytochrome c6 gene in Arabidopsis enhances photosynthesis and growth. Plant & Cell Physiology 48, 948–957. - PubMed

Publication types

MeSH terms

Substances