Review
. 2024 Feb;30(1):49-70.
doi: 10.1177/10738584221112336. Epub 2022 Jul 29.

Diverging from the Norm: Reevaluating What Miniature Excitatory Postsynaptic Currents Tell Us about Homeostatic Synaptic Plasticity

Affiliations
Review

Diverging from the Norm: Reevaluating What Miniature Excitatory Postsynaptic Currents Tell Us about Homeostatic Synaptic Plasticity

Andrew G Koesters et al. Neuroscientist. 2024 Feb.

Abstract

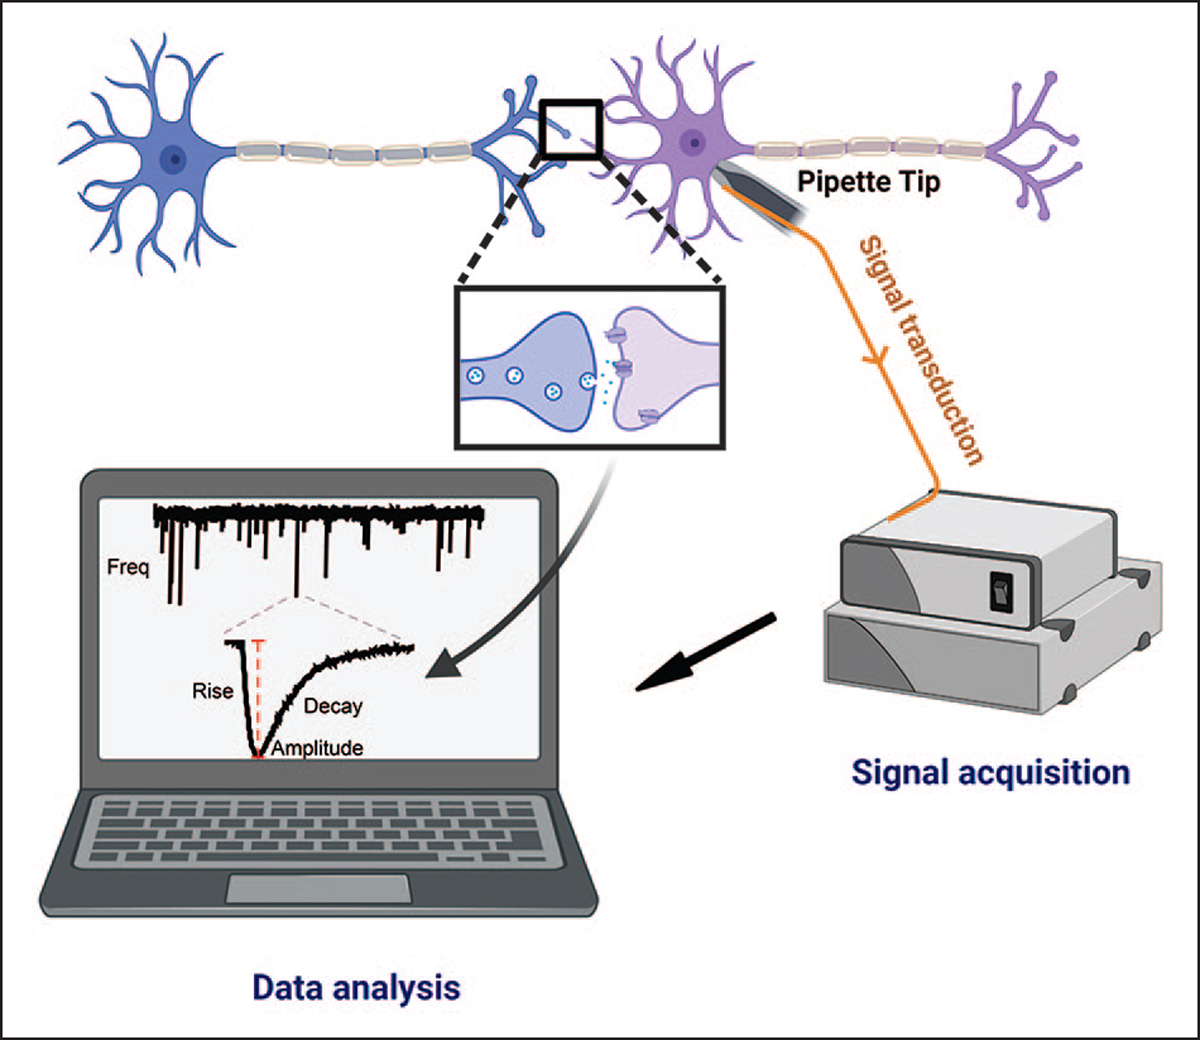
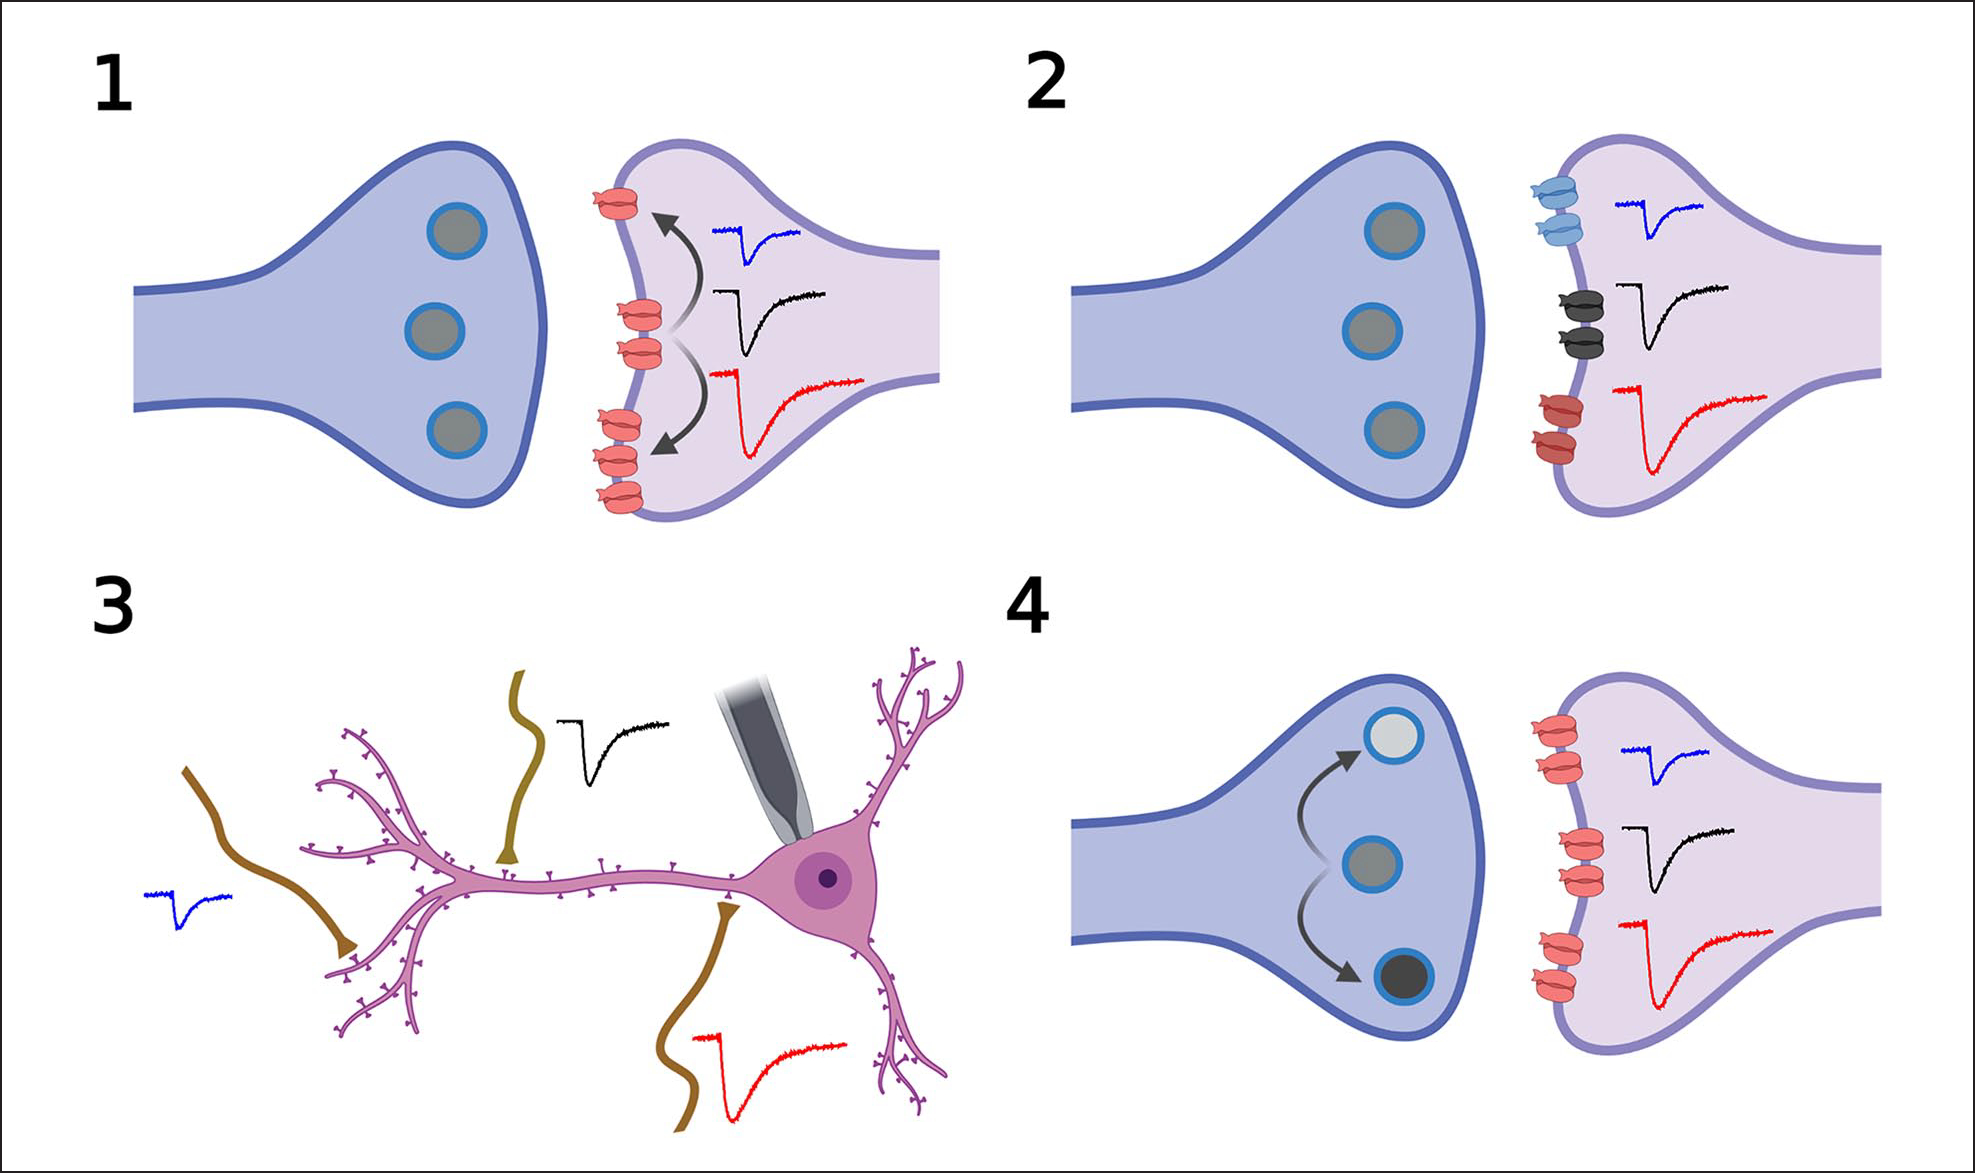
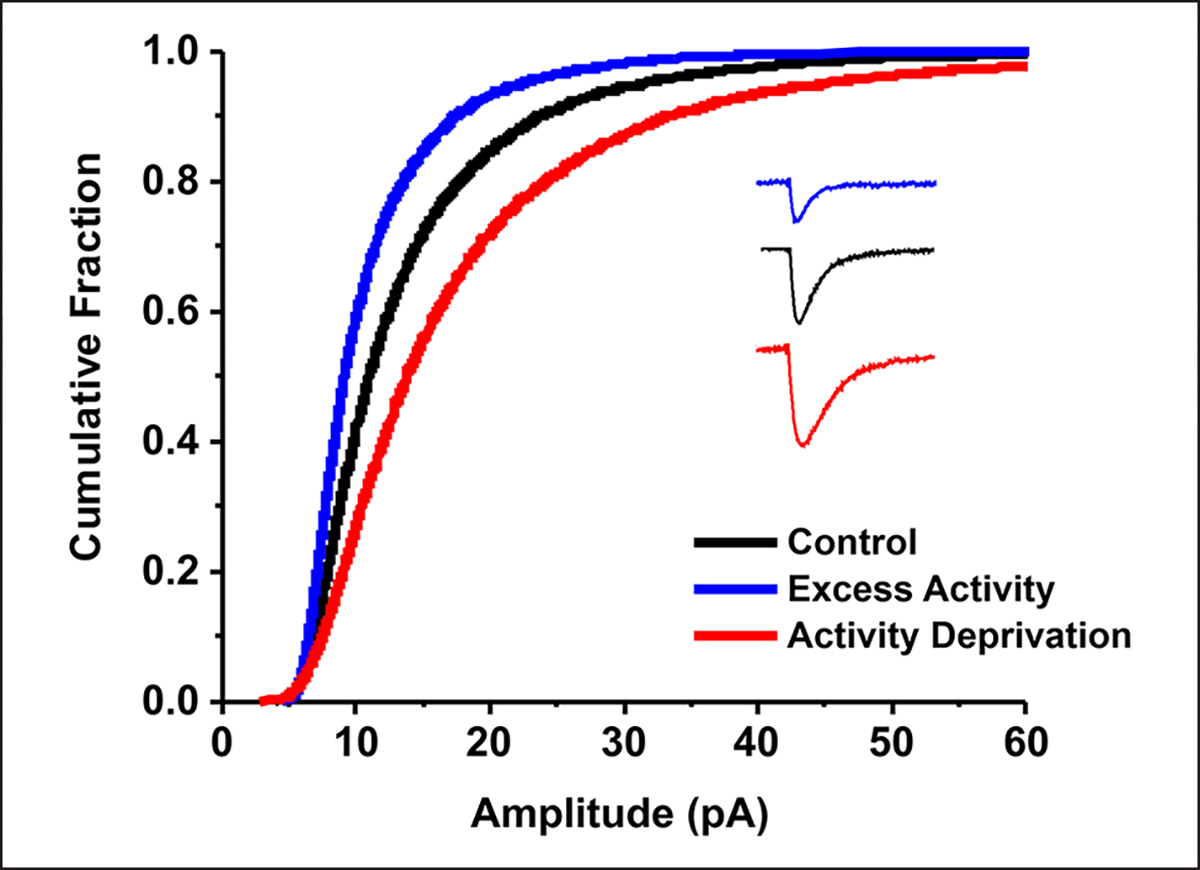
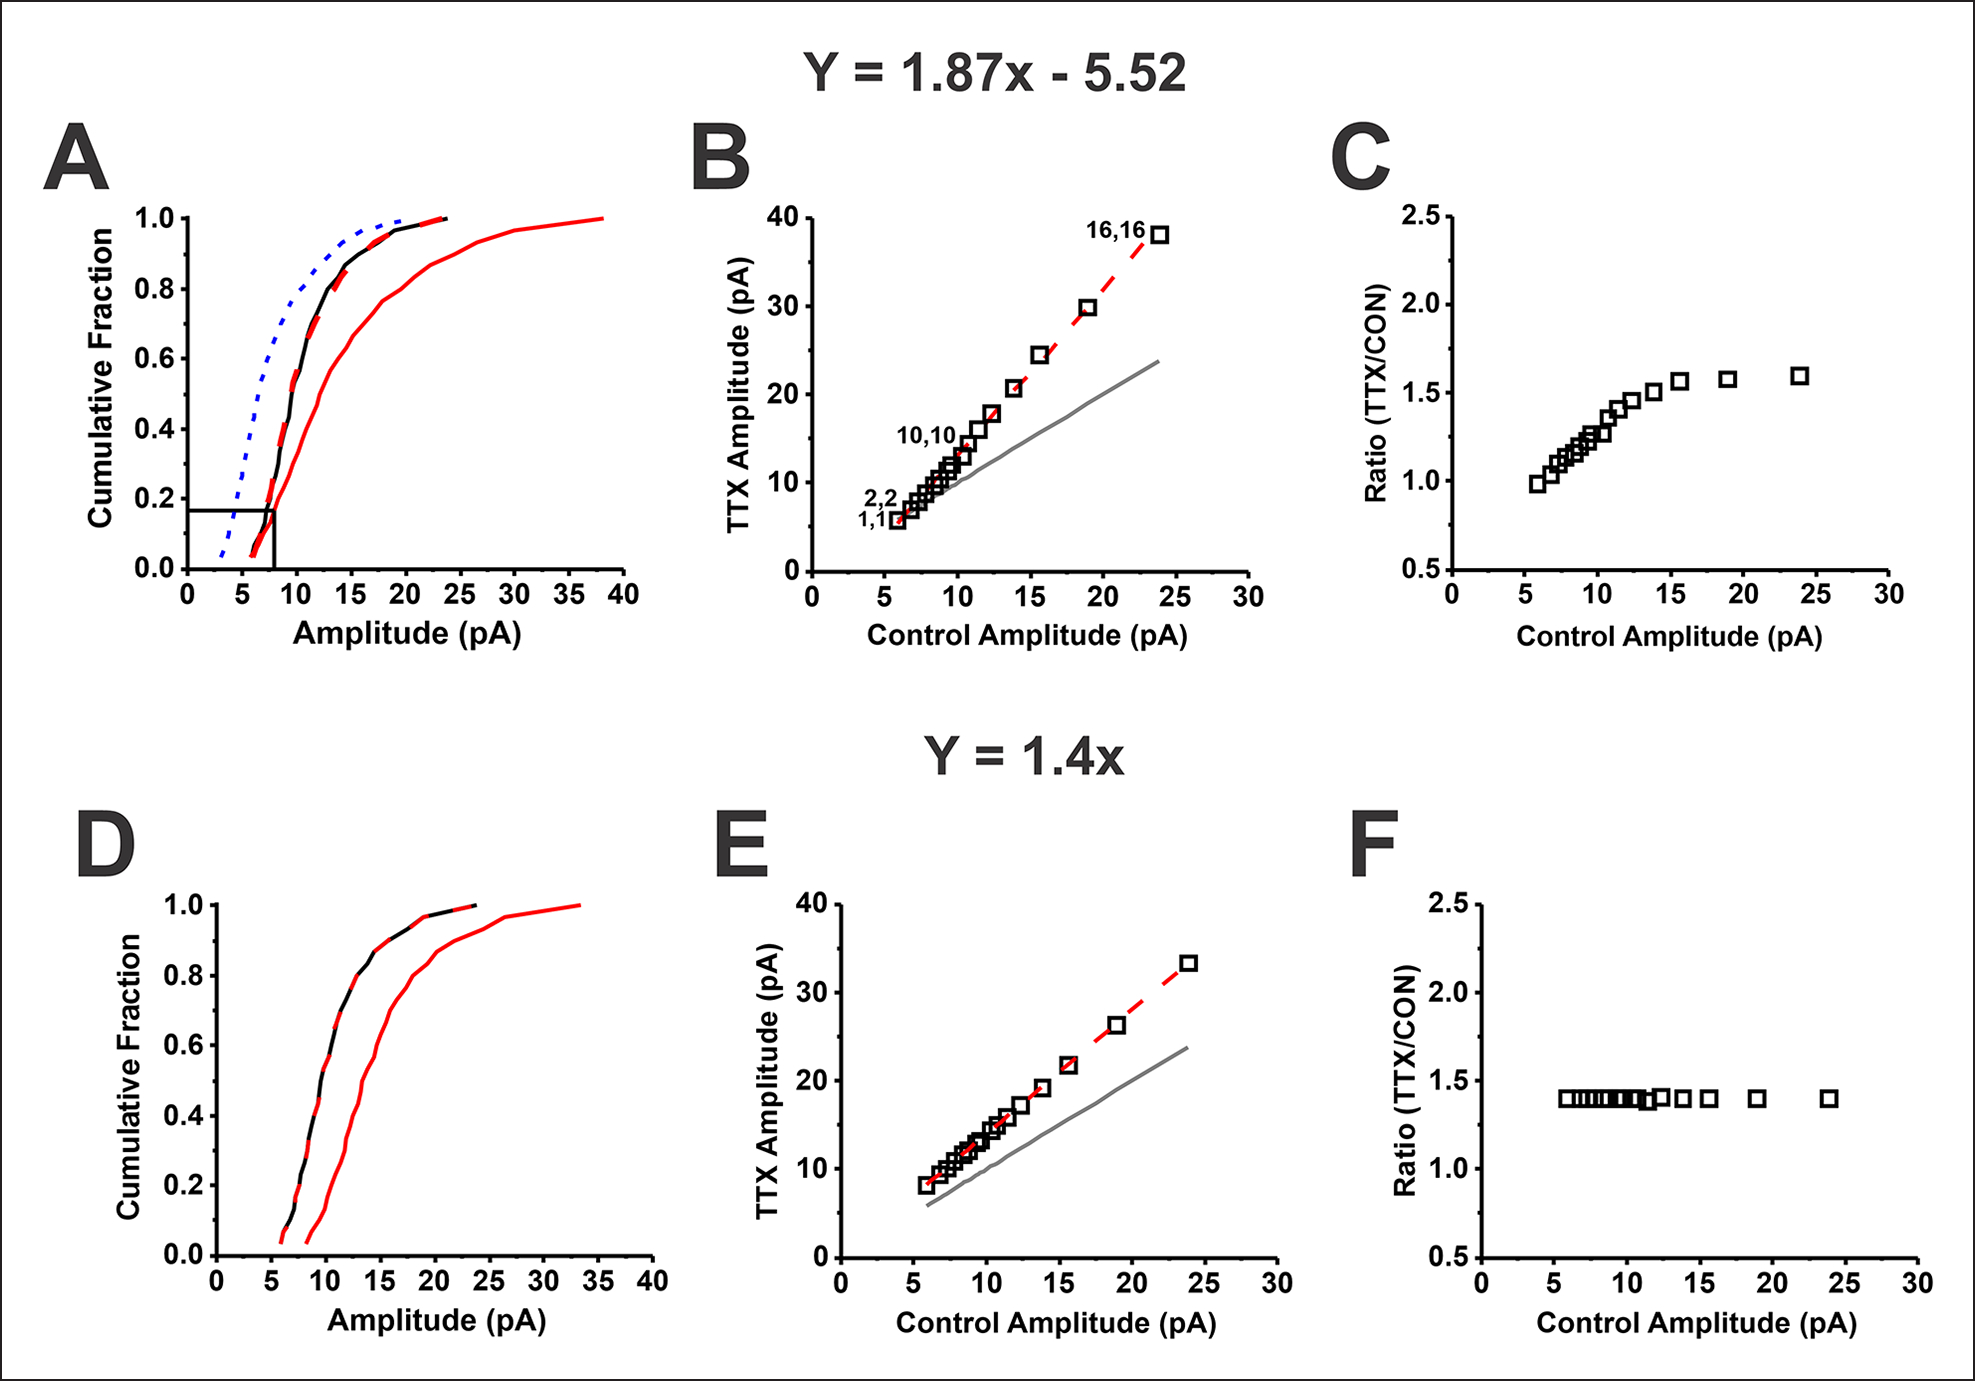
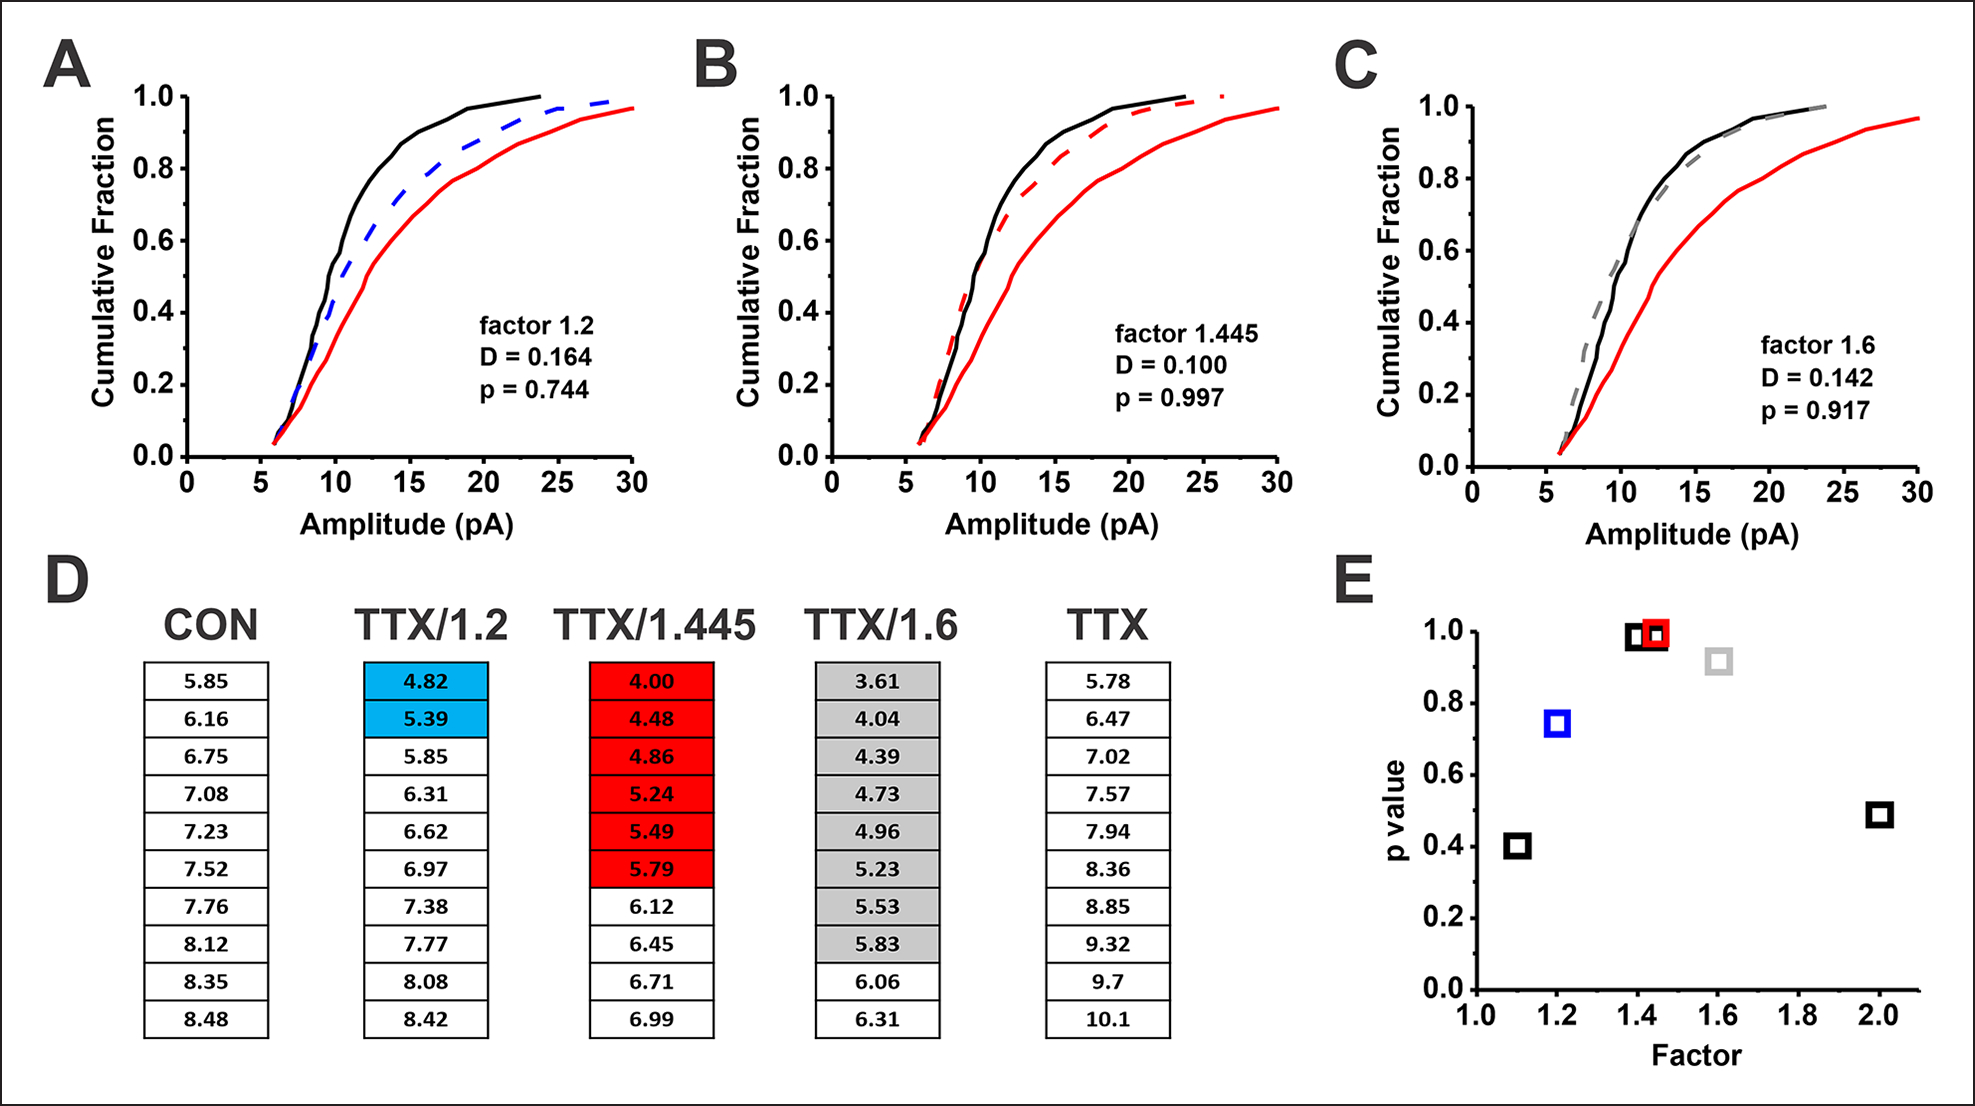
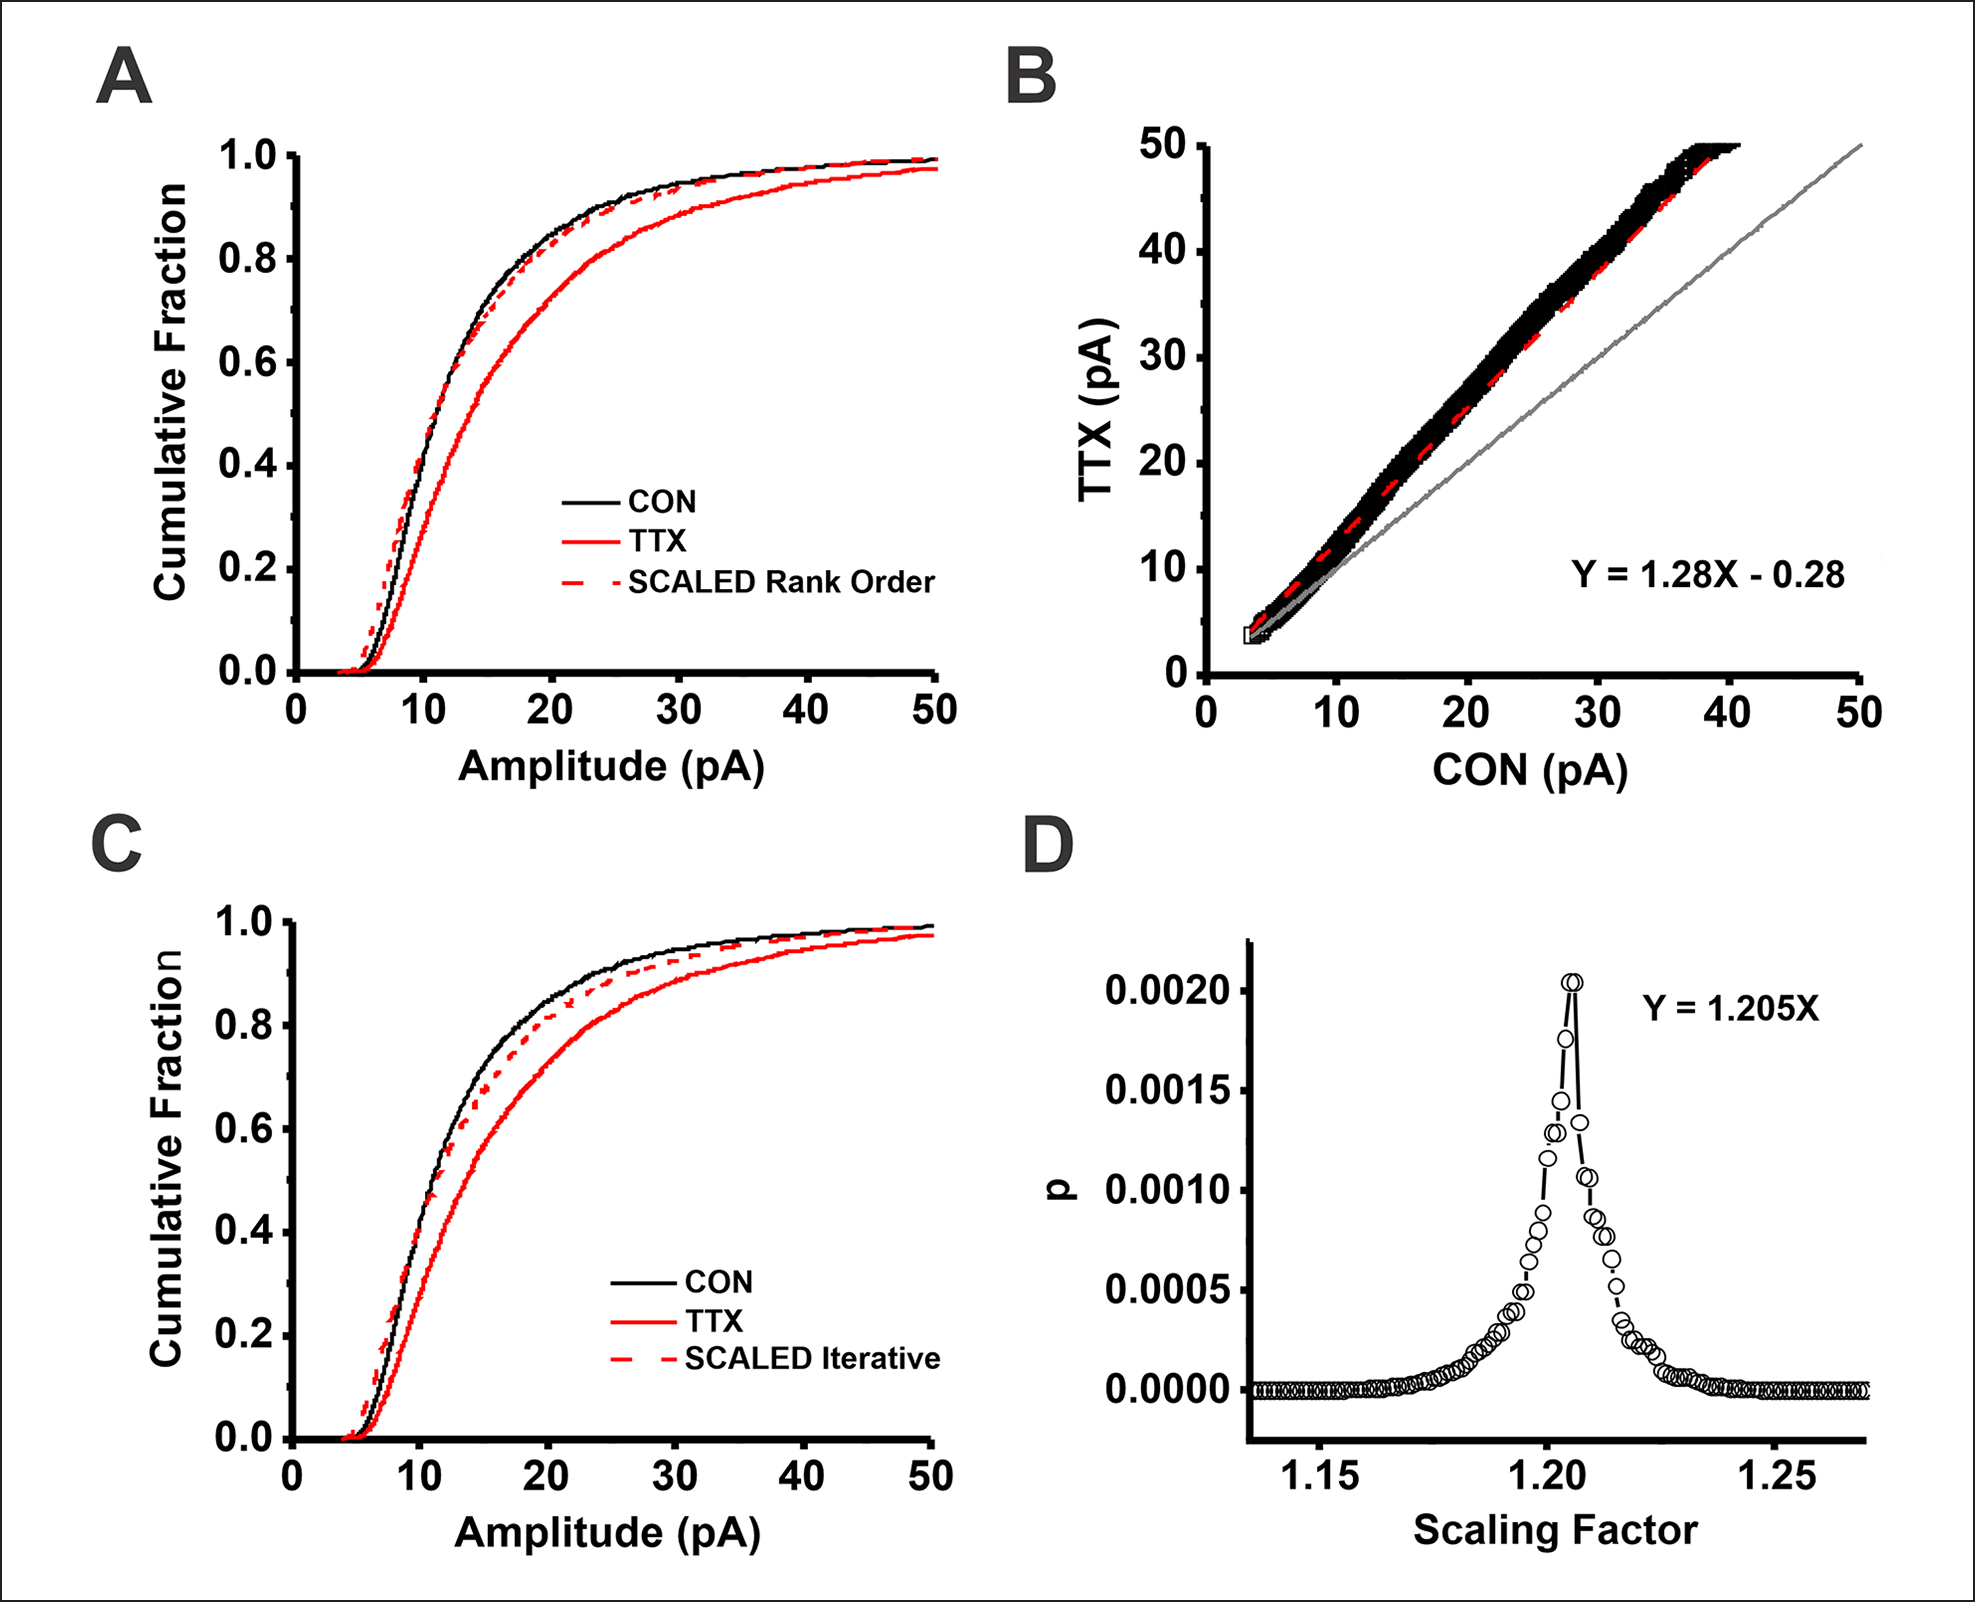
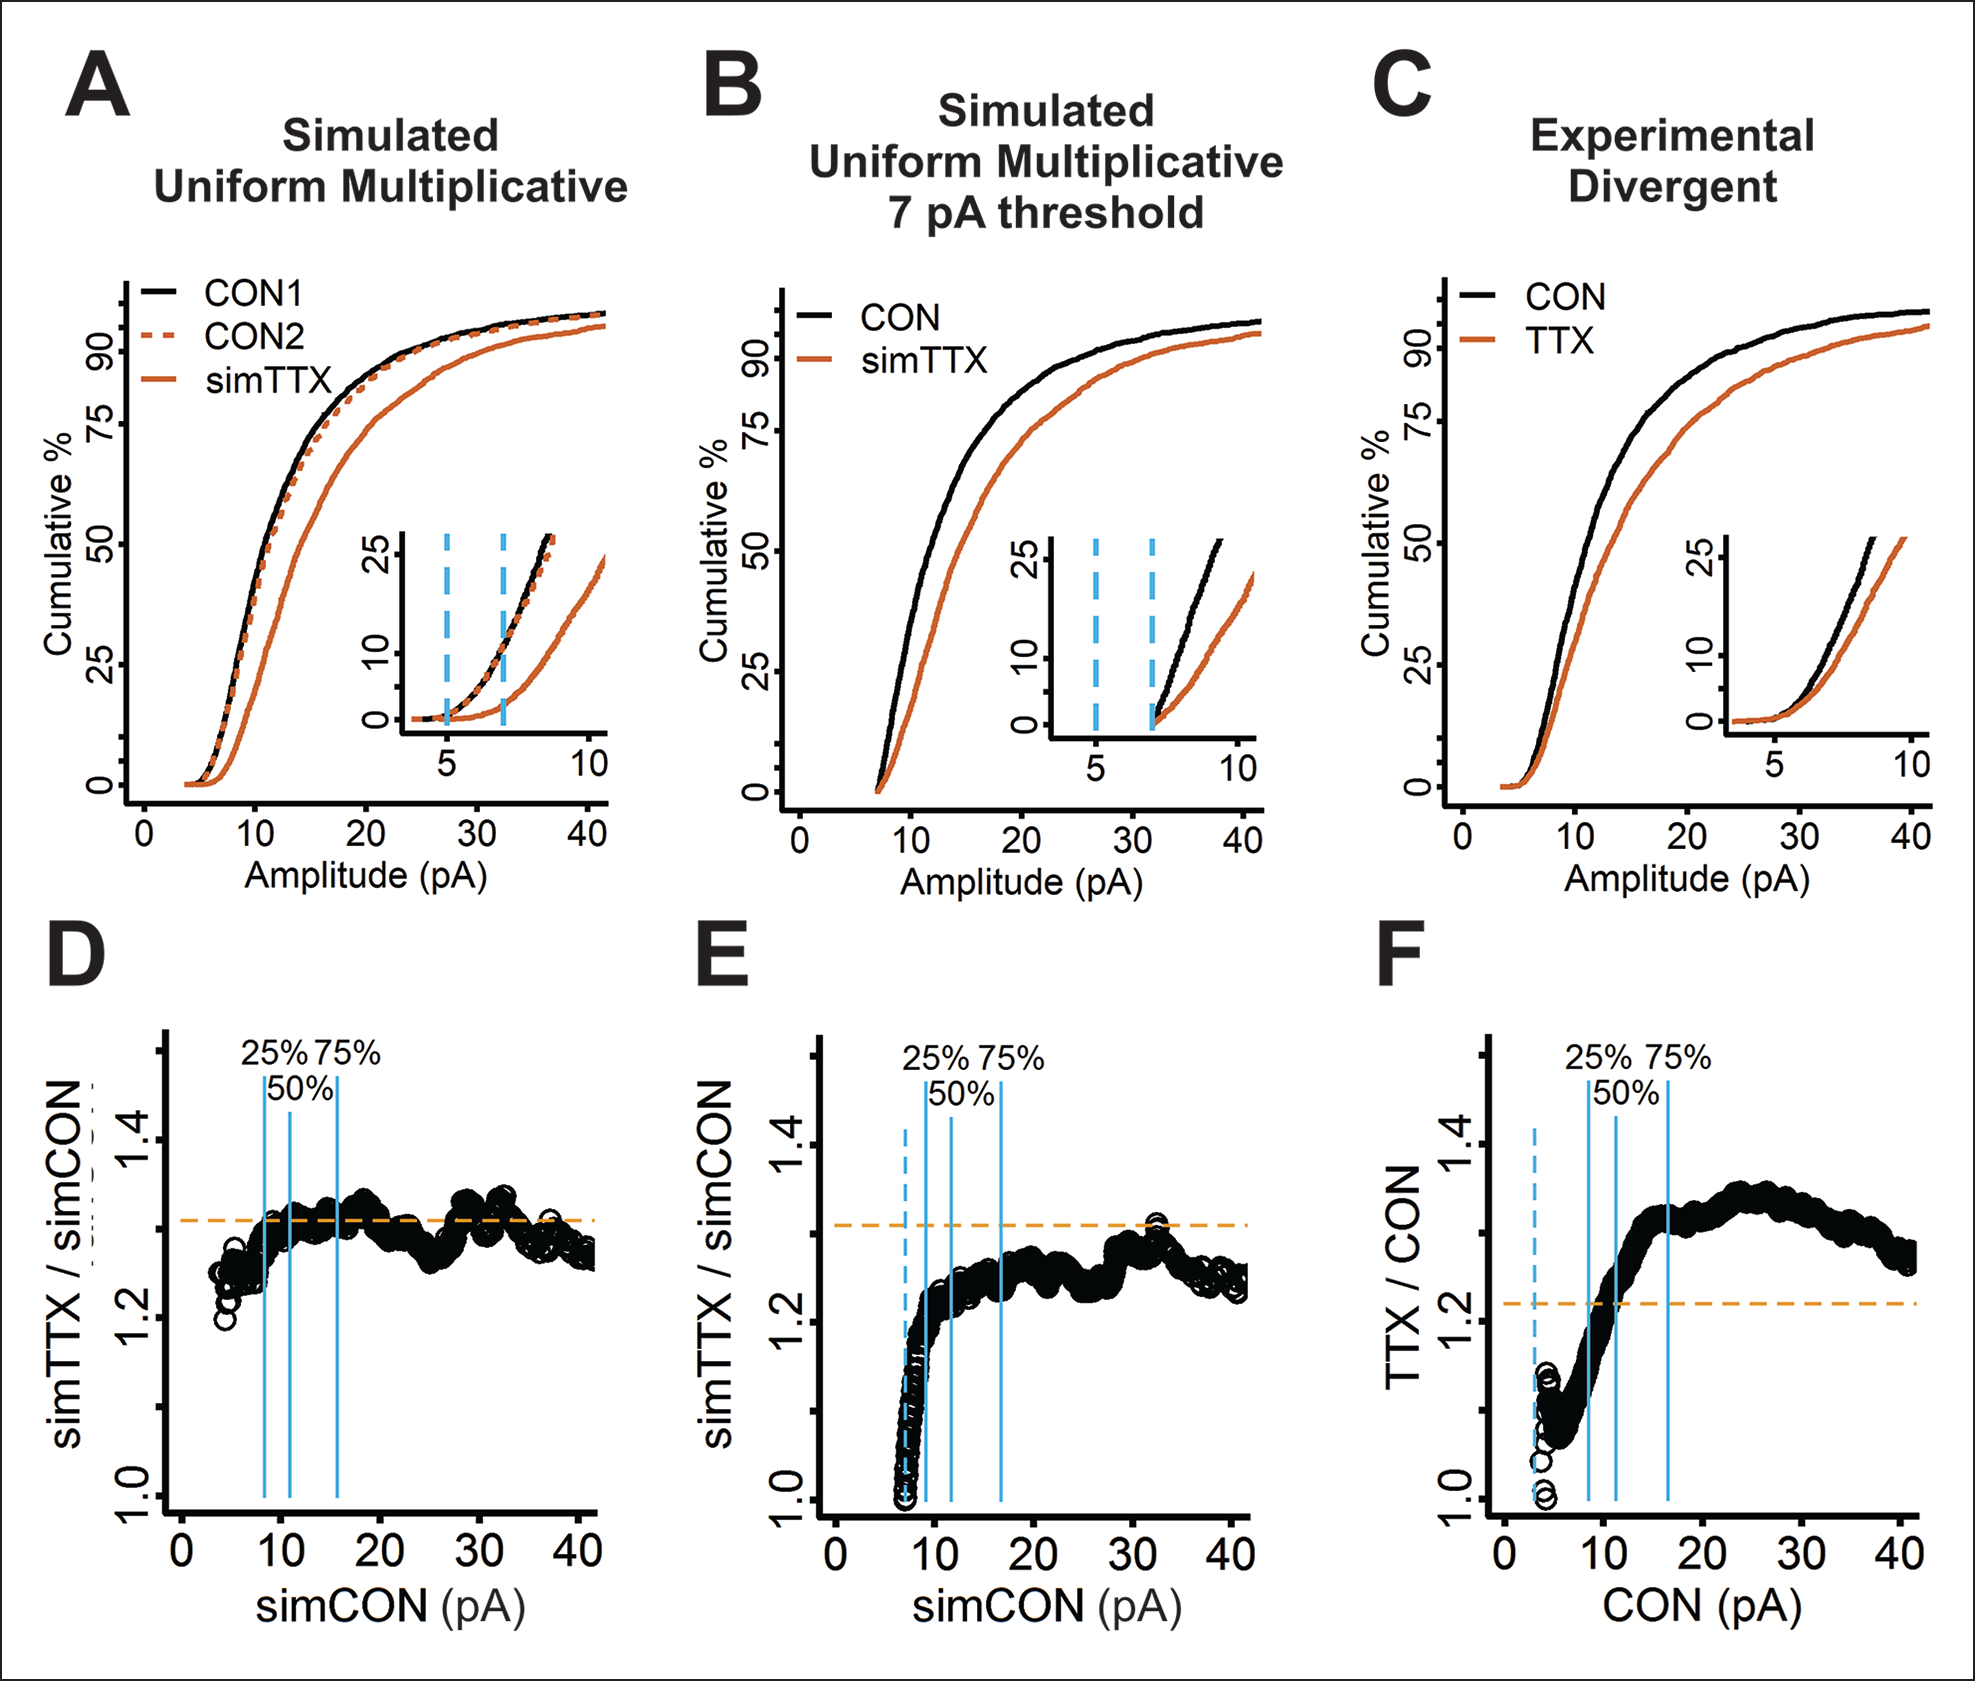
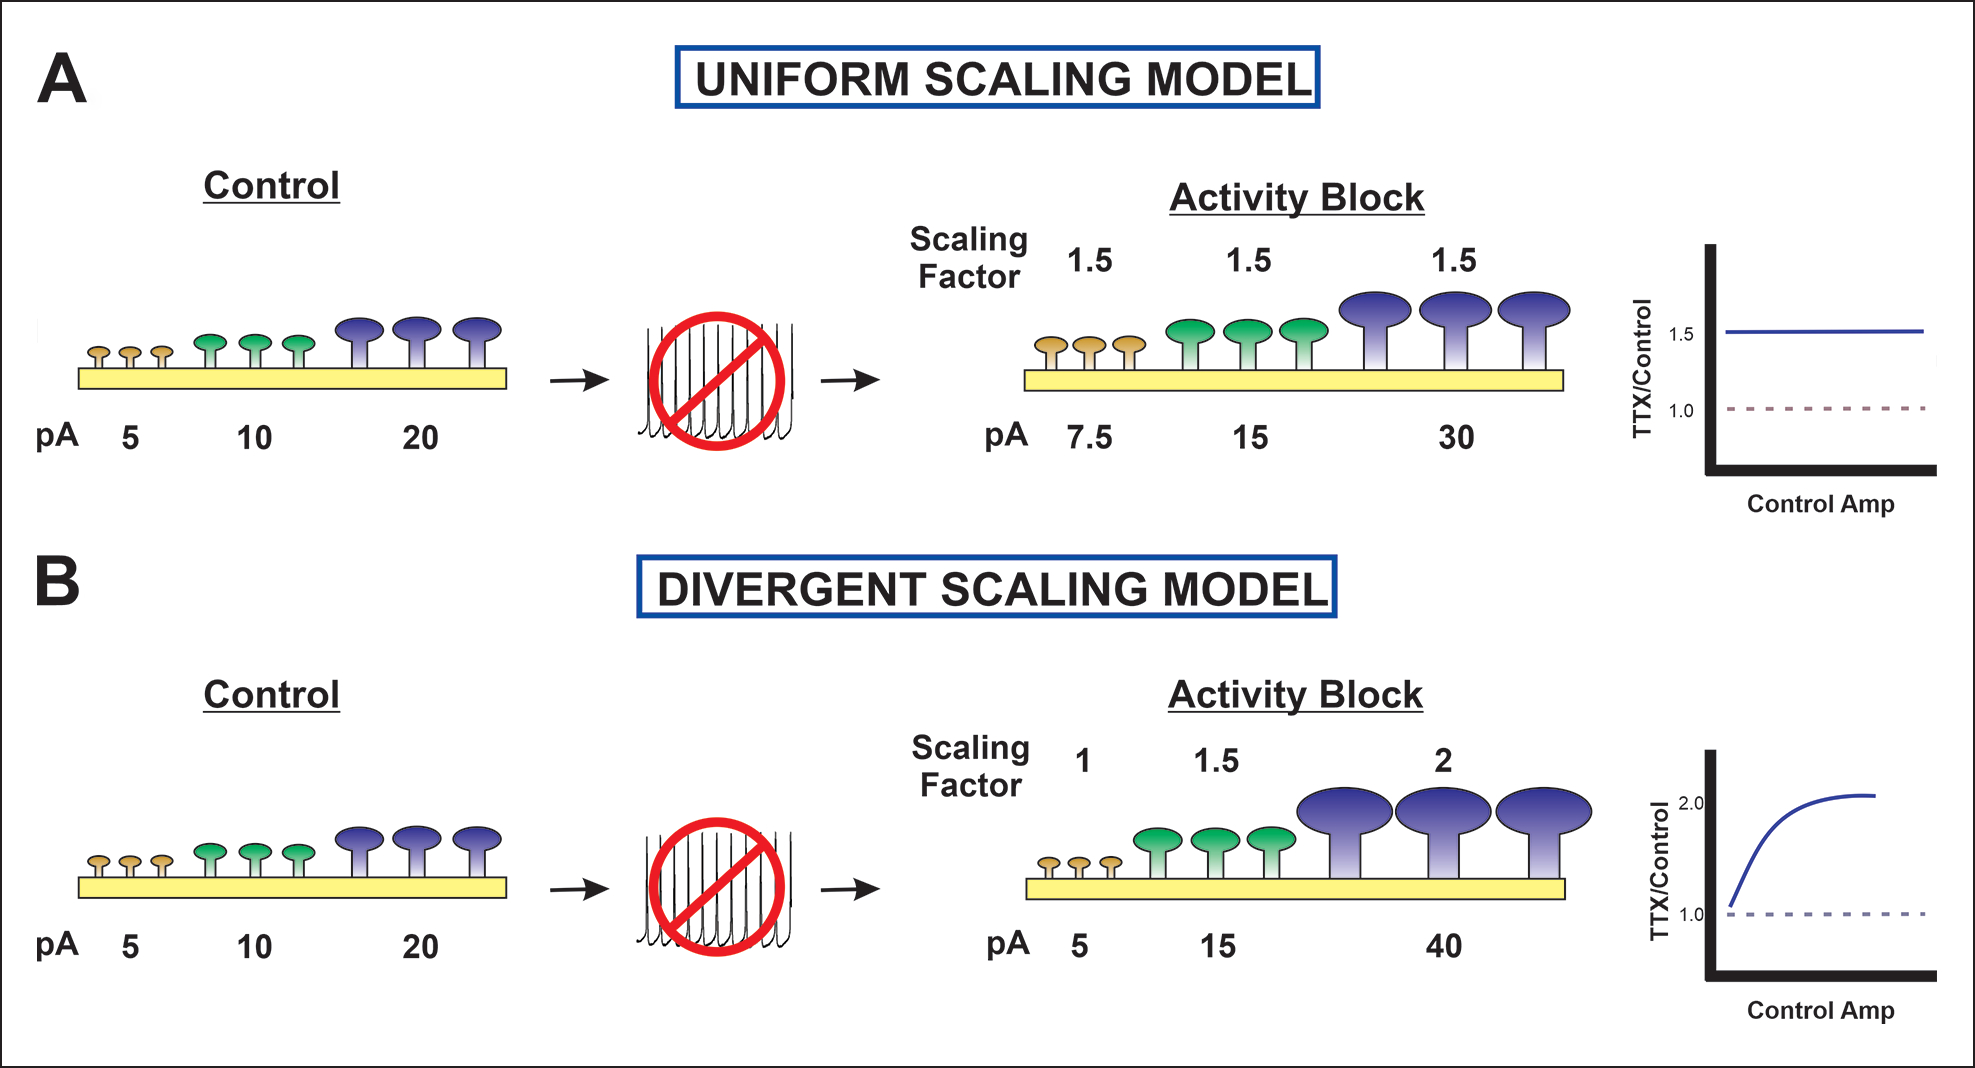
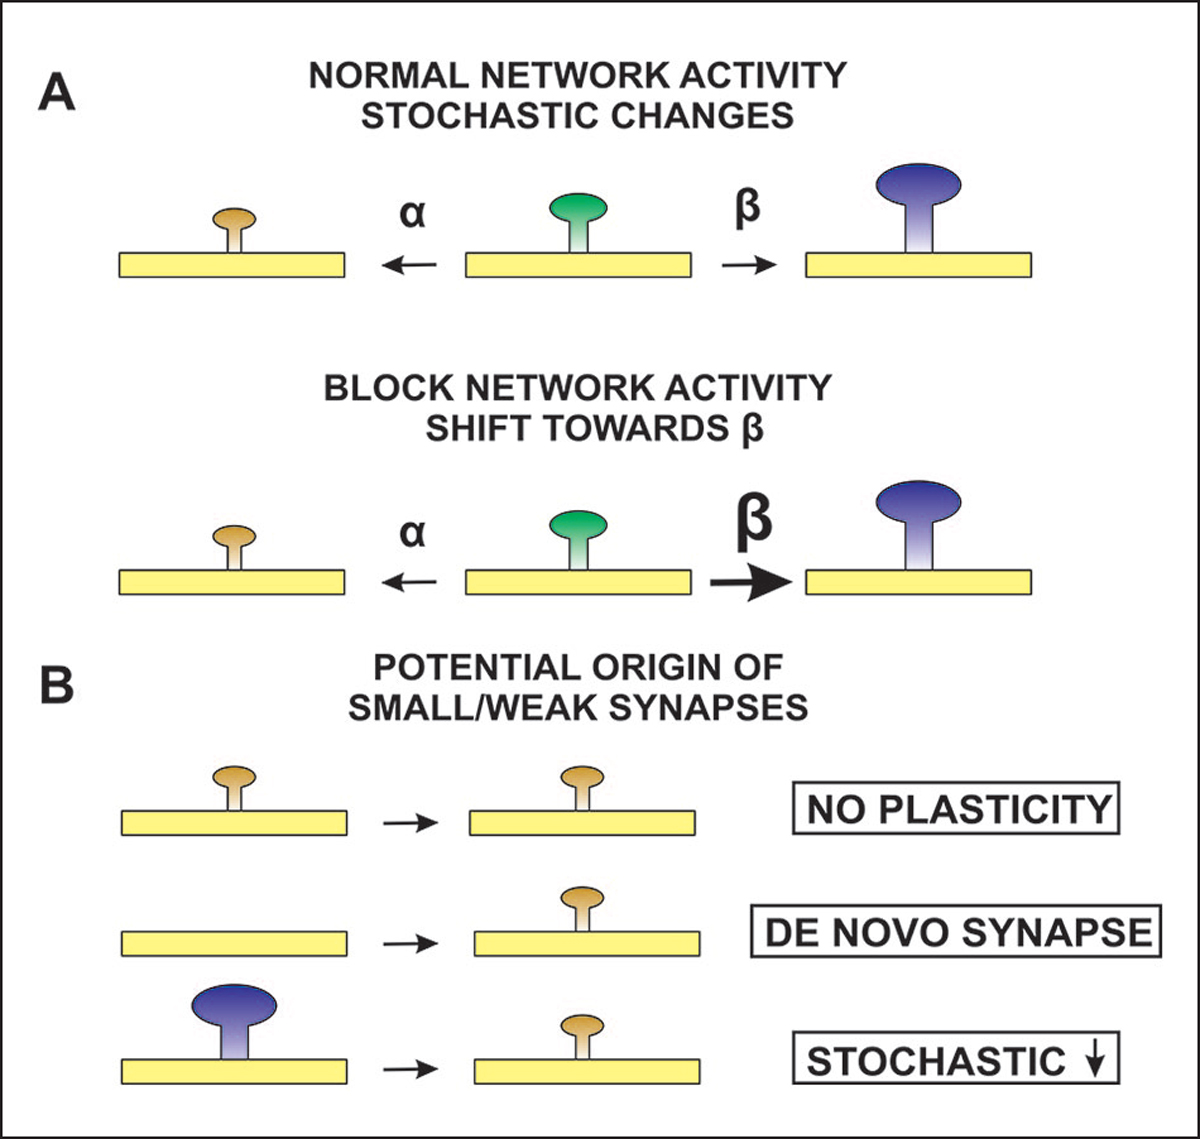
The idea that the nervous system maintains a set point of network activity and homeostatically returns to that set point in the face of dramatic disruption-during development, after injury, in pathologic states, and during sleep/wake cycles-is rapidly becoming accepted as a key plasticity behavior, placing it alongside long-term potentiation and depression. The dramatic growth in studies of homeostatic synaptic plasticity of miniature excitatory synaptic currents (mEPSCs) is attributable, in part, to the simple yet elegant mechanism of uniform multiplicative scaling proposed by Turrigiano and colleagues: that neurons sense their own activity and globally multiply the strength of every synapse by a single factor to return activity to the set point without altering established differences in synaptic weights. We have recently shown that for mEPSCs recorded from control and activity-blocked cultures of mouse cortical neurons, the synaptic scaling factor is not uniform but is close to 1 for the smallest mEPSC amplitudes and progressively increases as mEPSC amplitudes increase, which we term divergent scaling. Using insights gained from simulating uniform multiplicative scaling, we review evidence from published studies and conclude that divergent synaptic scaling is the norm rather than the exception. This conclusion has implications for hypotheses about the molecular mechanisms underlying synaptic scaling.

Keywords: activity dependent; divergent scaling; homeostatic; homeostatic plasticity; homeostatic synaptic plasticity; mEPSCs; mEPSPs; synaptic; synaptic homeostasis; synaptic scaling.


Conflict of interest statement

Declaration of Conflicting InterestsThe authors declared no potential conflicts of interest with respect to the research, authorship, and/or publication of this article.

Figures

Figure 1.
Figure 1.
What is a miniature excitatory postsynaptic current (mEPSC)? The mEPSC is the response of one neuron to a single vesicle’s worth of neurotransmitter released by another neuron. The amplitude of the mEPSC is a measure of the synaptic strength of the synapse where the vesicle release event occurs. Synaptic vesicles are constantly being released at a low rate and can be detected via electrophysiologic approaches to record the current activated by binding of the neurotransmitter to postsynaptic receptors. To isolate the spontaneously occurring mEPSCs, glass coverslips containing cultured neurons are placed into a recording chamber on the stage of a microscope and continuously perfused with an extracellular solution containing tetrodotoxin (to block action potentials) and picrotoxin (to block GABA-mediated currents) to isolate glutamatergic mEPSCs. A glass pipette is filled with a solution mimicking the neuron’s internal ionic environment, connected to a patch clamp voltage clamp amplifier via a silver wire, and manipulated to the cell body of the neuron, with suction applied to form a seal of high resistance (i.e., gigaohm seal). The pipette potential is then set to the cell membrane voltage (−60 mV), and additional suction is applied to rupture the cell membrane, allowing electrical access to the interior of the cell. mEPSCs are recorded via an amplifier as an analog signal (current), digitized, and collected with P-Clamp software. In the computer panel, the top trace is a current recording of several seconds, showing the spontaneous rate of vesicle fusion and neurotransmitter activation of receptors; the frequency of mEPSCs can be monitored to assess presynaptic functions such as probability of release. The bottom trace is an expanded region of the recording and shows a single mEPSC; the characteristics of the mEPSC that can be analyzed through software detection programs such as MiniAnalysis include amplitude, rise time, and decay time. Created with BioRender.com (2022).
Figure 2.
Figure 2.
Potential mechanisms regulating miniature excitatory synaptic current (mEPSC) amplitude. Shifts in mEPSC amplitude could be due to 1) the insertion of postsynaptic receptors (red trace) or removal of receptors (blue trace) as compared with the control state (black trace); 2) a shift in receptor type from one (black receptor, black trace) to another (red receptor) that has larger single-channel conductance or longer open time (red trace) or, conversely, a shift to a receptor type (blue receptor) that has a smaller single-channel conductance or shorter open time (blue trace); 3) the location of a synapse more distal to the cell body (blue trace) as compared with that at an intermediate (black trace) or more proximal (red trace) location; or 4) presynaptic modulation of synaptic vesicle neurotransmitter released during vesicle fusion, by altering either vesicle size (not shown) or neurotransmitter content within a vesicle—high transmitter content (black circle, red trace), medium (gray circle, black trace), and low (light gray circle, blue trace). Adapted from “Synaptic Cleft (Horizontal),” by BioRender.com (2022).
Figure 3.
Figure 3.
Cumulative distribution functions of miniature excitatory synaptic current (mEPSC) amplitudes shift in the opposite direction of the perturbation of network activity in dissociated neuronal cultures. Shifts in cumulative distribution functions are observed following prolonged exposure of cultured neurons to pharmacologic agents that cause activity deprivation (solid red line; red mEPSC trace) or excess activity (solid blue line; blue mEPSC trace). Solid black line and black mEPSC trace represent control values. Cumulative distribution functions are obtained by plotting the mEPSC amplitudes pooled across neuronal recordings and sorted from smallest to largest amplitude (x-axis) versus a cumulative sum of the frequency bins (y-axis).
Figure 4.
Figure 4.
Comparison of divergent versus uniform multiplicative scaling per the rank order process (Turrigiano and others 1998). Block of action potentials with tetrodotoxin (TTX) for 48 h leads to a shift in the distribution of miniature excitatory synaptic current (mEPSC) amplitudes to larger values. (A) The cumulative distribution function (CDF) of amplitudes for mEPSCs recorded from an untreated cortical neuron (control CDF, solid black curve) and a cortical neuron treated with TTX for 48 h (TTX CDF, solid red curve). (B) The rank order process is used to determine the transformation caused by activity blockade. Sixteen quantiles evenly spaced across the distribution are shown. mEPSC amplitude quantiles were sorted from smallest to largest for the control and TTX-treated neurons, with the smallest quantile pair indicated as 1,1; the next smallest as 2,2; the 10th as 10,10; and the 16th as 16,16. The gray line is the line of identity. The rank-ordered data were fit with linear regression, allowing the intercept term to vary; the equation for the best fit is Y = 1.87X – 5.52 (dashed red line; R2 = 0.996). This equation was then used to scale the TTX CDF of mEPSC amplitudes to the control CDF of mEPSC amplitudes: (TTX CDF – b)/m (panel A, dashed red curve; Kolmogorov-Smirnov test, D = 0.067, P > 0.99). The importance of the intercept term b is demonstrated by the poor fit of the TTX CDF to the control CDF by using only the multiplicative term: TTX CDF/m (panel A, dashed blue curve; Kolmogorov-Smirnov test, D = 0.467, P = 0.0025). (C) The ratio of TTX to control mEPSC amplitude (TTX/CON) for each pair is close to 1.0 for the smallest amplitudes and continues to increase to a plateau value around 1.5. This divergent behavior is a mathematical result caused by the outsized effect of the intercept term on small mEPSC amplitudes. (D–F) How the CDFs, rank order plot, and ratio plot respectively appear for simulated uniform multiplicative scaling. (D) The simulated multiplicative scaling CDF (solid red curve) is shifted parallel to the right of the control CDF. In contrast, when the data are transformed with an equation containing an intercept term, the CDFs run together for approximately 18% of the cumulative fraction (panel A, black drop lines). As expected, the rank order plot shows that when the simulated uniform multiplicative scaling data are created by using a multiplicative term and no intercept (panel E), the data points do not run together and are always above the line of identity. Otherwise, the rank order data do not appear dramatically different for uniform scaling (multiplicative factor and no intercept term) versus divergent scaling (multiplicative factor and an intercept term). (F) Finally, the ratio is the same value across all control amplitudes for uniform multiplicative scaling.
Figure 5.
Figure 5.
Finding the best multiplicative scaling factor via the iterative process (Kim and others 2012). In the iterative process, multiple scaling factors are tested in succession, stepping through the range from a small factor to a large factor. For each factor, the tetrodotoxin (TTX) cumulative distribution function (CDF) is divided by the factor; then, miniature excitatory synaptic current (mEPSC) amplitudes that fall below the smallest control mEPSC amplitude (method used here) or a threshold set by the noise (3 × root mean square noise) are discarded before comparing the two CDFs with a Kolmogorov-Smirnov (K-S) test. (A–C) The control (CON; black solid line) and TTX (red solid line) CDFs from Figure 4. (A) The factor 1.2 is applied, and the resulting scaled CDF (blue dashed line) is compared with the CON CDF per the K-S test (D = 0.164, P = 0.744). (B, C) The results for scaling factors 1.445 and 1.6, respectively. The best scaling factor, defined by the one producing the largest P value when comparing the scaled TTX CDF with the control CDF, was 1.445 (panel E, red; D = 0.100, P = 0.997). (D) The smallest 10 mEPSC quantiles for the CON, TTX, and scaled TTX CDFs (TTX/scaling factor), with shading to highlight the mEPSC quantiles that were discarded after scaling; the shading colors in panel D correspond to the indicated scaling factors (1.2, blue; 1.445, red; 1.6, gray) in panel E. (E) The P values as a function of scaling factor for a subset of factors that were applied to the TTX CDF to scale it to the CON CDF. Comparison of the tables shows that the larger the scaling factor, the greater the number of mEPSC quantiles discarded. Note that the K-S test analyzes the largest vertical distance between the CDFs being compared.
Figure 6.
Figure 6.
Cumulative distribution functions of miniature excitatory synaptic current (mEPSC) amplitudes following activity blockade with tetrodotoxin (TTX) in cortical cultures cannot be scaled with the rank order or iterative method. (A) Scaling the TTX (solid red line) to the control (CON; solid black line) CDFs with the parameters from a linear regression fit of rank-ordered data (Kolmogorov-Smirnov [K-S] test, D = 0.070, P = 1.3 × 10⁻⁵). (B) mEPSC amplitude quantiles from TTX-treated neurons were sorted from smallest to largest and plotted versus the sorted mEPSC amplitude quantiles from untreated control neurons. The resulting relationship was fit with linear regression allowing the intercept term to vary (Y = 1.28X – 0.28; red dashed line, R2 = 0.989). Gray line, line of identity. (C) Scaling the TTX (solid red line) to the CON (solid black line) CDFs with the best multiplicative factor determined per the iterative process. mEPSC quantiles in the scaled data set that fell below the smallest quantile in the control data set were discarded prior to comparing the distributions with a K-S test. (D) Plot of P values as a function of the multiplicative scaling factor used to scale the TTX to the CON CDFs. Maximum P value = 0.002, D = 0.053, multiplicative factor = 1.205. Figure modified from Figure 3 in Hanes and others (2020). Note that here sample sizes for the K-S tests are matched for the two methods (30 quantiles for 86 CON and 77 TTX-treated cells), whereas they were not in the original publication.
Figure 7.
Figure 7.
Behavior of miniature excitatory synaptic current (mEPSC) amplitudes following activity blockade in cortical cultures cannot be simulated by using uniform multiplicative scaling or that with a 7-pA threshold cutoff. (A) To simulate uniform multiplicative synaptic scaling, two slightly different control samples were generated by twice randomly sampling 30 mEPSCs from each of 86 control mouse cortical neurons (2580 samples; solid black curve, CON1; dashed red curve, CON2). To simulate the multiplicative effect of TTX, the second control cumulative distribution function (CDF) was multiplied by 1.25 (solid red curve; simTTX). (B) The effect of recording noise on the ability to detect the smallest mEPSC amplitudes was simulated by discarding all mEPSC amplitudes <7 pA in the control (solid black curve) and simulated TTX (solid red curve) samples. (C) CDFs produced by sampling 30 quantiles from each of 86 control (CON; solid black curve) and 77 TTX-treated (solid red curve) mouse cortical neurons ran close together for >15% of the data, indicating the experimental data displayed divergent scaling. (D) A ratio plot is produced by sorting mEPSC amplitudes from the CON1 and simTTX pooled samples in panel A from smallest to largest, calculating the ratio of simTTX mEPSC amplitude to CON1 mEPSC amplitude for each pair of amplitudes, and plotting the ratios versus the CON1 mEPSC amplitudes (circles). The plot shows a uniform multiplicative factor with variation from the random sampling process. (E) A ratio plot produced from the 7-pA truncated samples in panel B shows an abrupt increase in ratio over <5% of the data before reaching a uniform value. The dashed blue line indicates the 7-pA threshold cutoff, which overlaps with the region of changing ratio. (F) A ratio plot for the experimental data is produced by pooling 77 mEPSC amplitude quantiles from each of 86 control mouse cortical neurons and 86 mEPSC amplitude quantiles from each of 77 TTX-treated mouse cortical neurons to create two data sets matched for number of samples. The plot shows an increasing ratio over almost 75% of the data, demonstrating divergent scaling. Dashed blue line indicates 3 pA: the threshold cutoff used when detecting mEPSCs in MiniAnalysis. Insets for panels A, B, and C: first 25th quantile of data; light blue dashed lines indicate 5- and 7-pA threshold cutoffs. Solid blue lines in panels D, E, and F indicate 25th, 50th, and 75th quantiles. Figure modified from Figures 3 and 7 in Hanes and others (2020).
Figure 8.
Figure 8.
Comparison of uniform multiplicative and divergent scaling models. (A) In the uniform multiplicative scaling model, the size/strength of each synapse is modified by the same multiplicative factor as shown in the ratio plot on the right. For example, control synapses of 5 pA (weak/small, yellow), 10 pA (medium, green), and 20 pA (large/strong, purple) become 7.5, 15, and 30 pA after a uniform multiplication of 1.5. The colors are maintained to follow the fate of each synapse, but after activity block there are no small/weak synapses. (B) In the divergent scaling model, small/weak synapses show little change; the multiplicative scaling factor increases with initial strength/size (see ratio plot on the right); and the sample synapses become 5, 15, and 40 pA due to multiplicative factors of 1, 1.5, and 2, respectively.
Figure 9.
Figure 9.
How a population of small/weak synapses could exist following activity blockade. (A, top) In the presence of normal network activity, synapse size/strength varies stochastically, with synapses increasing in size/strength with a rate constant β and decreasing with a rate constant α. Rate constants α and β are balanced, and the distribution of synaptic weights is stable. (A, bottom) When network activity is blocked, rate constant β increases or rate constant α decreases, and the distribution of synaptic weights shifts to higher values. (B) At least three mechanisms could produce a population of small/weak synapses after activity blockade: no plasticity, small/weak synapses lack a homeostatic plasticity mechanism; de novo synapse, small/weak synapses arise de novo during the activity blockade period; stochastic decrease, small/weak synapses could come from stochastic decreases experienced by larger/stronger synapses.

Similar articles

Cited by

References

    1. Altimimi HF, Stellwagen D. 2013. Persistent synaptic scaling independent of AMPA receptor subunit composition. J Neurosci 33(29):11763–7. - PMC - PubMed
    1. Ancona Esselmann SG, Diaz-Alonso J, Levy JM, Bemben MA, Nicoll RA. 2017. Synaptic homeostasis requires the membrane-proximal carboxy tail of GluA2. Proc Natl Acad Sci U S A 114(50):13266–71. - PMC - PubMed
    1. Anggono V, Clem RL, Huganir RL. 2011. PICK1 loss of function occludes homeostatic synaptic scaling. J Neurosci 31(6):2188–96. - PMC - PubMed
    1. Auger C, Marty A. 2000. Quantal currents at single-site central synapses. J Physiol 526 Pt 1:3–11. - PMC - PubMed
    1. Axelsson J, Thesleff S. 1959. A study of supersensitivity in denervated mammalian skeletal muscle. J Physiol 147(1):178–93. - PMC - PubMed

LinkOut - more resources