. 2023 Jan 1;32(1):15-29.
doi: 10.1093/hmg/ddac176.

Opposing effects of genetic variation in MTCH2 for obesity versus heart failure

Affiliations

Opposing effects of genetic variation in MTCH2 for obesity versus heart failure

Julie A Fischer et al. Hum Mol Genet. .

Abstract

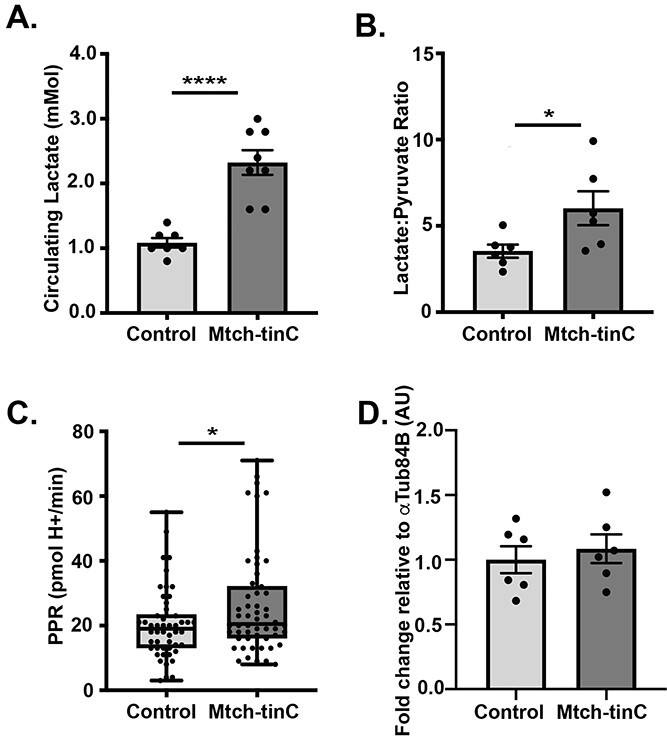
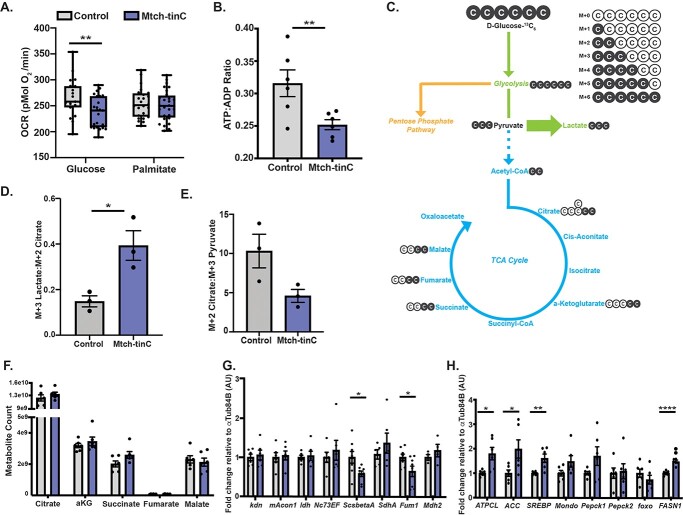
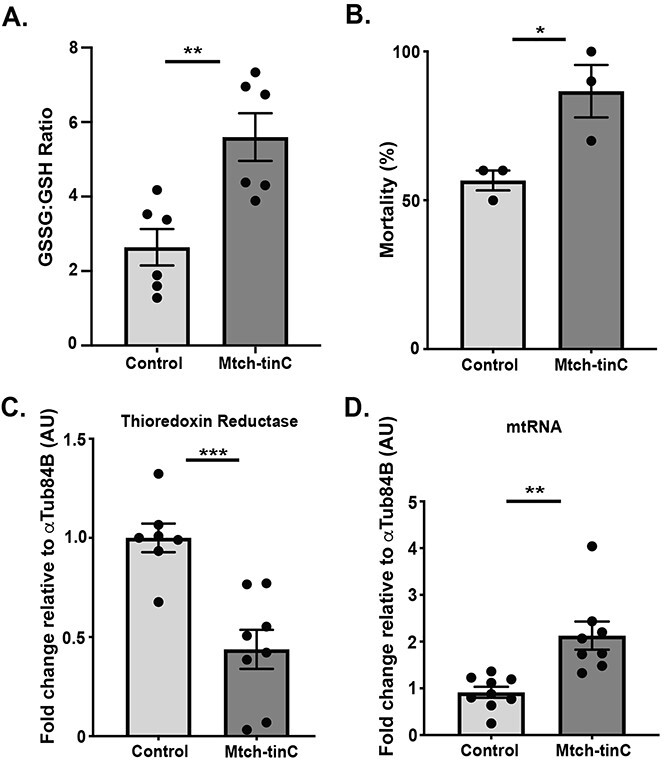
Genetic variation in genes regulating metabolism may be advantageous in some settings but not others. The non-failing adult heart relies heavily on fatty acids as a fuel substrate and source of ATP. In contrast, the failing heart favors glucose as a fuel source. A bootstrap analysis for genes with deviant allele frequencies in cardiomyopathy cases versus controls identified the MTCH2 gene as having unusual variation. MTCH2 encodes an outer mitochondrial membrane protein, and prior genome-wide studies associated MTCH2 variants with body mass index, consistent with its role in metabolism. We identified the referent allele of rs1064608 (p.Pro290) as being overrepresented in cardiomyopathy cases compared to controls, and linkage disequilibrium analysis associated this variant with the MTCH2 cis eQTL rs10838738 and lower MTCH2 expression. To evaluate MTCH2, we knocked down Mtch in Drosophila heart tubes which produced a dilated and poorly functioning heart tube, reduced adiposity and shortened life span. Cardiac Mtch mutants generated more lactate at baseline, and they displayed impaired oxygen consumption in the presence of glucose but not palmitate. Treatment of cardiac Mtch mutants with dichloroacetate, a pyruvate dehydrogenase kinase inhibitor, reduced lactate and rescued lifespan. Deletion of MTCH2 in human cells similarly impaired oxygen consumption in the presence of glucose but not fatty acids. These data support a model in which MTCH2 reduction may be favorable when fatty acids are the major fuel source, favoring lean body mass. However, in settings like heart failure, where the heart shifts toward using more glucose, reduction of MTCH2 is maladaptive.


Figures

Graphical Abstract
Graphical Abstract
Figure 1
Figure 1
MTCH2 variation in a human cardiomyopathy cohort. (A). Shown is common nsSNV variant burden in MTCH2 in DCM or HCM cases compared with expected gnomAD frequencies estimated using bootstrap-based approach. The 99.95% confidence intervals are shown for MTCH2 (DCM: −0.3155 to −0.0779; HCM: −0.3707 to −0.1098). (B) MTCH2 has less variation in cardiomyopathy compared to the gnomAD. The purple bar represents the normalized referent allele count of MTCH2 p.Pro290Ala variant in the cardiomyopathy cohort (N = 172), the black line represents number of variants expected at each frequency based on gnomAD genome-wide frequency predictions. (C) The top pins (blue) show the position of MTCH2 variants from a cardiomyopathy cohort, and the bottom pins (yellow) depict MTCH2 variants identified in GWAS for cardiac and metabolic phenotypes. The blue and yellow striped pin represents rs1064608 (MTCH2 p.Pro290Ala) identified in a GWAS for BMI. (D) LD plot of the 5 GWAS SNPs from (C) reveals strong LD between rs1064608 and the two SNPs previously associated with BMI (rs10838738 and rs3817334). (E) GTEx shows two MTCH2 SNPS that are eQTLs in skeletal muscle and have genome-wide significant association with BMI (underlined in C). (F) In a control cohort derived from the Northwestern NUgene Medical Biobank, the referent allele, MTCH2 Pro290, has an overall allele frequency of 0.714 in biobank participants without heart failure (dark blue, left) compared to 0.776 in a cardiomyopathy cohort (dark blue, right). Control N = 772, cardiomyopathy cohort N = 172, *P < 0.024, Chi Square Test.
Figure 2
Figure 2
Reduced lifespan and impaired heart function in Drosophila with cardiac Mtch knockdown. (A-C) In Mtch-tinC flies, Mtch expression was reduced in heart tubes (N = 7, ****P < 0.0001), but Mtch expression was unchanged in abdominal tissue after heart tube removal (N = 6, P > 0.05) and unchanged in whole heads of Mtch-tinC flies (N = 8, P > 0.05). Average ± SEM, black dots represent group of 20 flies. Gene expression values were normalized to αTub84B. (D-E) FS was reduced in the heart tube of Mtch-tinC flies assessed by optical coherency tomography (****P < 0.0001, black dots represent each individual fly, N = 29). The right panel shows end-diastolic diameter and end-systolic diameter of heart tubes EDD (****P < 0.0001), ESD (****P < 0.0001, N = 29, black dots represent each individual fly). (F) Cardiac imaging of 3-week-old flies for a 3 s duration using optical coherence tomography. Panels reveal degree of contraction of the heart tube. Top panel is imaging from control fly, bottom panel shows a Mtch-tinC fly with reduced function as evidenced by the lack of contraction. (G) Kaplan–Meier curve showing Mtch-tinC flies had reduced longevity (N = 120, ****P < 0.0001, Kaplan–Meir estimate). Unless stated otherwise, all comparisons were made using a two-tailed student’s t-test. All experiments used equal numbers of 3-week-old males and females. Dark gray = Mtch-tinC; light gray = control.
Figure 3
Figure 3
Cardiac Mtch Drosophila mutants had reduced adiposity and increased glycogen content. (A) Mtch-tinC larvae had reduced adiposity based on buoyancy of third instar larvae (average ± SEM, N = 6, each black dot represents 10 flies, ****P < 0.0001). (B) Food consumption over a 24 h period was unchanged in 3-week-old Mtch-tinC flies (N = 8, each black dot represents 20 flies, P > 0.05). (C) Glycogen content was greater in the heart-containing abdomen of Mtch-tinC flies (N = 120, *P = 0.0491). (D) Circulating glucose levels were unchanged in the hemolymph of Mtch-tinC flies (N = 8, each black dot is 60 flies, P > 0.05). All comparisons were made using a two-tailed Student’s t-test. Unless stated otherwise, all experiments used equal numbers of 3-week-old males and females. Dark gray = Mtch-tinC; light gray = control.
Figure 4
Figure 4
Increased lactate in cardiac Mtch knockdown Drosophila. (A) Circulating lactate was increased in the hemolymph of Mtch-tinC flies (average ± SEM, N = 8 groups, each dot is 60 flies, ****P < 0.0001). (B) Ratio of normalized lactate:pyruvate metabolite counts in the heart-containing abdomen was elevated in Mtch-tinC flies, measured by LCMS-based targeted metabolite profiling (N = 6, each black dot is 30 flies, ****P < 0.0001). (C) Whole-body PPR was increased in Mtch-tinC flies (N = 51, each black dot is 20 flies, *P = 0.0249). (D) Ldh expression was unchanged in heart-containing abdomen in Mtch-tinC flies (N = 6, each black dot is 20 flies, P > 0.05). The increase of lactate to pyruvate and PPR suggest increased glycolysis. Gene expression values are normalized to αTub84B. All comparisons were made using a two-tailed Student’s t-test. Unless stated otherwise, all experiments used equal numbers of 3-week-old males and females. Dark gray = Mtch-tinC; light gray = control.
Figure 5
Figure 5
Cardiac Mtch knockdown in Drosophila obstructed glucose oxidation and energy production. (A) Whole-body basal OCR was reduced in cardiac Mtch-knockdowns given glucose but not palmitate (average ± SEM, N = 20, each black dot represents 20 flies, **P = 0.0060). (B) Mtch-tinC flies had reduced energy generation, measured by the ratio of normalized ATP:ADP metabolite counts (N = 6 groups, each black dot is 30 flies, *P = 0.0158). (C) Metabolite flux profiling traced the fate of consumed 13C M + 6 labeled glucose. (D) Glucose had a greater fate to lactate production in Mtch-tinC flies, assessed from ratio of normalized labeled lactate:pyruvate metabolite counts (average ± SEM, N = 6, each black dot represents 30 flies, *P = 0.0242) (green arrow in C). (E) Amount of pyruvate shuttled to the citric acid cycle was lower in Mtch-tinC flies (N = 3, each black dot represents 30 flies, P = 0.0671) (blue dashed arrow in C). (F) Measurement of total normalized citric acid cycle metabolites was unchanged in Mtch-tinC flies (N = 6, each black dot represents 30 flies, citrate (P = 0.3382), αKG (P = 0.4033), succinate (P = 0.0747), fumarate (P = 0.6119), malate (P = 0.6292) (G) Expression of genes encoding the citric acid cycle enzymes showed selective reduction of ScsbetaA (*P = 0.0229) and Fum1 (*P = 0.0368) (N = 6, each black dot represents 20 flies). (H) Expression of genes implicated in fatty acid metabolism showed selective reduction of ATPCL (*P = 0.0115), ACC (*P = 0.0320), SREBP (**P = 0.0060) and FASN1 (****P < 0.0001) (N = 6, each group represents 20 flies). Gene expression values are normalized to αTub84B. All comparisons were made using a two-tailed student’s t-test. Unless stated otherwise, all experiments used equal numbers of 3-week-old males and females. Purple = Mtch-tinC; gray = control.
Figure 6
Figure 6
Chemical inhibition of PDK in Drosophila  Mtch knockdowns improved lifespan and elevated lactate levels. (A) Longevity analysis of flies given PDK inhibitor (DCA) post-eclosion. PDK inhibition improved lifespan in Mtch-tinC flies (average ± SEM, N = 120, Mtch-tinC minus DCA vs Mtch-tinC given DCA, *P < 0.0001, Kaplan–Meier estimate). (B) Circulating lactate measured in flies given either glucose diet or glucose diet supplemented with PDK inhibitor (DCA, clear column). PDK inhibition lowered lactate levels in Mtch-tinC flies (N = 8, each black dot represents 60 flies, Control minus DCA vs Mtch-tinC minus DCA, ****P < 0.0001, Mtch-tinC minus DCA vs Control given DCA, **P = 0.0015, Control given DCA vs Mtch-tinC given DCA, ***P = 0.0002). (C) Measurement of whole-body basal OCR under glucose conditions given either glucose without PDK inhibitor or glucose supplemented with PDK inhibitor (DCA). PDK inhibition improved Mtch-tinC OCR (N = 20 wells of 20 flies, control DCA vs Mtch-tinC minus DCA, **P = 0.0060, Mtch-tinC minus DCA vs Mtch-tinC given DCA, *P = 0.0159. (D) Circulating lactate measured from hemolymph of flies given either glucose diet or glucose diet supplemented with PDH inhibitor (BOA) (N = 8 groups of 60 flies). PDH inhibition does not affect Mtch-tinC lactate levels. Control minus inhibitor vs Mtch-tinC minus inhibitor, ****P < 0.0001, Control minus BOA vs Control given BOA, *P = 0.0104, Mtch-tinC minus BOA vs Mtch-tinC given BOA, ***P = 0.0003 two-tailed Student’s t-test P value. Unless stated otherwise, all comparisons were made using a two-tailed Student’s t-test. All experiments used 3-week-old equal numbers of males and females. Purple = Mtch-tinC; gray = control.
Figure 7
Figure 7
Mitochondrial dysfunction in cardiac Mtch knockdown Drosophila. (A) Ratio of oxidized glutathione: reduced glutathione was elevated in the heart-containing abdomen of Mtch-tinC flies measured by LCMS-based targeted metabolite profiling (average ± SEM, N = 6, each black dot represents 30 flies, **P = 0.0043). (B) Mtch-tinC flies were more susceptible to death after 24 h exposure to paraquat, a ROS-inducing toxin (N = 6, each black dot represents 30 flies, *P = 0.0335). (C) Gene expression of mitochondrial thioredoxin reductase (Trxr-2) was lower in Mtch-tinC flies (N = 6, each black dot represents 20 flies, ***P = 0.0006). Gene expression values are normalized to αTub84B. (D) Mtch-tinC flies had greater expression of mitochondrial-specific mRNA relative to nuclear-specific mRNA in the presence of glucose (N = 8, each black dot represents 20 flies, **P = 0.0014). Unless stated otherwise, all comparisons were made using a two-tailed Student’s t-test. All experiments used equal numbers of 3-week-old males and females. Dark gray = Mtch-tinC; light gray = control.
Figure 8
Figure 8
Deletion of MTCH2 in HEK293 cells reduced OCR and pyruvate dehydrogenase activity. (A) Immunoblot of MTCH2 protein in control (unedited) and MTCH2−/− cells (MTCH2 KO), relative to mitochondrial cytochrome C. (B) Quantification of immunoblot band density relative to mitochondrial cytochrome C protein (average ± SEM, N = 6 wells of cultured cells, ****P < 0.0001). (C) MTCH2 mRNA was reduced in MTCH2−/− cells compared to control (N = 4, ****P < 0.0001). (D) Basal PPR of cells supplemented with 50 mm glucose (N = 23 wells, **P = 0.0018). (E) Basal OCR of control and MTCH2−/− cells supplemented with 50 mm glucose or 1 mm palmitate, normalized to cell count (N = 18 wells, ****P < 0.0001). (F) Basal OCR in the presence of 50 mm glucose media supplemented with 100 μm DCA PDK inhibitor, normalized to cell count (N = 18 wells Control minus DCA vs MTCH2 KO minus DCA, ****P < 0.0001; Control minus DCA vs Control plus DCA, ****P < 0.0001; Control minus DCA vs MTCH2 KO plus DCA, ****P < 0.0001; MTCH2 KO minus DCA vs MTCH2 KO plus DCA, ****P < 0.0001). (G) mtDNA in control vs MTCH2−/− cells (N = 6 wells, **P = 0.0097). (H) Pyruvate dehydrogenase activity in mitochondria isolated from control and MTCH2−/− cells, normalized to mitochondrial count (N = 14 wells, ****P < 0.0001).

References

    1. Ruprecht, J.J. and Kunji, E.R.S. (2020) The SLC25 mitochondrial carrier family: structure and mechanism. Trends Biochem. Sci., 45, 244–258. - PMC - PubMed
    1. Willer, C.J., Speliotes, E.K., Loos, R.J., Li, S., Lindgren, C.M., Heid, I.M., Berndt, S.I., Elliott, A.L., Jackson, A.U., Lamina, C. et al. (2009) Six new loci associated with body mass index highlight a neuronal influence on body weight regulation. Nat. Genet., 41, 25–34. - PMC - PubMed
    1. Renström, F., Payne, F., Nordström, A., Brito, E.C., Rolandsson, O., Hallmans, G., Barroso, I., Nordström, P. and Franks, P.W. (2009) Replication and extension of genome-wide association study results for obesity in 4923 adults from northern Sweden. Hum. Mol. Genet., 18, 1489–1496. - PMC - PubMed
    1. Bauer, F., Elbers, C.C., Adan, R.A., Loos, R.J., Onland-Moret, N.C., Grobbee, D.E., van Vliet-Ostaptchouk, J.V., Wijmenga, C. and van der Schouw, Y.T. (2009) Obesity genes identified in genome-wide association studies are associated with adiposity measures and potentially with nutrient-specific food preference. Am. J. Clin. Nutr., 90, 951–959. - PubMed
    1. Mei, H., Chen, W., Jiang, F., He, J., Srinivasan, S., Smith, E.N., Schork, N., Murray, S. and Berenson, G.S. (2012) Longitudinal replication studies of GWAS risk SNPs influencing body mass index over the course of childhood and adulthood. PLoS One, 7, 2–3. - PMC - PubMed

Publication types