. 2022 Oct 5;12(10):2434-2453.
doi: 10.1158/2159-8290.CD-21-1631.

Impaired Proteolysis of Noncanonical RAS Proteins Drives Clonal Hematopoietic Transformation

Affiliations

Impaired Proteolysis of Noncanonical RAS Proteins Drives Clonal Hematopoietic Transformation

Sisi Chen et al. Cancer Discov. .

Abstract

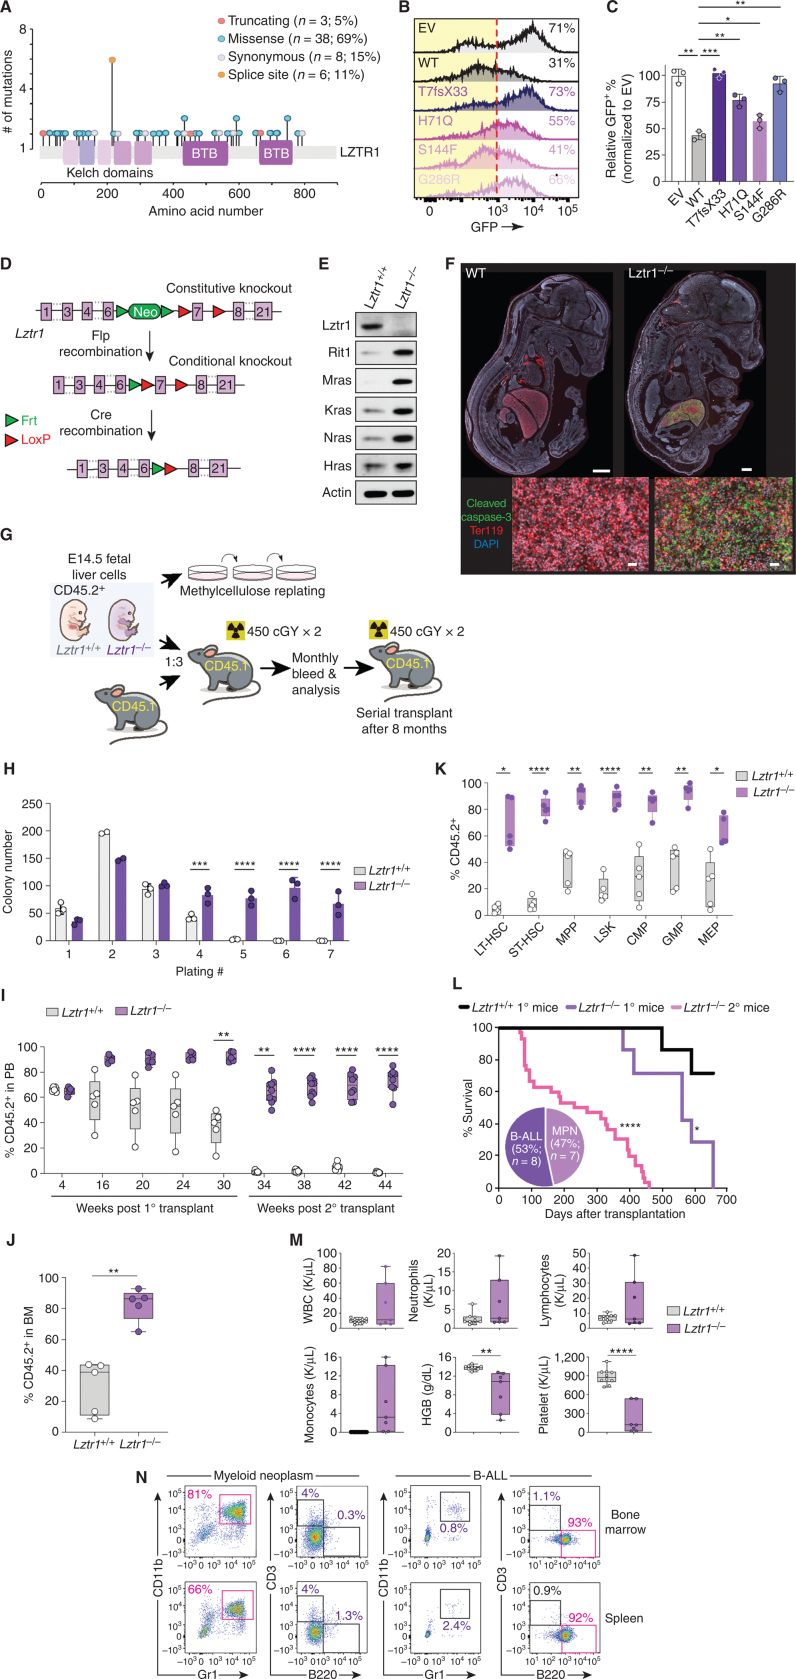
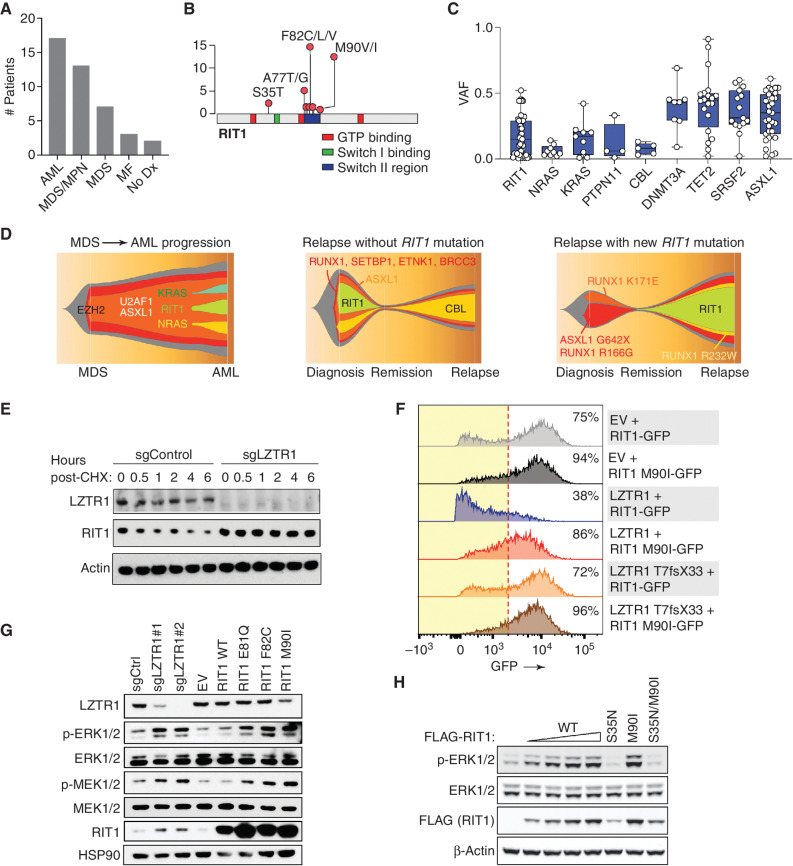
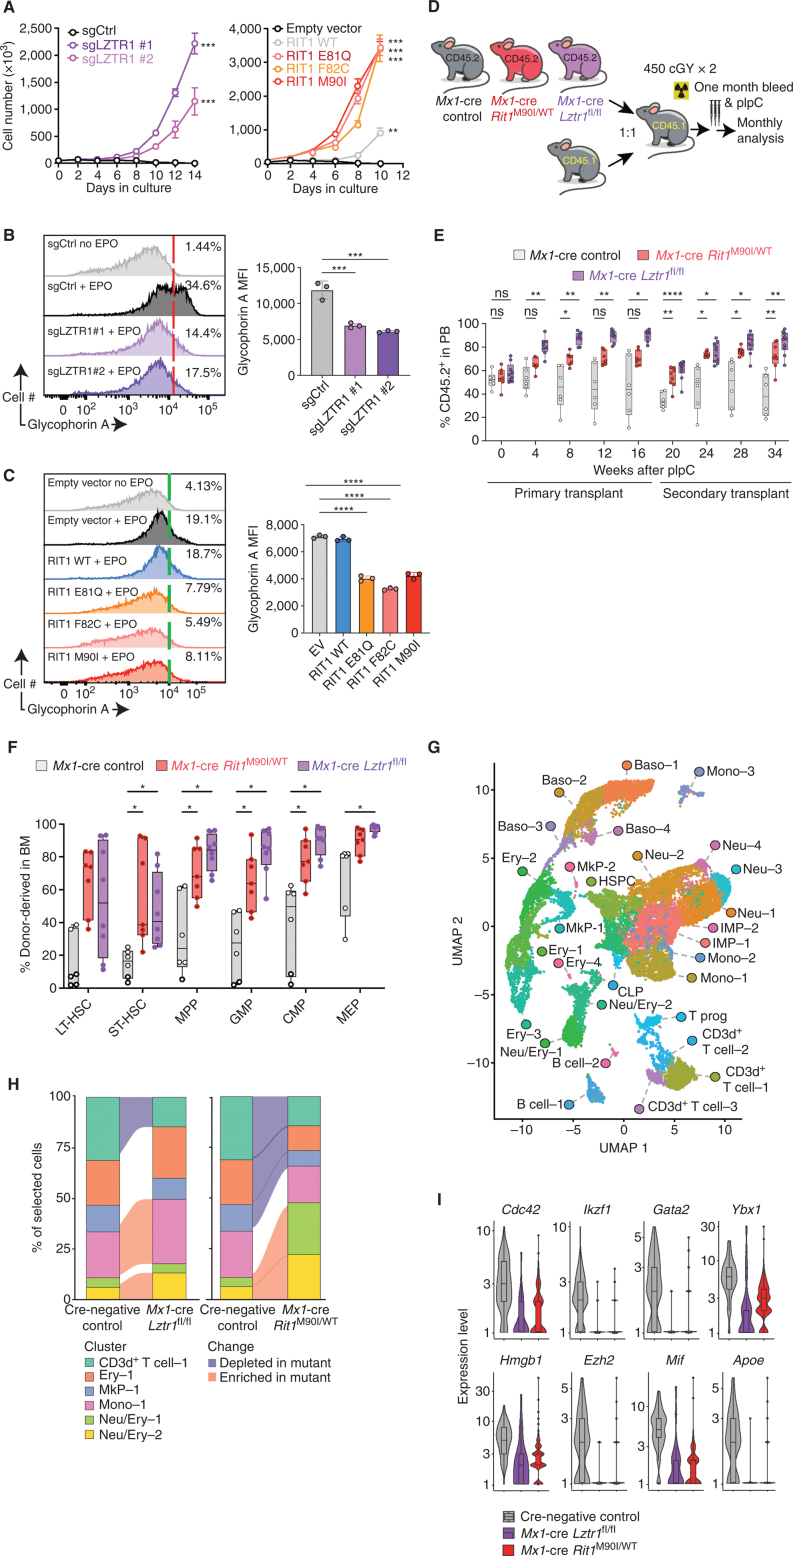
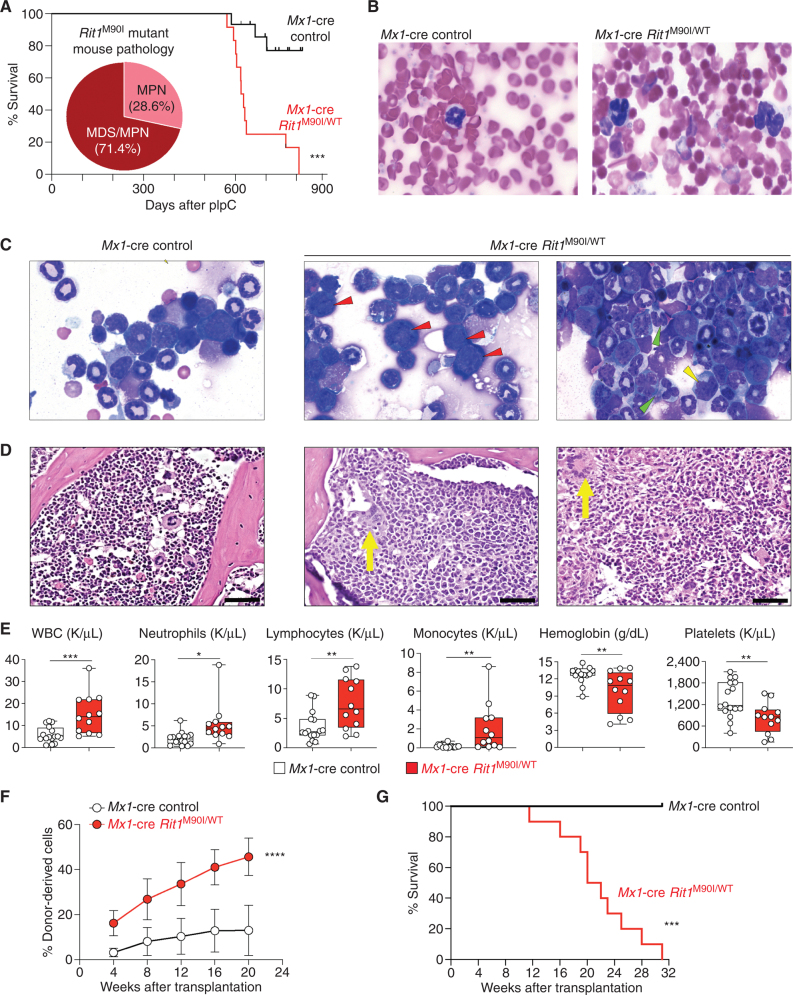
Recently, screens for mediators of resistance to FLT3 and ABL kinase inhibitors in leukemia resulted in the discovery of LZTR1 as an adapter of a Cullin-3 RING E3 ubiquitin ligase complex responsible for the degradation of RAS GTPases. In parallel, dysregulated LZTR1 expression via aberrant splicing and mutations was identified in clonal hematopoietic conditions. Here we identify that loss of LZTR1, or leukemia-associated mutants in the LZTR1 substrate and RAS GTPase RIT1 that escape degradation, drives hematopoietic stem cell (HSC) expansion and leukemia in vivo. Although RIT1 stabilization was sufficient to drive hematopoietic transformation, transformation mediated by LZTR1 loss required MRAS. Proteolysis targeting chimeras (PROTAC) against RAS or reduction of GTP-loaded RAS overcomes LZTR1 loss-mediated resistance to FLT3 inhibitors. These data reveal proteolysis of noncanonical RAS proteins as novel regulators of HSC self-renewal, define the function of RIT1 and LZTR1 mutations in leukemia, and identify means to overcome drug resistance due to LZTR1 downregulation.

Significance: Here we identify that impairing proteolysis of the noncanonical RAS GTPases RIT1 and MRAS via LZTR1 downregulation or leukemia-associated mutations stabilizing RIT1 enhances MAP kinase activation and drives leukemogenesis. Reducing the abundance of GTP-bound KRAS and NRAS overcomes the resistance to FLT3 kinase inhibitors associated with LZTR1 downregulation in leukemia. This article is highlighted in the In This Issue feature, p. 2221.


Figures

Figure 1. Loss of Lztr1 enhances HSC self-renewal and drives leukemia development. A, Lollipop plot of LZTR1 mutations identified in the blood of subjects with clonal hematopoiesis (7). B, Representative histograms of GFP in 293T cells encoding RIT1 fused to eGFP and empty vector (EV), WT LZTR1, or any of four CH-associated LZTR1 mutations. The percentage of eGFP+ cells is indicated. Red dotted line indicates the cutoff for GFP+. C, Quantification of data from B. Mean ± SD. *, P < 0.05; **, P < 0.01; ***, P < 0.001. D, Schema of the allele for Lztr1 constitutive or conditional gene disruption. E, Western blots of Lztr1 and RAS GTPases in E14.5 fetal liver cells from Lztr1 WT or knockout embryos. F, Immunofluorescence images of Lztr1 WT or null embryos for cleaved caspase-3 (green), Ter119 (red), and DAPI (blue) in whole mount (top; WT bar: 100 μm; KO bar: 50 μm) or focused on fetal livers (bottom; bar, 20 μm). G, Schema of experiments evaluating the effects of Lztr1 deletion on fetal hematopoietic cells in vitro and in vivo. H, Colony number in methylcellulose replating assays using 20 × 103 fetal liver hematopoietic cells from Lztr1+/+, Lztr1+/−, and Lztr1−/− fetus. Mean ± SD. n = 3. ***, P < 0.001; ****, P < 0.0001. I, The percentage of CD45.2+ cells in the peripheral blood (PB) of CD45.1+ recipient mice following primary (1°) and secondary (2°) competitive transplantation. n = 5–10. **, P < 0.01; ****, P < 0.0001. J, Box-and-whisker plots of the percentage of total CD45.2+ cells in the bone marrow (BM). n = 5. **, P < 0.01. K, The percentage of CD45.2+ hematopoietic stem and progenitors following 16 weeks of competitive transplantation (as shown in the schema in Fig. 1G). n = 5. *, P < 0.05; **, P < 0.01; ****, P < 0.0001. CMP, common myeloid progenitor; GMP, granulocyte–macrophage progenitor; LT-HSC, long-term HSC; LSK, lineage-negative Sca-1+ c-Kit+; MEP, megakaryocyte–erythroid progenitor; MPP, multipotent progenitor; ST, short-term HSC. L, Kaplan–Meier curve of primary and secondary transplant recipient mice. Pie chart indicates the number and proportion of analyzed mice developing lethal hematopoietic malignancies across both primary and secondary transplantation. Lztr1+/+ primary (1o) recipient mice n = 7, Lztr1−/− primary (1o) recipient mice n = 7, Lztr1−/− secondary (2o) recipient mice n = 30. *, P < 0.05; ****, P < 0.0001. M, Peripheral blood counts of CD45.1+ recipient mice transplanted with CD45.2+ Lztr1+/+ or Lztr1−/− fetal liver cells. n = 6–10. **, P < 0.01; ****, P < 0.0001. HGB, hemoglobin; WBC, white blood cell. N, Flow-cytometric analysis of live CD45.2+ Lztr1−/− cells from secondary transplant recipient mice developing myeloid neoplasms or B-ALL.
Figure 1.
Loss of Lztr1 enhances HSC self-renewal and drives leukemia development. A, Lollipop plot of LZTR1 mutations identified in the blood of subjects with clonal hematopoiesis (7). B, Representative histograms of GFP in 293T cells encoding RIT1 fused to eGFP and empty vector (EV), WT LZTR1, or any of four CH-associated LZTR1 mutations. The percentage of eGFP+ cells is indicated. Red dotted line indicates the cutoff for GFP+. C, Quantification of data from B. Mean ± SD. *, P < 0.05; **, P < 0.01; ***, P < 0.001. D, Schema of the allele for Lztr1 constitutive or conditional gene disruption. E, Western blots of Lztr1 and RAS GTPases in E14.5 fetal liver cells from Lztr1 WT or knockout embryos. F, Immunofluorescence images of Lztr1 WT or null embryos for cleaved caspase-3 (green), Ter119 (red), and DAPI (blue) in whole mount (top; WT bar: 100 μm; KO bar: 50 μm) or focused on fetal livers (bottom; bar, 20 μm). G, Schema of experiments evaluating the effects of Lztr1 deletion on fetal hematopoietic cells in vitro and in vivo. H, Colony number in methylcellulose replating assays using 20 × 103 fetal liver hematopoietic cells from Lztr1+/+, Lztr1+/−, and Lztr1−/− fetus. Mean ± SD. n = 3. ***, P < 0.001; ****, P < 0.0001. I, The percentage of CD45.2+ cells in the peripheral blood (PB) of CD45.1+ recipient mice following primary (1°) and secondary (2°) competitive transplantation. n = 5–10. **, P < 0.01; ****, P < 0.0001. J, Box-and-whisker plots of the percentage of total CD45.2+ cells in the bone marrow (BM). n = 5. **, P < 0.01. K, The percentage of CD45.2+ hematopoietic stem and progenitors following 16 weeks of competitive transplantation (as shown in the schema in Fig. 1G). n = 5. *, P < 0.05; **, P < 0.01; ****, P < 0.0001. CMP, common myeloid progenitor; GMP, granulocyte–macrophage progenitor; LT-HSC, long-term HSC; LSK, lineage-negative Sca-1+ c-Kit+; MEP, megakaryocyte–erythroid progenitor; MPP, multipotent progenitor; ST, short-term HSC. L, Kaplan–Meier curve of primary and secondary transplant recipient mice. Pie chart indicates the number and proportion of analyzed mice developing lethal hematopoietic malignancies across both primary and secondary transplantation. Lztr1+/+ primary (1o) recipient mice n = 7, Lztr1−/− primary (1o) recipient mice n = 7, Lztr1−/− secondary (2o) recipient mice n = 30. *, P < 0.05; ****, P < 0.0001. M, Peripheral blood counts of CD45.1+ recipient mice transplanted with CD45.2+Lztr1+/+ or Lztr1−/− fetal liver cells. n = 6–10. **, P < 0.01; ****, P < 0.0001. HGB, hemoglobin; WBC, white blood cell. N, Flow-cytometric analysis of live CD45.2+Lztr1−/− cells from secondary transplant recipient mice developing myeloid neoplasms or B-ALL.
Figure 2. Characterization of RIT1 mutations in patients with hematologic malignancies. A, Histogram of the number of patients with RIT1 mutations based on myeloid malignancy diagnosis. MF, myelofibrosis; No Dx, no diagnosis. B, Diagram of the location of RIT1 mutations identified. C, Variant allele frequency (VAF) of mutations in RAS GTPases or regulators of RAS-GTP abundance relative to mutations in transcriptional modifiers in patients with myeloid leukemia. D, Fishtail representation plots of VAFs of mutations across a serial genomic analysis of three patients with RIT1 mutations. E, Western blot of LZTR1 and RIT1 following cycloheximide (CHX) treatment of TF-1 cells with or without LZTR1 deletion. sg, single guide. F, Representative histograms of GFP in cells encoding WT or mutant RIT1 fused to eGFP along with empty vector (EV), WT LZTR1, or mutant LZTR1. The percentage of eGFP+ cells is indicated. The red dotted line indicates the cutoff for GFP+. G, Levels of phosphorylated and total MEK1/2 and ERK1/2 as well as RIT1 in TF-1 cells with LZTR1 deletion or expression of EV RIT1 WT or mutant cDNAs. H, Western blot of p-ERK and total ERK levels in 293T cells transfected with increasing amounts of FLAG-RIT1 WT and mutant cDNAs.
Figure 2.
Characterization of RIT1 mutations in patients with hematologic malignancies. A, Histogram of the number of patients with RIT1 mutations based on myeloid malignancy diagnosis. MF, myelofibrosis; No Dx, no diagnosis. B, Diagram of the location of RIT1 mutations identified. C, Variant allele frequency (VAF) of mutations in RAS GTPases or regulators of RAS-GTP abundance relative to mutations in transcriptional modifiers in patients with myeloid leukemia. D, Fishtail representation plots of VAFs of mutations across a serial genomic analysis of three patients with RIT1 mutations. E, Western blot of LZTR1 and RIT1 following cycloheximide (CHX) treatment of TF-1 cells with or without LZTR1 deletion. sg, single guide. F, Representative histograms of GFP in cells encoding WT or mutant RIT1 fused to eGFP along with empty vector (EV), WT LZTR1, or mutant LZTR1. The percentage of eGFP+ cells is indicated. The red dotted line indicates the cutoff for GFP+. G, Levels of phosphorylated and total MEK1/2 and ERK1/2 as well as RIT1 in TF-1 cells with LZTR1 deletion or expression of EV RIT1 WT or mutant cDNAs. H, Western blot of p-ERK and total ERK levels in 293T cells transfected with increasing amounts of FLAG-RIT1 WT and mutant cDNAs.
Figure 3. Convergent effects of Lztr1 deletion and leukemia-associated mutations in the Lztr1 substrate Rit1 in normal hematopoiesis. A, Growth of cells from G following cytokine depletion. Mean ± SD. n = 3. **, P < 0.01; ***, P < 0.001. sg, single guide. B, Left, representative FACS histograms of glycophorin A levels in TF-1 cells ± LZTR1 deletion in the absence or presence of erythropoietin (EPO; 2 IU/mL × 4 days). Right, enumeration of the median fluorescence intensity (MFI) of glycophorin A. n = 3. ***, P < 0.001. C, As in B but in TF-1 cells with RIT1 mutants. n = 3. ****, P < 0.0001. D, Schema for competitive transplantation of hematopoietic cells with postnatal deletion of Lztr1 or expression of Rit1M90I/WT. pIpC, polyinosinic:polycytidylic acid. E, Peripheral blood (PB) chimerism of CD45.1 recipient mice from D. n = 6–9. ns, not significant; *, P < 0.05; **, P < 0.01; ****, P < 0.0001. F, percentage of CD45.2+ hematopoietic stem and progenitor cells in the bone marrow (BM) of CD45.1 recipient mice from D at 16 weeks after transplantation. n = 6–9. *, P < 0.05. For box-and-whisker plots, bar indicates median; box edges, first and third quartile values; and whisker edges, minimum and maximum values. CMP, common myeloid progenitor; GMP, granulocyte–macrophage progenitor; LT-HSC, long-term HSC; LSK, lineage-negative Sca-1+ c-Kit+; MEP, megakaryocyte–erythroid progenitor; MPP, multipotent progenitor; ST, short-term HSC. G, Uniform manifold approximation and projection (UMAP) dimensionality reduction of 20,536 bone marrow lineage-negative cells from Cre-negative control mice, Mx1-cre Lztr1fl/fl mice, and Mx1-cre Rit1M90I/WT mice. Baso, basophil progenitor; B cell, B-cell progenitor; CD3d+ T cell, CD3d+ T-cell progenitor; CLP, common lymphoid progenitor; Ery, erythroid progenitor; HSPC, hematopoietic stem/progenitor cell; IMP, immature myeloid progenitor; MkP, megakaryocyte progenitor; Mono, monocyte progenitor; Neu, neutrophil/granulocyte progenitor; Neu/Ery, neutrophil/erythroid progenitor; T prog, T-cell progenitor. H, Alluvial plots of key clusters from A, including all differentially expanded or reduced populations in mutant mice compared with controls. Shaded sections represent populations differentially represented in mutant animals compared with WT. I, Violin plots of log-transformed normalized gene expression for genes differentially expressed in the Neu/Ery–1 cluster in mutant animals compared with controls. Superimposed box-and-whisker plots represent median values within the interquartile range (IQR; boxes) and 1.5 × IQR (whiskers).
Figure 3.
Convergent effects of Lztr1 deletion and leukemia-associated mutations in the Lztr1 substrate Rit1 in normal hematopoiesis. A, Growth of cells from G following cytokine depletion. Mean ± SD. n = 3. **, P < 0.01; ***, P < 0.001. sg, single guide. B, Left, representative FACS histograms of glycophorin A levels in TF-1 cells ± LZTR1 deletion in the absence or presence of erythropoietin (EPO; 2 IU/mL × 4 days). Right, enumeration of the median fluorescence intensity (MFI) of glycophorin A. n = 3. ***, P < 0.001. C, As in B but in TF-1 cells with RIT1 mutants. n = 3. ****, P < 0.0001. D, Schema for competitive transplantation of hematopoietic cells with postnatal deletion of Lztr1 or expression of Rit1M90I/WT. pIpC, polyinosinic:polycytidylic acid. E, Peripheral blood (PB) chimerism of CD45.1 recipient mice from D. n = 6–9. ns, not significant; *, P < 0.05; **, P < 0.01; ****, P < 0.0001. F, percentage of CD45.2+ hematopoietic stem and progenitor cells in the bone marrow (BM) of CD45.1 recipient mice from D at 16 weeks after transplantation. n = 6–9. *, P < 0.05. For box-and-whisker plots, bar indicates median; box edges, first and third quartile values; and whisker edges, minimum and maximum values. CMP, common myeloid progenitor; GMP, granulocyte–macrophage progenitor; LT-HSC, long-term HSC; LSK, lineage-negative Sca-1+ c-Kit+; MEP, megakaryocyte–erythroid progenitor; MPP, multipotent progenitor; ST, short-term HSC. G, Uniform manifold approximation and projection (UMAP) dimensionality reduction of 20,536 bone marrow lineage-negative cells from Cre-negative control mice, Mx1-cre Lztr1fl/fl mice, and Mx1-cre Rit1M90I/WT mice. Baso, basophil progenitor; B cell, B-cell progenitor; CD3d+ T cell, CD3d+ T-cell progenitor; CLP, common lymphoid progenitor; Ery, erythroid progenitor; HSPC, hematopoietic stem/progenitor cell; IMP, immature myeloid progenitor; MkP, megakaryocyte progenitor; Mono, monocyte progenitor; Neu, neutrophil/granulocyte progenitor; Neu/Ery, neutrophil/erythroid progenitor; T prog, T-cell progenitor. H, Alluvial plots of key clusters from A, including all differentially expanded or reduced populations in mutant mice compared with controls. Shaded sections represent populations differentially represented in mutant animals compared with WT. I, Violin plots of log-transformed normalized gene expression for genes differentially expressed in the Neu/Ery–1 cluster in mutant animals compared with controls. Superimposed box-and-whisker plots represent median values within the interquartile range (IQR; boxes) and 1.5 × IQR (whiskers).
Figure 4. Rit1M90I/WT mutation drives the development of myeloid neoplasms in vivo. A, Kaplan–Meier curve of primary Mx1-cre Rit1M90I/WT mice following polyinosinic:polycytidylic acid (pIpC) treatment. Venn diagram indicates diagnoses of Rit1M90/+ mice at the time of death and proportion developing MPN and myelodysplasia/MPN (MDS/MPN). n = 12. ***, P < 0.001. Wright–Giemsa stain of peripheral blood (B) and bone marrow (C) cytospins of Mx1-cre control and Mx1-cre Rit1M90I/WT mice at the time of disease onset of the Rit1M90I/WT mice. Red arrows indicate dysplastic erythroid precursors. Green arrows indicate dysplastic neutrophils. Yellow arrow indicates dysplastic myeloid precursors. Two representative animals are shown for the Rit1M90I/WT mice. D, Hematoxylin–eosin stain of bone marrow (yellow arrows indicate dysplastic megakaryocytes; scale bars = 100 μm). Two representative animals are shown for the Rit1M90I/WT mice. E, Box-and-whisker plots of peripheral blood counts of primary Mx1-cre Rit1M90I/WT mice and their age-matched Mx1-cre control mice from A. For box-and-whisker plots, bar indicates median; box edges, first and third quartile values; and whisker edges, minimum and maximum values. n = 12. *, P < 0.05; **, P < 0.01; ***, P < 0.001. WBC, white blood cell. F, The percentage of CD45.2+ cells in peripheral blood of sublethally irradiated CD45.1+ recipient mice following transplantation of Mx1-cre Rit1M90/WT bone marrow cells from the time of disease onset from D. n = 5–10. Mean ± SD. ****, P < 0.001. G, Kaplan–Meier curve of CD45.1 recipient mice from F. n = 5–10. ***, P < 0.001.
Figure 4.
Rit1 M90I/WT mutation drives the development of myeloid neoplasms in vivo. A, Kaplan–Meier curve of primary Mx1-cre Rit1M90I/WT mice following polyinosinic:polycytidylic acid (pIpC) treatment. Venn diagram indicates diagnoses of Rit1M90/+ mice at the time of death and proportion developing MPN and myelodysplasia/MPN (MDS/MPN). n = 12. ***, P < 0.001. Wright–Giemsa stain of peripheral blood (B) and bone marrow (C) cytospins of Mx1-cre control and Mx1-cre Rit1M90I/WT mice at the time of disease onset of the Rit1M90I/WT mice. Red arrows indicate dysplastic erythroid precursors. Green arrows indicate dysplastic neutrophils. Yellow arrow indicates dysplastic myeloid precursors. Two representative animals are shown for the Rit1M90I/WT mice. D, Hematoxylin–eosin stain of bone marrow (yellow arrows indicate dysplastic megakaryocytes; scale bars = 100 μm). Two representative animals are shown for the Rit1M90I/WT mice. E, Box-and-whisker plots of peripheral blood counts of primary Mx1-cre Rit1M90I/WT mice and their age-matched Mx1-cre control mice from A. For box-and-whisker plots, bar indicates median; box edges, first and third quartile values; and whisker edges, minimum and maximum values. n = 12. *, P < 0.05; **, P < 0.01; ***, P < 0.001. WBC, white blood cell. F, The percentage of CD45.2+ cells in peripheral blood of sublethally irradiated CD45.1+ recipient mice following transplantation of Mx1-cre Rit1M90/WT bone marrow cells from the time of disease onset from D. n = 5–10. Mean ± SD. ****, P < 0.001. G, Kaplan–Meier curve of CD45.1 recipient mice from F. n = 5–10. ***, P < 0.001.
Figure 5. Lztr1-null cells depend on multiple RAS GTPases. A, Western blot of E14.5 fetal liver cells from mice with germline deletion of Lztr1, Rit1, or both Lztr1 and Rit1. B, Schema of experiments evaluating effects of Lztr1 or Rit1 deletion, alone or together, on fetal hematopoietic cells in vivo. C, Peripheral blood chimerism of the experiment in B. n = 10/group. *, P < 0.05; **, P < 0.01; ***, P < 0.001; ****, P < 0.001. For box and whiskers plots, bar indicates median; box edges, first and third quartile values; and whisker edges, minimum and maximum values. D, Schema of positive enrichment custom CRISPR–Cas9 pooled lentiviral screen to identify genes required for cytokine-independent growth following LZTR1 deletion or expression of RIT1 mutations in TF-1 cells. E, Heat map of sgRNAs depleted in RIT1 F82C, RIT1 M90I, or LZTR1 KO TF-1 cells following cytokine depletion. Log2 fold change (FC) is shown. F, Schema of growth competition assay to evaluate effects of RIT1, MRAS, or SHOC2 suppression on LZTR1 WT or KO cells. G, Relative ratio of shRNA-expressing (dsRED+) LZTR1 KO TF-1 cells following culture in doxycycline and removal of GM-CSF. Doxycycline induces expression of dsRED simultaneously with expression of shRNAs targeting Renilla (“shRen,” a negative control), RIT1, MRAS, or SHOC2. H, Schema of the effects of LZTR1 loss on signaling in hematopoietic cells. At baseline, LZTR1 restrains the abundance of multiple RAS GTPases, including RIT1, KRAS, and MRAS (left). Upon receptor tyrosine kinase (RTK) stimulation, RIT1, KRAS, and MRAS exchange GDP for GTP and enable RAF activation of MEK and ERK (middle box). LZTR1 depletion results in the accumulation of RIT1, KRAS, and MRAS, and the resultant cytokine hypersensitivity and transformation of LZTR1-null cells requires MRAS–SHOC2–PP1 activity.
Figure 5.
Lztr1-null cells depend on multiple RAS GTPases. A, Western blot of E14.5 fetal liver cells from mice with germline deletion of Lztr1, Rit1, or both Lztr1 and Rit1. B, Schema of experiments evaluating effects of Lztr1 or Rit1 deletion, alone or together, on fetal hematopoietic cells in vivo. C, Peripheral blood chimerism of the experiment in B. n = 10/group. *, P < 0.05; **, P < 0.01; ***, P < 0.001; ****, P < 0.001. For box and whiskers plots, bar indicates median; box edges, first and third quartile values; and whisker edges, minimum and maximum values. D, Schema of positive enrichment custom CRISPR–Cas9 pooled lentiviral screen to identify genes required for cytokine-independent growth following LZTR1 deletion or expression of RIT1 mutations in TF-1 cells. E, Heat map of sgRNAs depleted in RIT1 F82C, RIT1 M90I, or LZTR1 KO TF-1 cells following cytokine depletion. Log2 fold change (FC) is shown. F, Schema of growth competition assay to evaluate effects of RIT1, MRAS, or SHOC2 suppression on LZTR1 WT or KO cells. G, Relative ratio of shRNA-expressing (dsRED+) LZTR1 KO TF-1 cells following culture in doxycycline and removal of GM-CSF. Doxycycline induces expression of dsRED simultaneously with expression of shRNAs targeting Renilla (“shRen,” a negative control), RIT1, MRAS, or SHOC2. H, Schema of the effects of LZTR1 loss on signaling in hematopoietic cells. At baseline, LZTR1 restrains the abundance of multiple RAS GTPases, including RIT1, KRAS, and MRAS (left). Upon receptor tyrosine kinase (RTK) stimulation, RIT1, KRAS, and MRAS exchange GDP for GTP and enable RAF activation of MEK and ERK (middle box). LZTR1 depletion results in the accumulation of RIT1, KRAS, and MRAS, and the resultant cytokine hypersensitivity and transformation of LZTR1-null cells requires MRAS–SHOC2–PP1 activity.
Figure 6. LZTR1-mediated drug resistance can be overcome by modulating RAS-GTP abundance. A, Scatter plots of RNA expression levels [shown as normalized reads per kilobase of transcript per million reads mapped (RPKM)] plotted against drug-sensitivity measured ex vivo as the area under the curve (AUC) from AML patient samples harboring FLT3-ITD mutation. n ≥ 111. *, P < 0.05. Pearson correlation coefficients are shown as (r) values. Statistical significance is indicated. B, Schema of the MOLM-13 cell line xenograft experiment. Luciferase-expressing MOLM-13 cells treated with anti-LZTR1 or control sgRNAs were systemically engrafted with 1 × 10⁵ cells/animal via a tail-vein injection after sublethal (225 cGy) irradiation. Seven days later, animals were treated with either vehicle or 30 mg/kg/day of gilteritinib via oral gavage. Animals underwent bioluminescence imaging weekly. C, Kaplan–Meier curve of experiment in B. n = 7–10. **, P < 0.01; ***, P < 0.001. D, Schema of protein-based degrader of RAS proteins. A chimeric protein consisting of a high-affinity target-binding domain for RAS proteins (DARPin K27) is fused to an engineered E3 ligase adapter (SPOP) to confer ubiquitin-mediated degradation of RAS proteins. E, Western blot demonstrating levels of LZTR1 as well as total and GTP-bound KRAS/NRAS/MRAS and RIT1 in MOLM-13 cells ± LZTR1 KO upon doxycycline-mediated induction of the RAS biodegrader (performed in biological triplicate). EV, empty vector. F, Seventy-two-hour cell proliferation assay on parental and LZTR1 KO MOLM-13 cells ± induction of RAS degradation. Cell viability was measured in triplicate using CellTiter-Glo. G, 2D synergy plots using the Zero Interaction Potency (ZIP) model of control sgRNA (“WT”) or anti-LZTR1 sgRNA (“LZTR1 KO”) MOLM-13 cells treated for 72 hours with BI-3406 and/or gilteritinib at various concentrations. Western blot demonstrating p-MEK, p-ERK, and total MEK, ERK, KRAS/NRAS/MRAS, and RIT1 levels (H) as well as RAS-GTP levels (I) in MOLM-13 cells ± LZTR1 KO treated with increasing concentration of DMSO or BI-3406 alone 4 hours after drug treatment.
Figure 6.
LZTR1-mediated drug resistance can be overcome by modulating RAS-GTP abundance. A, Scatter plots of RNA expression levels [shown as normalized reads per kilobase of transcript per million reads mapped (RPKM)] plotted against drug-sensitivity measured ex vivo as the area under the curve (AUC) from AML patient samples harboring FLT3-ITD mutation. n ≥ 111. *, P < 0.05. Pearson correlation coefficients are shown as (r) values. Statistical significance is indicated. B, Schema of the MOLM-13 cell line xenograft experiment. Luciferase-expressing MOLM-13 cells treated with anti-LZTR1 or control sgRNAs were systemically engrafted with 1 × 10⁵ cells/animal via a tail-vein injection after sublethal (225 cGy) irradiation. Seven days later, animals were treated with either vehicle or 30 mg/kg/day of gilteritinib via oral gavage. Animals underwent bioluminescence imaging weekly. C, Kaplan–Meier curve of experiment in B. n = 7–10. **, P < 0.01; ***, P < 0.001. D, Schema of protein-based degrader of RAS proteins. A chimeric protein consisting of a high-affinity target-binding domain for RAS proteins (DARPin K27) is fused to an engineered E3 ligase adapter (SPOP) to confer ubiquitin-mediated degradation of RAS proteins. E, Western blot demonstrating levels of LZTR1 as well as total and GTP-bound KRAS/NRAS/MRAS and RIT1 in MOLM-13 cells ± LZTR1 KO upon doxycycline-mediated induction of the RAS biodegrader (performed in biological triplicate). EV, empty vector. F, Seventy-two-hour cell proliferation assay on parental and LZTR1 KO MOLM-13 cells ± induction of RAS degradation. Cell viability was measured in triplicate using CellTiter-Glo. G, 2D synergy plots using the Zero Interaction Potency (ZIP) model of control sgRNA (“WT”) or anti-LZTR1 sgRNA (“LZTR1 KO”) MOLM-13 cells treated for 72 hours with BI-3406 and/or gilteritinib at various concentrations. Western blot demonstrating p-MEK, p-ERK, and total MEK, ERK, KRAS/NRAS/MRAS, and RIT1 levels (H) as well as RAS-GTP levels (I) in MOLM-13 cells ± LZTR1 KO treated with increasing concentration of DMSO or BI-3406 alone 4 hours after drug treatment.

Comment in

  • doi: 10.1158/2159-8290.CD-12-10-ITI

References

    1. Bigenzahn JW, Collu GM, Kartnig F, Pieraks M, Vladimer GI, Heinz LX, et al. LZTR1 is a regulator of RAS ubiquitination and signaling. Science 2018;362:1171–7. - PMC - PubMed
    1. Damnernsawad A, Bottomly D, Kurtz SE, Eide CA, McWeeney SK, Tyner JW, et al. Genome-wide CRISPR screen identifies regulators of MAPK and MTOR pathways mediating sorafenib resistance in acute myeloid leukemia. Haematologica 2022;107:77–85. - PMC - PubMed
    1. Castel P, Cheng A, Cuevas-Navarro A, Everman DB, Papageorge AG, Simanshu DK, et al. RIT1 oncoproteins escape LZTR1-mediated proteolysis. Science 2019;363:1226–30. - PMC - PubMed
    1. Steklov M, Pandolfi S, Baietti MF, Batiuk A, Carai P, Najm P, et al. Mutations in LZTR1 drive human disease by dysregulating RAS ubiquitination. Science 2018;362:1177–82. - PMC - PubMed
    1. Chen PC, Yin J, Yu HW, Yuan T, Fernandez M, Yung CK, et al. Next-generation sequencing identifies rare variants associated with Noonan syndrome. Proc Natl Acad Sci U S A 2014;111:11473–8. - PMC - PubMed

Publication types

MeSH terms