. 2022 Jul 29;18(7):e1010340.
doi: 10.1371/journal.pgen.1010340. eCollection 2022 Jul.

The RNA-binding protein Puf5 and the HMGB protein Ixr1 contribute to cell cycle progression through the regulation of cell cycle-specific expression of CLB1 in Saccharomyces cerevisiae

Affiliations

The RNA-binding protein Puf5 and the HMGB protein Ixr1 contribute to cell cycle progression through the regulation of cell cycle-specific expression of CLB1 in Saccharomyces cerevisiae

Megumi Sato et al. PLoS Genet. .

Abstract

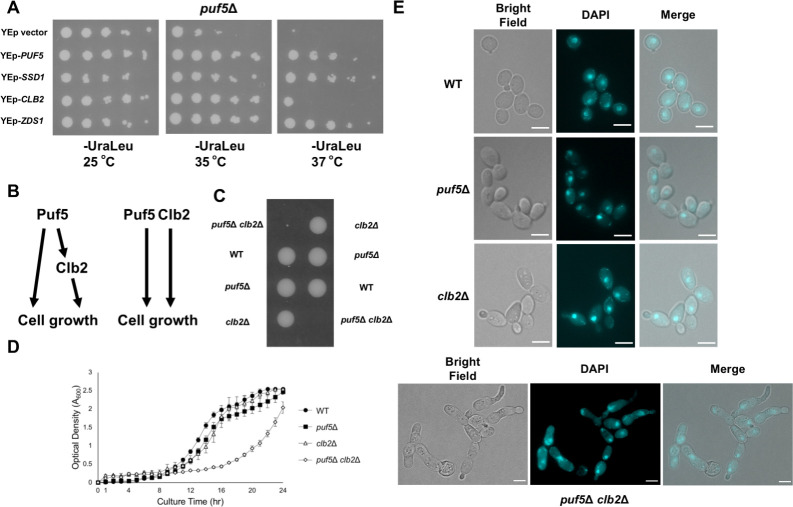
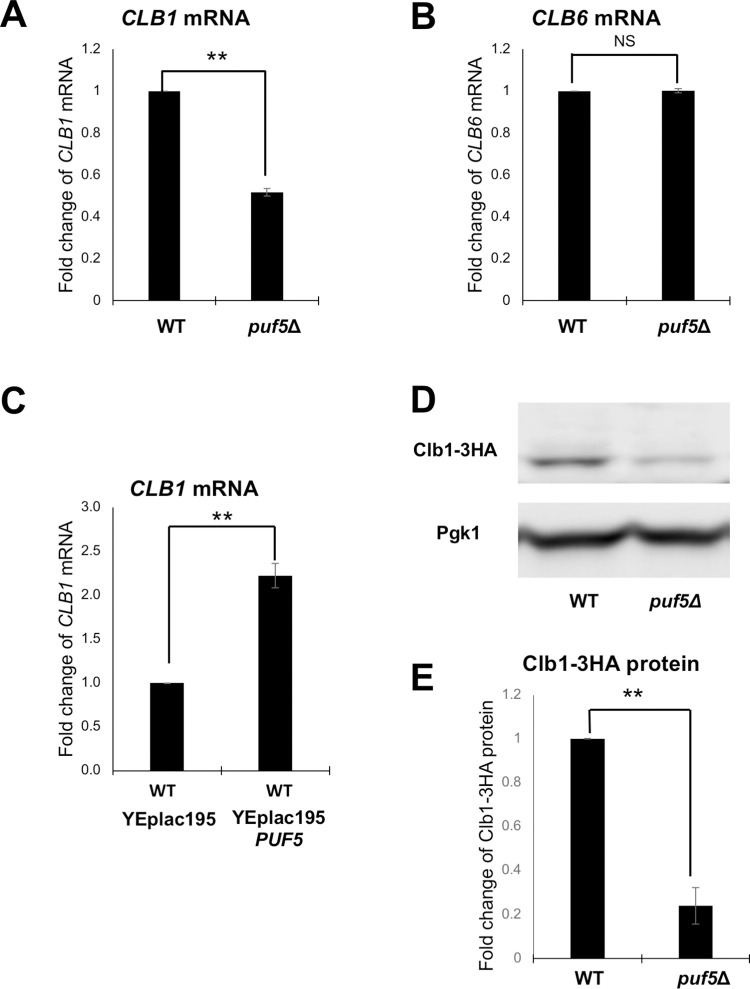
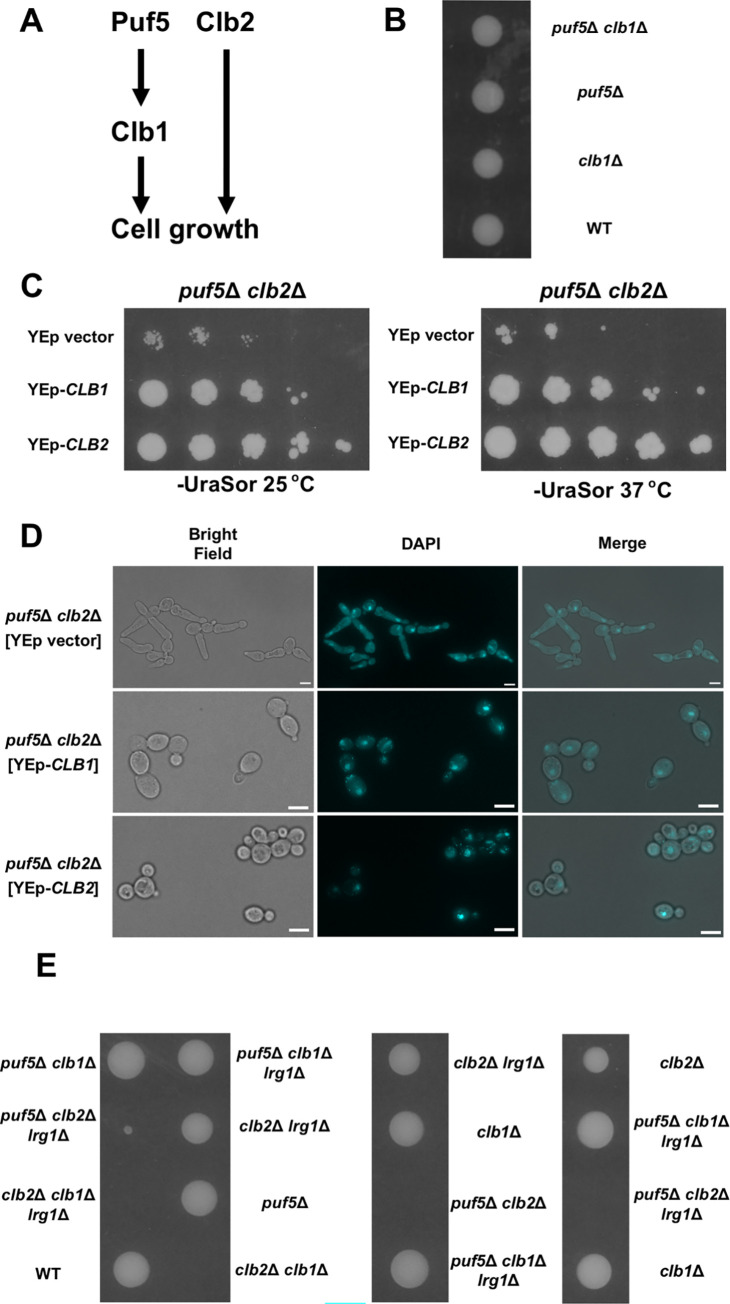
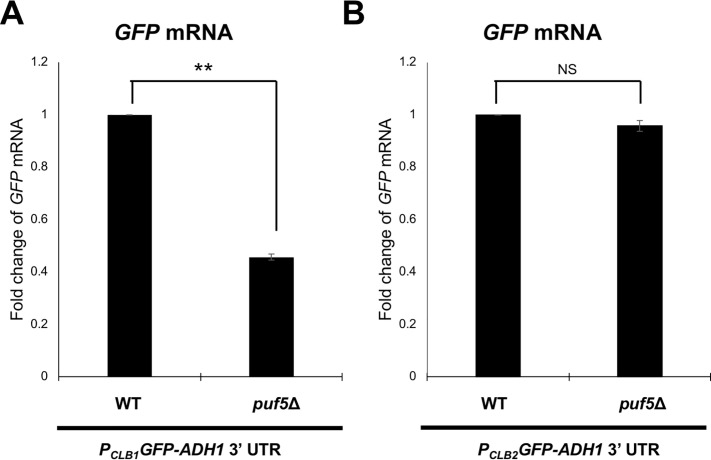
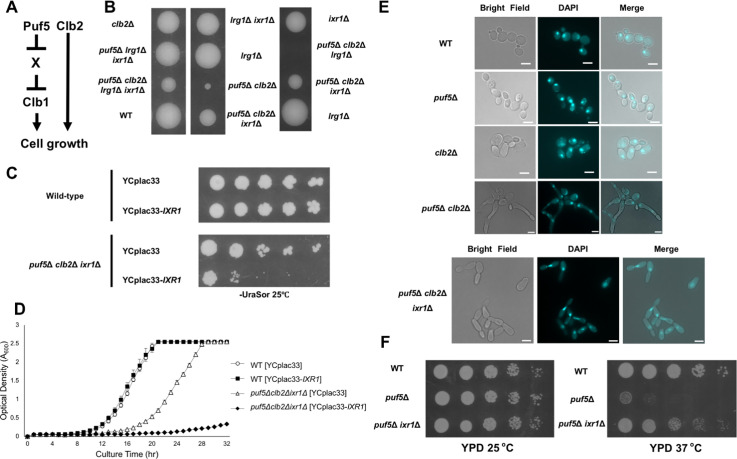
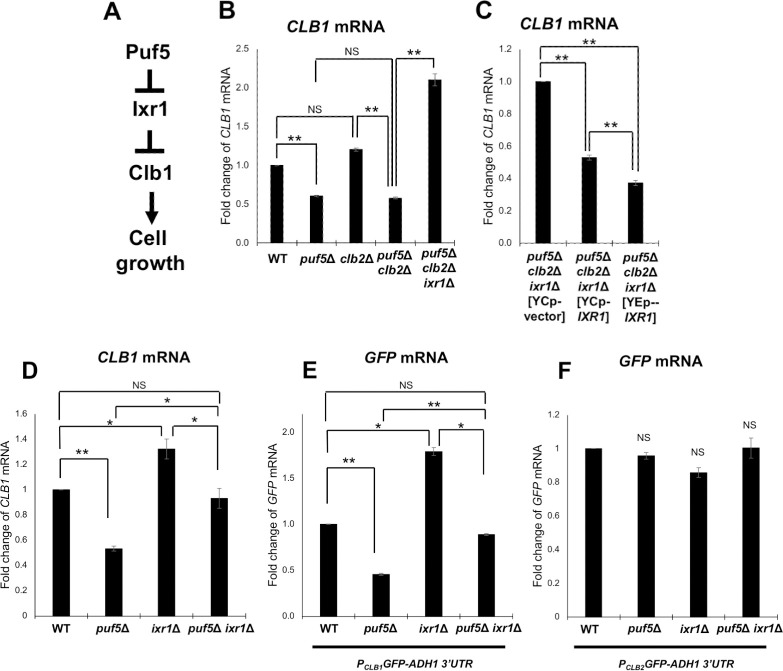
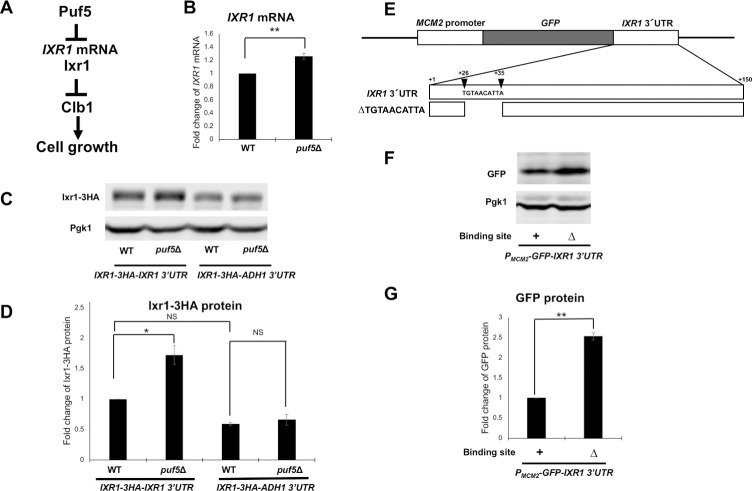
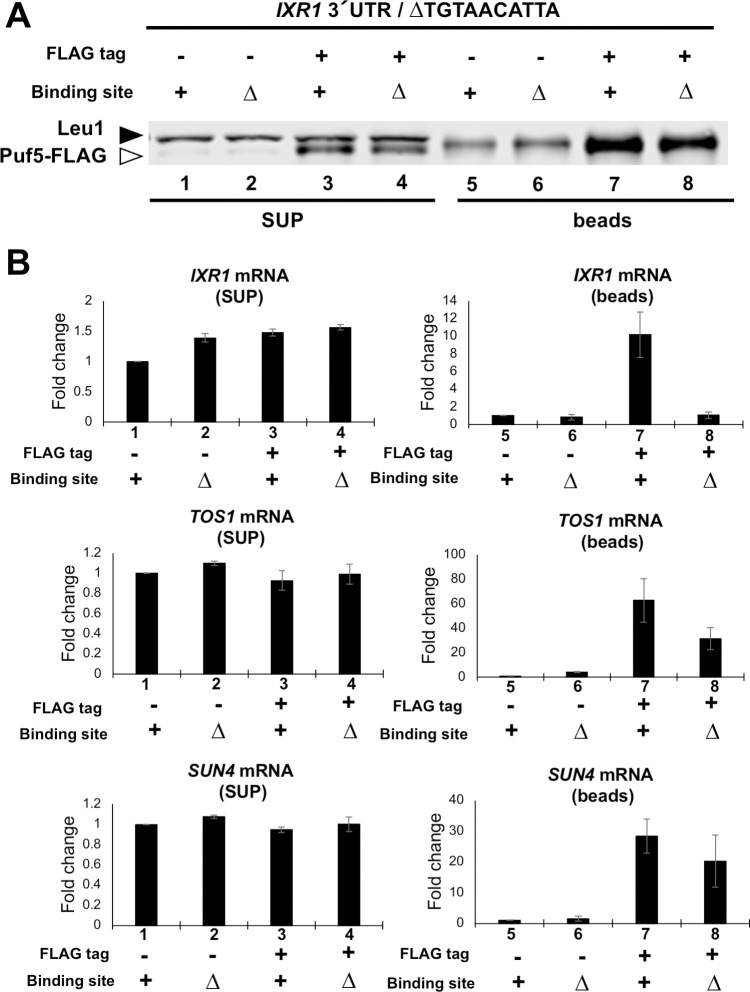
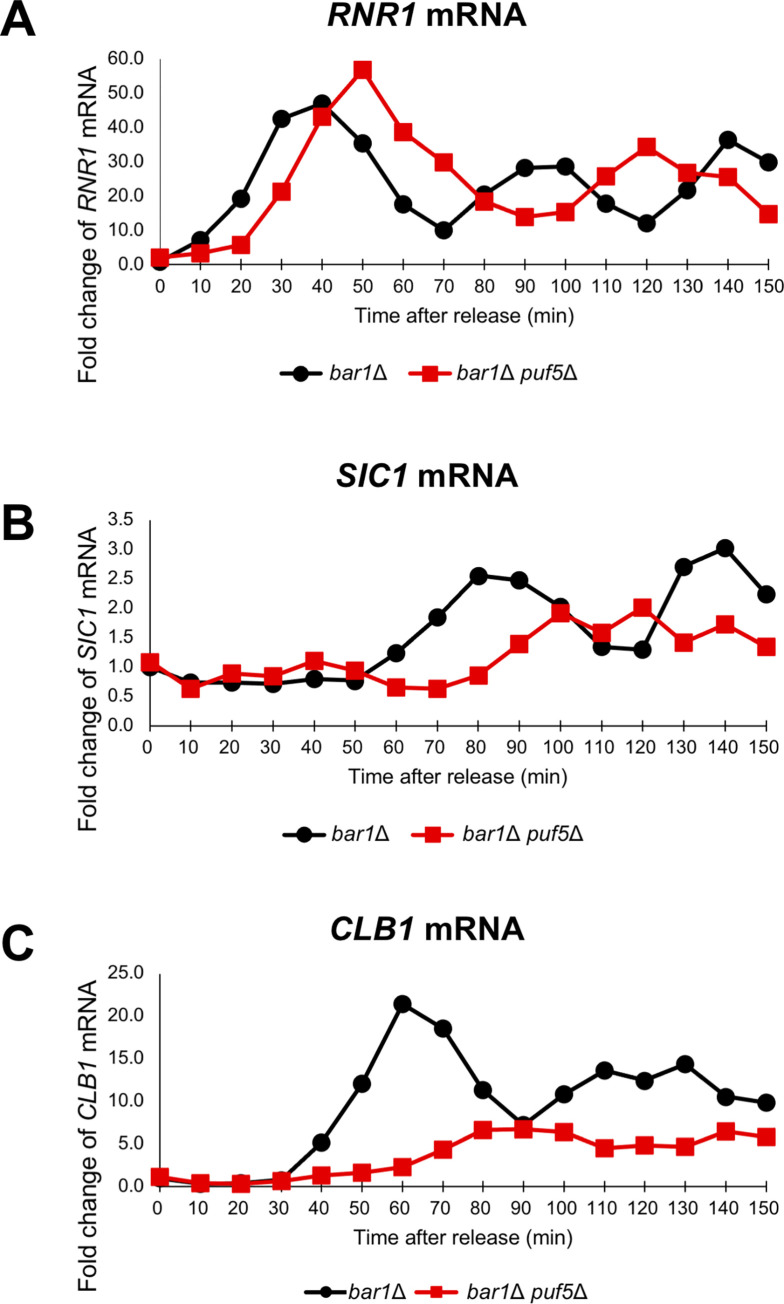
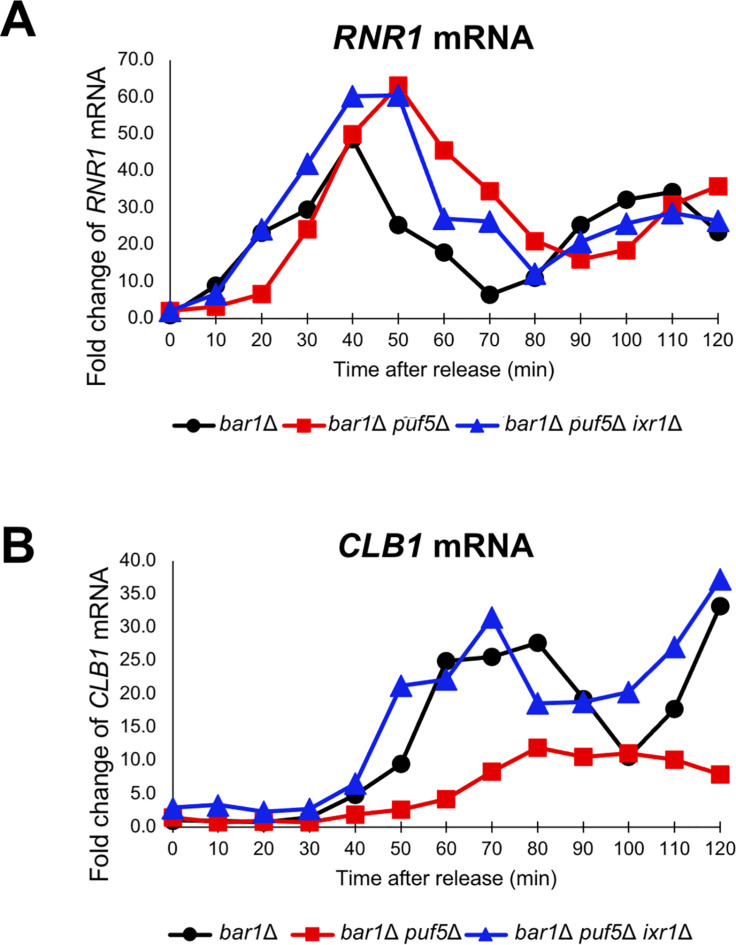
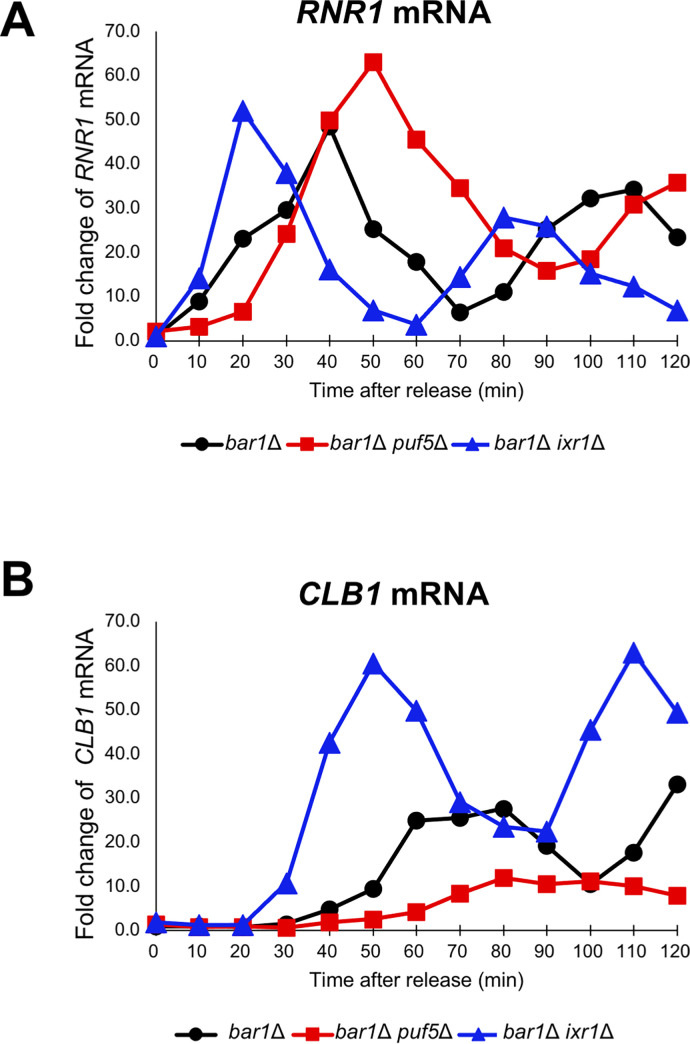
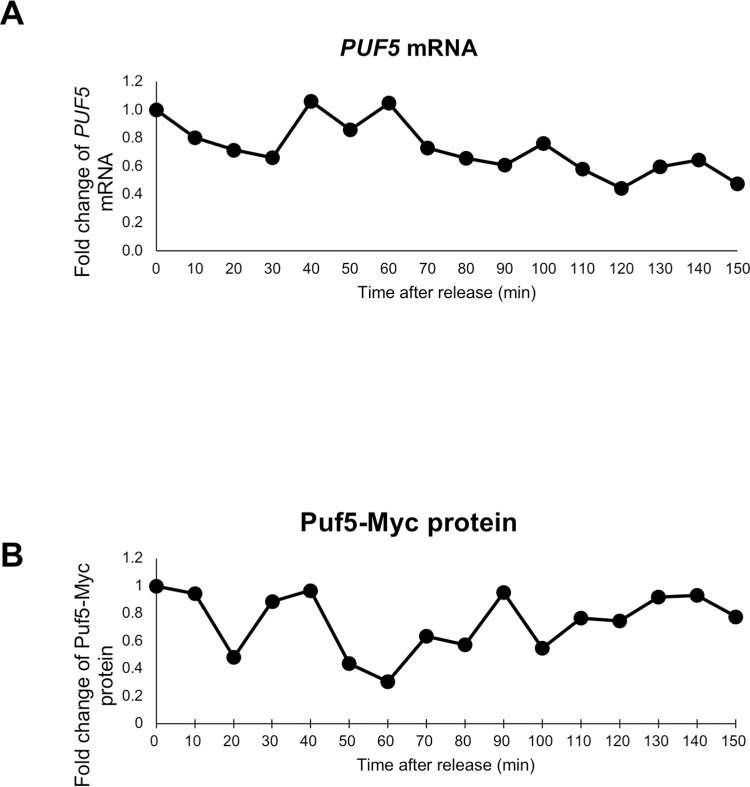
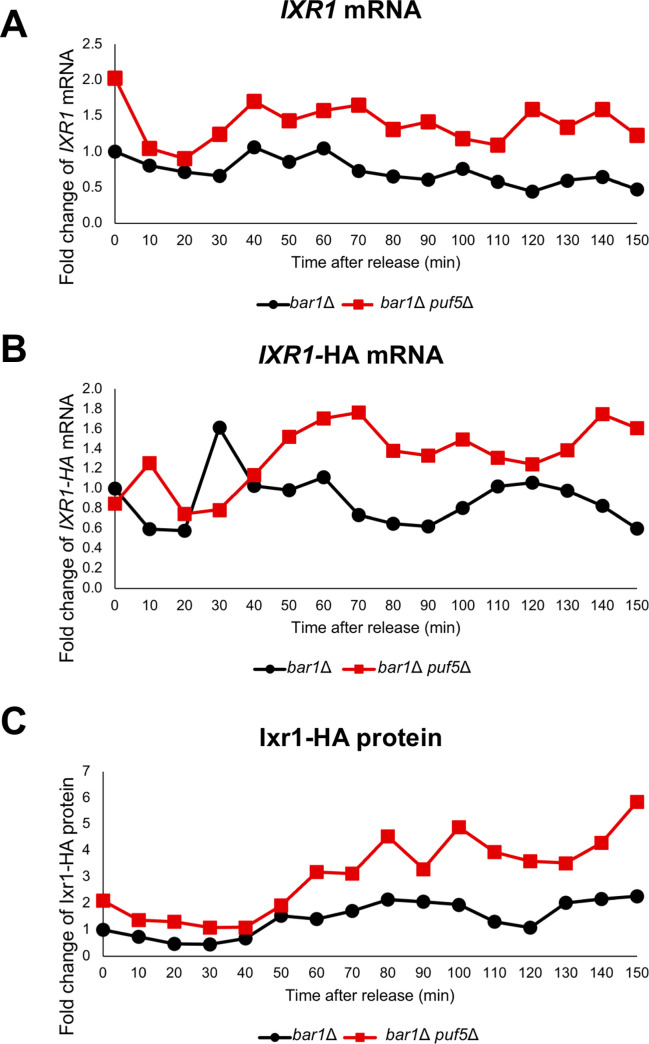
Puf5, a Puf-family RNA-binding protein, binds to 3´ untranslated region of target mRNAs and negatively regulates their expression in Saccharomyces cerevisiae. The puf5Δ mutant shows pleiotropic phenotypes including a weakened cell wall, a temperature-sensitive growth, and a shorter lifespan. To further analyze a role of Puf5 in cell growth, we searched for a multicopy suppressor of the temperature-sensitive growth of the puf5Δ mutant in this study. We found that overexpression of CLB2 encoding B-type cyclin suppressed the temperature-sensitive growth of the puf5Δ mutant. The puf5Δ clb2Δ double mutant displayed a severe growth defect, suggesting that Puf5 positively regulates the expression of a redundant factor with Clb2 in cell cycle progression. We found that expression of CLB1 encoding a redundant B-type cyclin was decreased in the puf5Δ mutant, and that this decrease of the CLB1 expression contributed to the growth defect of the puf5Δ clb2Δ double mutant. Since Puf5 is a negative regulator of the gene expression, we hypothesized that Puf5 negatively regulates the expression of a factor that represses CLB1 expression. We found such a repressor, Ixr1, which is an HMGB (High Mobility Group box B) protein. Deletion of IXR1 restored the decreased expression of CLB1 caused by the puf5Δ mutation and suppressed the growth defect of the puf5Δ clb2Δ double mutant. The expression of IXR1 was negatively regulated by Puf5 in an IXR1 3´ UTR-dependent manner. Our results suggest that IXR1 mRNA is a physiologically important target of Puf5, and that Puf5 and Ixr1 contribute to the cell cycle progression through the regulation of the cell cycle-specific expression of CLB1.


Conflict of interest statement

The authors have declared that no competing interests exist.

Figures

Fig 1
Fig 1. Overexpression of CLB2 repressed the temperature-sensitive phenotype of the puf5Δ mutant.
(A) The multi-copy suppressors of the temperature-sensitive phenotype of the puf5Δ mutant. The puf5Δ mutants harboring YEp13, YEp13-PUF5, YEp13-SSD1, YEp13-CLB2, or YEp13-ZDS1 in addition to the plasmids pRS316-3xFLAG-LRG1 were cultured at 25°C, serially diluted, and spotted onto an SC-Ura-Leu plate, and incubated for 4 days at 25°C, 35°C, or 37°C. (B) Models showing how Puf5 and Clb2 function in cell growth. One is that Clb2 is a downstream target of Puf5, and the other is that Puf5 and Clb2 function in a parallel manner. (C) The tetrad analysis of the strains that are heterozygous for the alleles of PUF5 and CLB2. The cells were sporulated, dissected on a YPD plate, and cultured at 30°C for 3 days. (D) The growth curve of wild-type (black circle), the puf5Δ mutant (black square), the clb2Δ mutant (white triangle), and the puf5Δ clb2Δ mutant (white rhombus) at 25°C. The strains were pre-cultured in a YPD medium containing 10% sorbitol overnight at 25°C, and then transferred into a fresh YPD-Sorbitol medium and cultured at 25°C for 1 day. The data shows the mean± SE (n = 3) of the optical density. (E) Morphology of wild-type, the puf5Δ mutant, the clb2Δ mutant, and the puf5Δ clb2Δ double mutant cells. Bright-field (left), DAPI staining (middle), and the overlayed (right) were shown. The scale bar represents 5 μm.
Fig 2
Fig 2. Puf5 positively regulates CLB1 expression.
(A, B) The mRNA levels of CLB1 (A) and CLB6 (B) in wild-type and the puf5Δ mutant. The cells were cultured in a YPD medium containing 10% sorbitol at 25°C until the log phase. The CLB mRNA levels were quantified by qRT-PCR analysis, and the relative mRNA levels were calculated using the SCR1 reference gene. The data shows the mean ± SE (n = 3) of the fold change of CLB1 mRNA (A) and CLB6 mRNA (B) relative to the mRNA level in wild-type. *P < 0.05, **P < 0.01 as determined by Tukey’s test. (C) The mRNA levels of CLB1 in the wild-type cell overexpressing PUF5. The wild-type strains harboring plasmids YEplac195 or YEplac195-PUF5 were cultured in an SC-Ura medium at 28°C until the exponential phase. The CLB1 mRNA levels were quantified by qRT-PCR analysis, and the relative mRNA levels were calculated using the SCR1 reference gene. The data shows the mean ± SE (n = 3) of the fold change of CLB1 mRNA relative to the mRNA level in wild-type harboring the YEplac195 plasmid. *P < 0.05, **P < 0.01 as determined by Tukey’s test. (D, E) The Clb1 protein levels in wild-type and the puf5Δ mutant, and the quantitative analysis data of Clb1-HA protein level. The strains harboring the YCplac33-CLB1-HA-CLB1 3´ UTR plasmid were cultured in an SC-Ura medium at 28°C. The extracts were immunoblotted with anti-HA antibody or anti-Pgk1 antibody. Clb1-HA protein level was quantified and normalized with the Pgk1 protein level. The data shows the mean ± SE (n = 3) of the fold change of Clb1-HA protein relative to the protein level in wild-type (E). *P < 0.05, **P < 0.01 as determined by Tukey’s test.
Fig 3
Fig 3. The decrease of CLB1 expression in the puf5Δ mutant contributes to the growth defect of the puf5Δ clb2Δ double mutant.
(A) A model of the Puf5 function in cell growth showing the hypothesis that Puf5 controls cell growth through the positive regulation of CLB1, a paralog of CLB2. (B) The tetrad analysis of the strains that are heterozygous for the alleles of PUF5 and CLB1. The cells were sporulated, dissected on a YPD plate, and cultured at 30°C for 3 days. (C) The effects of overexpression of CLB1 and CLB2 are presented. The puf5Δ clb2Δ double mutant strains harboring plasmids YEplac195, YEplac195-CLB1, or YEplac195-CLB2 were cultured in an SC-Ura medium containing 10% sorbitol at 25°C until the exponential phase. Cells were serially diluted, spotted onto an SC-Ura plate containing 10% sorbitol, and incubated for 4 days at 25°C or 37°C. (D) Morphology of the puf5Δ clb2Δ double mutant strains harboring YEp vector, YEp195-CLB1, or YEp195-CLB2. Bright-field (left), DAPI staining (middle), and overlayed (right) were shown. The scale bar represents 5μm. (E) The tetrad analysis of the strains that are heterozygous for the alleles of PUF5, CLB2, CLB1, and LRG1. The cells were sporulated, dissected on a YPD plate, and cultured at 30°C for 3 days.
Fig 4
Fig 4. Puf5 positively regulates CLB1 transcription through the CLB1 promoter.
(A, B) The mRNA levels of GFP in wild-type and the puf5Δ mutant. The strains harboring the YCplac33-CLB1 promoter-GFP-ADH1 3´ UTR plasmid (A) or YCplac33-CLB2 promoter-GFP-ADH1 3´ UTR plasmid (B) were cultured in an SC-Ura medium at 28°C until the exponential phase. The GFP mRNA levels were quantified by qRT-PCR analysis, and the relative mRNA levels were calculated using the SCR1 reference gene. The data shows the mean ± SE (n = 3) of the fold change of GFP mRNA relative to the mRNA level in wild-type. *P < 0.05, **P < 0.01 as determined by Tukey’s test.
Fig 5
Fig 5. Deletion of IXR1 recovered the growth defect of the puf5Δclb2Δ double mutant.
(A) A model showing how Puf5 functions in cell growth through the CLB1 regulation. The hypothesis is presented that Puf5 negatively regulates the expression of X, and X negatively regulates CLB1 expression. (B) The tetrad analysis of the strains that are heterozygous for the alleles of PUF5, CLB2, IXR1, and LRG1. The cells were sporulated, dissected on a YPD plate, and cultured at 30°C for 3 days. (C) The spot assay of wild-type and the puf5Δ clb2Δ ixr1Δ triple mutant harboring plasmids YCplac33 or YCplac33-IXR1. The strains were cultured in an SC-Ura medium containing 10% sorbitol at 25°C until the exponential phase and collected. Cells were serially diluted, spotted onto an SC-Ura plate containing 10% sorbitol, and incubated for 4 days at 25°C. (D) The growth curve of wild-type and the puf5Δ clb2Δ ixr1Δ triple mutant harboring plasmids YCplac33 or YCplac33-IXR1 at 25°C. The strains were pre-cultured in an SC-Ura medium overnight at 25°C, then transferred into a fresh SC-Ura medium, and cultured at 25°C for 1.5 days. The data shows the mean± SE (n = 3) of the optical density. The white circle markers show wild-type [YCplac33], the black square markers show wild-type [YCplac33-IXR1], the white triangle markers show the puf5Δ clb2Δ ixr1Δ [YCplac33], and the black rhombus markers show the puf5Δ clb2Δ ixr1Δ [YCplac33-IXR1]. (E) Morphology of wild-type, the puf5Δ mutant, the clb2Δ mutant, the puf5Δ clb2Δ double mutant, and the puf5Δ clb2Δ ixr1Δ triple mutant strains. Bright field (left), DAPI staining (middle), and overlayed (right) were shown. The scale bar represents 5 μm. (F) The spot assay of wild-type, the puf5Δ mutant, and the puf5Δ ixr1Δ double mutant. The strains were cultured in a YPD medium at 25°C until the exponential phase. Cells were serially diluted, spotted onto YPD plate and incubated for 1 day at 25°C or 37°C.
Fig 6
Fig 6. Ixr1 is a downstream factor of Puf5 and negatively regulates CLB1 expression.
(A) A model showing how Puf5 functions in cell growth through the CLB1 regulation mediated by Ixr1. The hypothesis is presented that Puf5 negatively regulates the expression of the Ixr1 repressor, and Ixr1negatively regulates the CLB1 transcription. (B)The CLB1 mRNA levels in wild-type, the puf5Δ mutant, the clb2Δ mutant, the puf5Δ clb2Δ double mutant, and the puf5Δ clb2Δ ixr1Δ triple mutant. The cells were cultured in a YPD medium containing 10% sorbitol at 28°C until the exponential phase. The CLB1 mRNA levels were quantified by qRT-PCR analysis, and the relative mRNA levels were calculated using the SCR1 reference gene. The data shows the mean ± SE (n = 5) of the fold change of CLB1 mRNA relative to the mRNA level in wild-type. *P < 0.05, **P < 0.01 as determined by Tukey’s test. (C) The CLB1 mRNA levels in the puf5Δ clb2Δ ixr1Δ mutant harboring plasmids YCplac33, YCplac33-IXR1, or YEplac195-IXR1. The strains were cultured in an SC-Ura medium at 25°C until the exponential phase. The CLB1 mRNA levels were quantified by qRT-PCR analysis, and the relative mRNA levels were calculated using the SCR1 reference gene. The data shows the mean ± SE (n = 5) of the fold change of CLB1 mRNA relative to the mRNA level in the strain harboring the YCplac33 plasmid. *P < 0.05, **P < 0.01 as determined by Tukey’s test. (D) The CLB1 mRNA levels in wild-type, the puf5Δ mutant, the ixr1Δ mutant, and the puf5Δ ixr1Δ double mutant. The cells were cultured in a YPD medium at 28°C until the exponential phase. The CLB1 mRNA levels were quantified by qRT-PCR analysis, and the relative mRNA levels were calculated using the SCR1 reference gene. The data shows the mean ± SE (n = 5) of the fold change of CLB1 mRNA relative to the mRNA level in wild-type. *P < 0.05, **P < 0.01 as determined by Tukey’s test. (E, F) The GFP mRNA levels in wild-type, the puf5Δ mutant, the ixr1Δ mutant, and the puf5Δ ixr1Δ double mutant. The strains harboring the YCplac33-CLB1 promoter-GFP-ADH1 3´ UTR plasmid (E) or YCplac33-CLB2 promoter-GFP-ADH1 3´ UTR plasmid (F) were cultured in an SC-Ura medium at 28°C until the exponential phase. The GFP mRNA levels were quantified by qRT-PCR analysis, and the relative mRNA levels were calculated using the SCR1 reference gene. The data shows the mean ± SE (n = 3) of the fold change of GFP mRNA relative to the mRNA level in wild-type. *P < 0.05, **P < 0.01 as determined by Tukey’s test.
Fig 7
Fig 7. Puf5 negatively regulates IXR1 expression through the IXR1 3’ UTR.
(A) A model showing how Puf5 functions in cell growth through the CLB1 regulation, which is mediated by Ixr1. The hypothesis is presented that Puf5 negatively regulates the IXR1 expression through the IXR1 mRNA, and that Ixr1negatively regulates the CLB1 transcription. (B) The IXR1 mRNA levels in wild-type and the puf5Δ mutant. The cells were cultured in a YPD medium containing 10% sorbitol at 25°C until the exponential phase. The IXR1 mRNA levels were quantified by qRT-PCR analysis, and the relative mRNA levels were calculated using the SCR1 reference gene. The data shows the mean ± SE (n = 3) of the fold change of IXR1 mRNA relative to the mRNA level in wild-type. *P < 0.05, **P < 0.01 as determined by Tukey’s test. (C, D) The Ixr1 protein levels in wild-type and the puf5Δ mutant and the quantitative analysis data of Ixr1-HA protein level. The strains harboring the YCplac33-IXR1-HA-IXR1 3´ UTR plasmid or the YCplac33-IXR1-HA-ADH1 3´ UTR plasmid were cultured in an SC-Ura medium at 28°C. The extracts were immunoblotted with anti-HA antibody or anti-Pgk1 antibody. Ixr1-HA protein level was quantified and normalized with the Pgk1 protein level. The data shows the mean ± SE (n = 3) of the fold change of Ixr1-HA protein relative to the protein level in wild-type harboring the YCplac33-IXR1-HA-IXR1 3´ UTR plasmid (D). *P < 0.05, **P < 0.01 as determined by Tukey’s test. (E) Scheme of the YCplac33-IXR1-HA-IXR1 3´ UTR plasmid. ΔTGTAACATTA harbors the deletion of the sequence encoding the Puf5-binding site of IXR1 mRNA, 5´-TGTAACATTA. Described numbers correspond to the number of bases from the stop codon of IXR1. (F, G) The GFP protein levels and the quantitative analysis data of GFP protein level in wild-type strain compared by the presence of the Puf5-binding site deletion. The strains harboring the YCplac33-MCM2 promoter-GFP-IXR1 3´ UTR plasmid with or without the Puf5-binding site were cultured in an SC-Ura medium at 28°C. The extracts were immunoblotted with anti-GFP antibody or anti-Pgk1 antibody. GFP protein level was quantified and normalized with the Pgk1 protein level. The data shows the mean ± SE (n = 3) of the fold change of GFP protein relative to the protein level in the strains harboring the YCplac33-MCM2 promoter-GFP-IXR1 3´ UTR plasmid with the Puf5-binding site (G). *P < 0.05, **P < 0.01 as determined by Tukey’s test.
Fig 8
Fig 8. Puf5 binds to 3´ UTR of IXR1 mRNA.
(A,B) RIP analysis data clarifying the binding between Puf5 protein and IXR1 mRNA. The extract was obtained from ixr1Δ PUF5-FLAG-ADH1 3´ UTR strain harboring the YEplac195-IXR1 plasmid, and Puf5-FLAG protein was immunoprecipitated with anti-FLAG antibody. The ixr1Δ untagged-PUF5 strain was used as a negative control. Sample 1–4 contain the supernatant, and sample 5–8 contain the immunoprecipitants. Sample 1 and 5, untagged strain with Puf5-binding element; sample 2 and 6, untagged strain without Puf5-binding element; sample 3 and 7, FLAG-tagged strain with Puf5-binding element; sample 4 and 8, FLAG-tagged strain without Puf5-binding element. (A) Puf5-FLAG protein level in supernatant and immunoprecipitants. The white arrowhead corresponds to Puf5-FLAG protein, and the black to Leu1 protein. (B) IXR1 mRNA levels in the supernatant and the immunoprecipitants. TOS1 mRNA levels and SUN4 mRNA levels were presented as positive controls. The mRNA levels were quantified by qRT-PCR analysis, and the fold change was calculated relative to the mRNA level in the untagged strain with Puf5-binding element (sample 1 for the supernatant, and sample 5 for the immunoprecipitants).
Fig 9
Fig 9. The cell cycle-regulated expression of CLB1 was diminished in the puf5Δ mutant.
(A-C) The cell cycle-dependent mRNA levels of CLB1 in the synchronized bar1Δ cell (black circle) and bar1Δ puf5Δ mutant (red square). The cell cycle was arrested in the G1 phase by α-factor, and, after release, cells were collected from 0 min (just before releasing) to 150 min. The levels of RNR1 mRNA (A), an S phase marker, SIC1 mRNA (B), a late M phase marker, and CLB1 mRNA (C) were quantified by qRT-PCR analysis, and the relative mRNA levels were calculated using the SCR1 reference gene. The vertical axis shows the fold change of mRNA relative to the mRNA level in the bar1Δ 0 min sample, and the horizontal axis shows the time after release.
Fig 10
Fig 10. IXR1 deletion restored the decreased expression of CLB1 caused by PUF5 deletion.
(A, B) The cell cycle-dependent mRNA levels of CLB1 (B) in the cell cycle synchronized bar1Δ cell (black circle), bar1Δ puf5Δ mutant (red square), and bar1Δ puf5Δ ixr1Δ mutant (blue triangle). The cell cycle was arrested in the G1 phase by α-factor, and, after release, cells were collected from 0 min (just before releasing) to 120 min. The levels of RNR1 mRNA (A), an S phase marker, and CLB1 mRNA (B) were quantified by qRT-PCR analysis, and the relative mRNA levels were calculated using the SCR1 reference gene. The vertical axis shows the fold change of mRNA relative to the mRNA level in the bar1Δ 0 min sample, and the horizontal axis shows the time after release.
Fig 11
Fig 11. Ixr1 negatively regulates the cell cycle-specific expression of CLB1.
(A, B) The cell cycle-dependent mRNA levels of CLB1 (B) in the synchronized bar1Δ cell (black circle), bar1Δ puf5Δ mutant (red square), and bar1Δ ixr1Δ mutant (blue triangle). The cell cycle was arrested in the G1 phase by α-factor, and, after release, cells were collected from 0 min (just before releasing) to 120 min. The levels of RNR1 mRNA (A), an S phase marker, and CLB1 mRNA (B) were quantified by qRT-PCR analysis, and the relative mRNA levels were calculated using the SCR1 reference gene. The vertical axis shows the fold change of mRNA relative to the mRNA level in the bar1Δ 0 min sample, and the horizontal axis shows the time after release.
Fig 12
Fig 12. PUF5 expression is invariable during the cell cycle.
(A) The cell cycle-dependent mRNA levels of PUF5 in the synchronized bar1Δ cell, the same sample used in Fig 9. The cell cycle was arrested in the G1 phase by α-factor, and, after release, cells were collected from 0 min (just before releasing) to 150 min. The levels of PUF5 mRNA were quantified by qRT-PCR analysis, and the relative mRNA levels were calculated using the SCR1 reference gene. The vertical axis shows the fold change of mRNA relative to the mRNA level in the bar1Δ 0 min sample, and the horizontal axis shows the time after release. (B) The cell cycle-dependent Puf5 protein level in the synchronized bar1Δ cell integrated PUF5-13Myc-ADH1 3´ UTR gene. The cell cycle was arrested in the G1 phase by α-factor, and, after release, cells were collected from 0 min (just before releasing) to 150 min. The extracts were immunoblotted with anti-Myc antibody or anti-Pgk1 antibody. The blot image is presented in S5A Fig. Puf5-Myc protein level was quantified and normalized with the Pgk1 protein level. The vertical axis shows the fold change of protein relative to the protein level in the bar1Δ 0 min sample, and the horizontal axis shows the time after release.
Fig 13
Fig 13. IXR1 expression is invariable during the cell cycle.
(A) The IXR1 mRNA levels in the synchronized bar1Δ cell (black circle) and bar1Δ puf5Δ mutant (red square), the same sample used in Fig 9. The cell cycle was arrested in the G1 phase by α-factor, and, after release, cells were collected from 0 min (just before releasing) to 150 min. The IXR1 mRNA level was quantified by qRT-PCR analysis, and the relative mRNA levels were calculated using the SCR1 reference gene. The mRNA level in the bar1Δ 0 min sample was set as a reference. The vertical axis shows the fold change of IXR1 mRNA relative to the mRNA level in the bar1Δ 0 min sample, and the horizontal axis shows the time after release. (B) The IXR1-HA mRNA levels in the synchronized bar1Δ cell (black circle) and bar1Δ puf5Δ mutant (red square) harboring the YCplac33-IXR1-HA-IXR1 3´ UTR plasmid. The cell cycle was arrested in the G1 phase by α-factor, and, after release, cells were collected from 0 min (just before releasing) to 150 min. The IXR1-HA mRNA level was quantified by qRT-PCR analysis, and the relative mRNA levels were calculated using the SCR1 reference gene. The mRNA level in the bar1Δ 0 min sample was set as a reference. The vertical axis shows the fold change of IXR1-HA mRNA relative to the mRNA level in the bar1Δ 0 min sample, and the horizontal axis shows the time after release. (C) The Ixr1-HA protein level in the synchronized bar1Δ cell (black circle) and bar1Δ puf5Δ mutant (red square) harboring the YCplac33-IXR1-HA-IXR1 3´ UTR plasmid. The cell cycle was arrested in the G1 phase by α-factor, and, after release, cells were collected from 0 min (just before releasing) to 150 min. The extracts were immunoblotted with anti-HA antibody or anti-Pgk1 antibody. The blot image is presented in S5B–S5D Fig. Ixr1-HA protein level was quantified and normalized with the Pgk1 protein level. The Ixr1-HA protein level in the bar1Δ 0 min sample was set as a reference. The vertical axis shows the fold change of protein relative to the protein level in the bar1Δ 0 min sample, and the horizontal axis shows the time after release.

Similar articles

Cited by

References

    1. Parker R. RNA degradation in Saccharomyces cerevisae. Genetics. 2012; 191: 671–702. doi: 10.1534/genetics.111.137265 - DOI - PMC - PubMed
    1. Mitchell SF, Parker R. Principles and properties of eukaryotic mRNPs. Mol Cell. 2014; 54: 547–558. doi: 10.1016/j.molcel.2014.04.033 - DOI - PubMed
    1. Wang M, Ogé L, Perez-Garcia MD, Hamama L, Sakr S. The PUF Protein Family: Overview on PUF RNA Targets, Biological Functions, and Post Transcriptional Regulation. Int J Mol Sci. 2018; 19: 410. doi: 10.3390/ijms19020410 - DOI - PMC - PubMed
    1. Hogan DJ, Riordan DP, Gerber AP, Herschlag D, Brown PO. Diverse RNA-binding proteins interact with functionally related sets of RNAs, suggesting an extensive regulatory system. PLoS Biol. 2008; 6: e255. doi: 10.1371/journal.pbio.0060255 - DOI - PMC - PubMed
    1. Wickens M, Bernstein DS, Kimble J, Parker R. RNA. Trends Genet. 2002; 18: 150–157. doi: 10.1016/s0168-9525(01)02616-6 - DOI - PubMed

MeSH terms