. 2022 Jul 29;17(7):e0271446.
doi: 10.1371/journal.pone.0271446. eCollection 2022.

Analysis of multi-strain infection of vaccinated and recovered population through epidemic model: Application to COVID-19

Affiliations

Analysis of multi-strain infection of vaccinated and recovered population through epidemic model: Application to COVID-19

Olusegun Michael Otunuga. PLoS One. .

Abstract

In this work, an innovative multi-strain SV EAIR epidemic model is developed for the study of the spread of a multi-strain infectious disease in a population infected by mutations of the disease. The population is assumed to be completely susceptible to n different variants of the disease, and those who are vaccinated and recovered from a specific strain k (k ≤ n) are immune to previous and present strains j = 1, 2, ⋯, k, but can still be infected by newer emerging strains j = k + 1, k + 2, ⋯, n. The model is designed to simulate the emergence and dissemination of viral strains. All the equilibrium points of the system are calculated and the conditions for existence and global stability of these points are investigated and used to answer the question as to whether it is possible for the population to have an endemic with more than one strain. An interesting result that shows that a strain with a reproduction number greater than one can still die out on the long run if a newer emerging strain has a greater reproduction number is verified numerically. The effect of vaccines on the population is also analyzed and a bound for the herd immunity threshold is calculated. The validity of the work done is verified through numerical simulations by applying the proposed model and strategy to analyze the multi-strains of the COVID-19 virus, in particular, the Delta and the Omicron variants, in the United State.


Conflict of interest statement

The authors have declared that no competing interests exist.

Figures
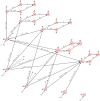
Fig 1
Fig 1. Schematic diagram for the epidemic model (1).
The circle compartments represent group of individuals.
Fig 2
Fig 2. Schematic diagram for the epidemic model (35).
The circle compartments represent group of individuals.
Fig 3
Fig 3. Stability analysis for the disease-free equilibrium.
Case where R1<1 and R2<1. Here, we set β1 = 0.07, β2 = 0.2, γ1 = 0.1, γ2 = 0.12, μ = 1/80.3, q1 = 0.5, q2 = 0.4, λ1 = 1/5, λ2 = 1/4, r1 = 1/10.5, r2 = 1/9, θ1 = 0.09, θ2 = 0.1. The reproduction numbers R1=0.08 and R2=0.74 so that R0=0.74. On the long run, the susceptible population reduces to 10% of the population size while the population receiving vaccination against strains 1 and 2 increases to 50% and 40% of the population size, respectively, in this scenario. The exposed and infected population size converges to zero on the long run. The disease-free equilibrium is calculated as E0={0.1,0.5,0.4,0,0,0,0,0,0,0,0}.
Fig 4
Fig 4. Stability analysis for the strain 1 equilibrium.
Case where R1>1 and R2<1. This is a case where β1 = 1.2, β2 = 0.4, γ1 = 0.5, γ2 = 0.08, μ = 1/80.3, q1 = 0.1, q2 = 0.5, λ1 = 1/5, λ2 = 1/4, r1 = 1/10.5, r2 = 1/9, θ1 = 0.09, θ2 = 0.1. A scenario where the population of those receiving vaccination against strain 1 (with high transmission rate) dropped, leading to strain 1 endemic. In this case, R1=2.81 and R2=0.86 so that R0=2.81. The strain 1 equilibrium is obtained as E1={0.1422,0.1000,0.5000,0.0151,0,0.0168,0,0.0118,0,0.2141,0}.
Fig 5
Fig 5. Stability analysis for strain 2 equilibrium.
Case where R1<1 and R2>1. In this case, we set β1 = 0.18, β2 = 0.9, γ1 = 0.1, γ2 = 0.4, μ = 1/80.3, q1 = 0.5, q2 = 0.1, λ1 = 1/5, λ2 = 1/4, r1 = 1/10.5, r2 = 1/9, θ1 = 0.09, θ2 = 0.1. In this case, R1=0.47 and R2=4.41 so that R0=4.41. The strain 2 equilibrium is obtained as E2={0.0907,0.1134,0.1000,0,0.0330,,0,0.0401,0,0.0294,0,0.5934}. This vector shows proportions that each of the population sizes S, V1, V2, E1, E2, A1, A2, I1, I2, R1, R2 converge to on the long run.
Fig 6
Fig 6. Stability analysis for the equilibrium ES2.
Case where R1>R2>1+R1-11+Q2-Q1+R¯11-q+Q1-R¯1R1. In this case, we set β1 = 1.2, β2 = 0.9, γ1 = 0.5, γ2 = 0.4, μ = 1/80.3, q1 = 0.1, q2 = 0.5, λ1 = 1/5, λ2 = 1/4, r1 = 1/10.5, r2 = 1/9, θ1 = 0.09, θ2 = 0.1. In this case, R1=2.81 and R2=2.45 so that R0=2.81. We see in this case that 1+R1-11+Q2-Q1+R¯11-q+Q1-R¯1R1=1.10 and R1>R2>1+R1-11+Q2-Q1+R¯11-q+Q1-R¯1R1, implying the existence of endemic with more than one strain. We see an endemic with both strains 1 and 2 because the population is already in an endemic state with strain 1 before strain 2 caused an endemic, and the number of secondary infection caused by strain 2 is more than 1+R1-11+Q2-Q1+R¯11-q+Q1-R¯1R1 but not up to that caused by strain 1. The endemic equilibrium in this case is ES2={0.1422,0.0416,0.5000,0.0034,0.0136,0.0038,0.0165,0.0027,0.0121,0.0203,0.2439}.
Fig 7
Fig 7. Stability analysis for the case where R1>R2>1 but condition (39) is not satisfied.
In this case, we set β1 = 1, β2 = 0.05, γ1 = 0.5, γ2 = 0.4, μ = 1/80.3, q1 = 0.1, q2 = 0.5, p = 0.6, λ1 = 0.2, λ2 = 0.25, r1 = 1/10.5, r2 = 1/9, θ1 = 0.09, θ2 = 0.1. The endemic equilibrium in this case is the strain 1 equilibrium E1={0.1588,0.1000,0.5000,0.0141,0,0.0158,0,0.0110,0,0.2003,0}. Here, R1=2.52, R2=1.01, 1+R1-11+Q2-Q1+R¯11-q+Q1-R¯1R1=1.09 and condition (39) is not satisfied since R1>1+R1-11+Q2-Q1+R¯11-q+Q1-R¯1R1>R2>1. This condition implies, from (38), that E1+>0 and E2+<0, so that the values I1+, A1+, and R1+ are positive but I2+, A2+, and R2+ are negative. This shows that only strain 1 endemic exists on the long run. A similar analysis is presented in Appendix B in S1 Appendix geometrically.
Fig 8
Fig 8. Stability analysis for the case where R2>R1>1.
In this case, we set β1 = 0.9, β2 = 1.0, γ1 = 0.4, γ2 = 0.45, μ = 1/80.3, q1 = 0.12, q2 = 0.1, p = 0.8, λ1 = 0.21, λ2 = 0.2, r1 = 1/9, r2 = 1/10.5, θ1 = 0.1, θ2 = 0.09. Here, R1=3.09 and R2=4.49 so that R0=4.49. The endemic equilibrium in this case is {0.1739, 0.0267, 0.1000, 0, 0.0410, 0, 0.0609, 0, 0.0160, 0, 0.5815}.
Fig 9
Fig 9. Real (blue) and estimated (red) COVID-19 weekly cases for the Delta variant in the United States.
Fig 10
Fig 10. Estimated trajectory path for S, V1, E1, A1, I1, and R1 for the Delta variant.
The analysis suggests that the trajectories of the population of those receiving vaccination against the delta variant and those recovering from the variant are decreasing, while the susceptible, exposed and asymptomatic populations are increasing in the time period 10.09.2021 to 12.18.2021. The symptomatic population decreases from 10.09.2021 to 10.23.2021, after which it started increasing until the end of the analysis in 12.18.2021. The reproduction number R0 for the variant, using (14), was calculated to be 1.94.
Fig 11
Fig 11. Herd immunity as a function of the measure of the effectiveness of vaccines for the Delta variant in the United States.
Fig 12
Fig 12. Proportion of the Delta (a) and the Omicron (b) variant for the period 12.11.2021 to 01.15.2022 in the United States collected from CDC2.
Fig 13
Fig 13. Real (dotted blue) and estimated (red) COVID-19 weekly cases for the Delta variant and the Omicron variant for the period 11.27.2021 to 01.15.2022 in the United States.
Fig 14
Fig 14. Estimated results for the Delta and Omicron variants.
The result shows that the number of Delta exposure and infection cases is decreasing (slowing down) while the number of Omicron exposure and infection cases is increasing (speeding up) between December 11, 2021 and January 15, 2022. These bring about a decrease in the population of those who are vaccinated against the Delta variant and an increase (at a slowing pace) in the number of those vaccinated against the Omicron variant. The number of those susceptible to the variants rises between the period 12.11.2021 to 01.01.2022, after which it started falling until 01.15.2022. The population of those who recovered from the Delta variant is speedingly descreasing while the count of those who recovered from Omicron variant is increasing at a speeding pace. The result of the trajectory of the estimated Delta and Omicron cases is similar to the plot shown in the work of Nyberg et al. [70].

Similar articles

Cited by

References

    1. US government SARS-COV-2 Interagency Group (SIG). https://cdc.gov/coronavirus/2019-ncov/variants/variant-info.html.
    1. The United States Center for Disease and Control: Information on OMICRON variant. https://cdc.gov/coronavirus/2019-ncov/variants/omicron-variant.html
    1. The United States Center for Disease and Control: Information on DELTA variant. https://cdc.gov/coronavirus/2019-ncov/variants/delta-variant.html
    1. Appiah G.D., Blanton L., D’Mello T., Kniss K., Smith S., Mustaquim D., et al. Influenza activity-United States, 2014-15 season and composition of the 2015-16 influenza vaccine. MMWR Morb Mortal Wkly Rep. 2015; 64:21 583–590 - PMC - PubMed
    1. Arruda E. F., Das S. S., Dias C. M., and Pastore D. H. Modelling and optimal control of multi strain epidemics, with application to COVID-19. PLoS ONE. 2021;16:9. e0257512. 10.1371/journal.pone.0257512 doi: 10.1371/journal.pone.0257512 - DOI - DOI - PMC - PubMed

Supplementary concepts