. 2022 Jul 29;8(30):eabo6743.
doi: 10.1126/sciadv.abo6743. Epub 2022 Jul 29.

A biomineral-inspired approach of synthesizing colloidal persistent phosphors as a multicolor, intravital light source

Affiliations

A biomineral-inspired approach of synthesizing colloidal persistent phosphors as a multicolor, intravital light source

Fan Yang et al. Sci Adv. .

Abstract

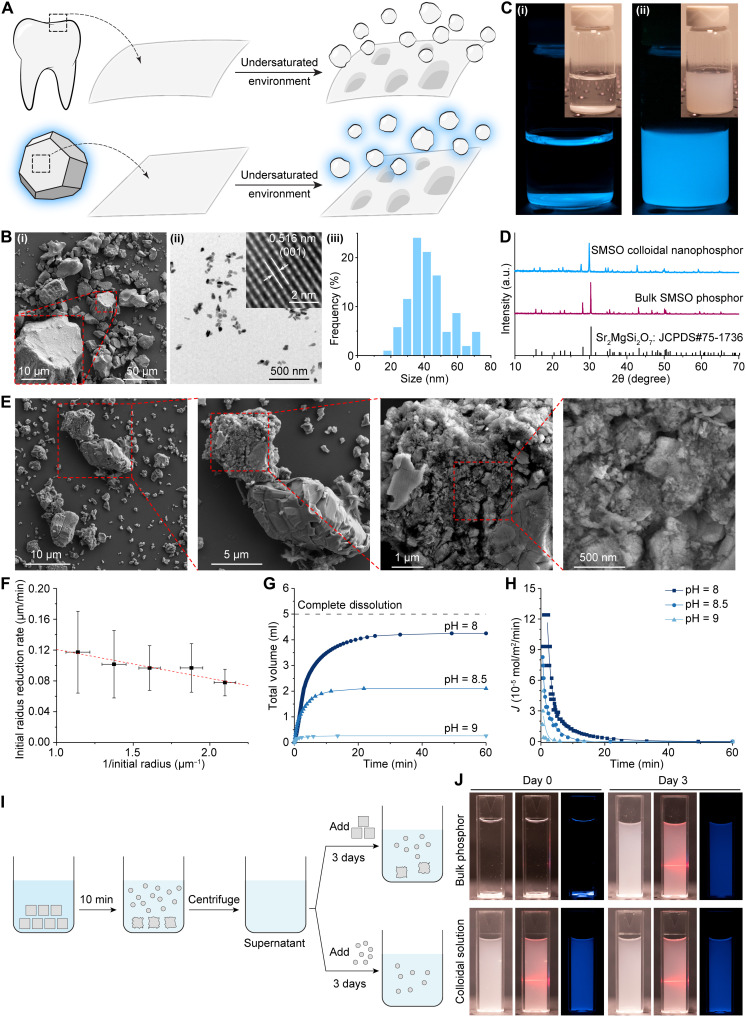
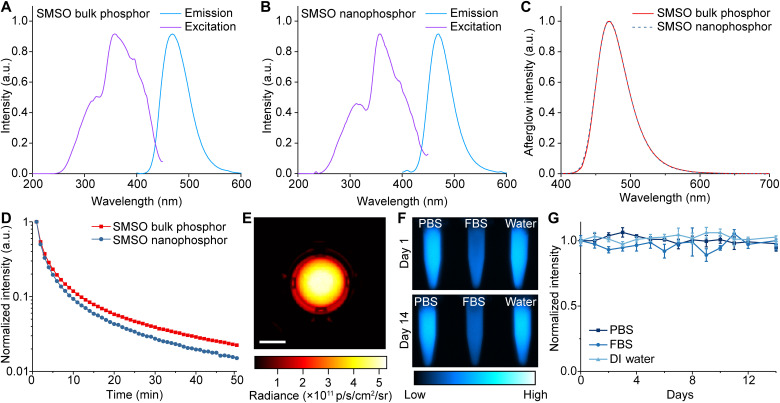
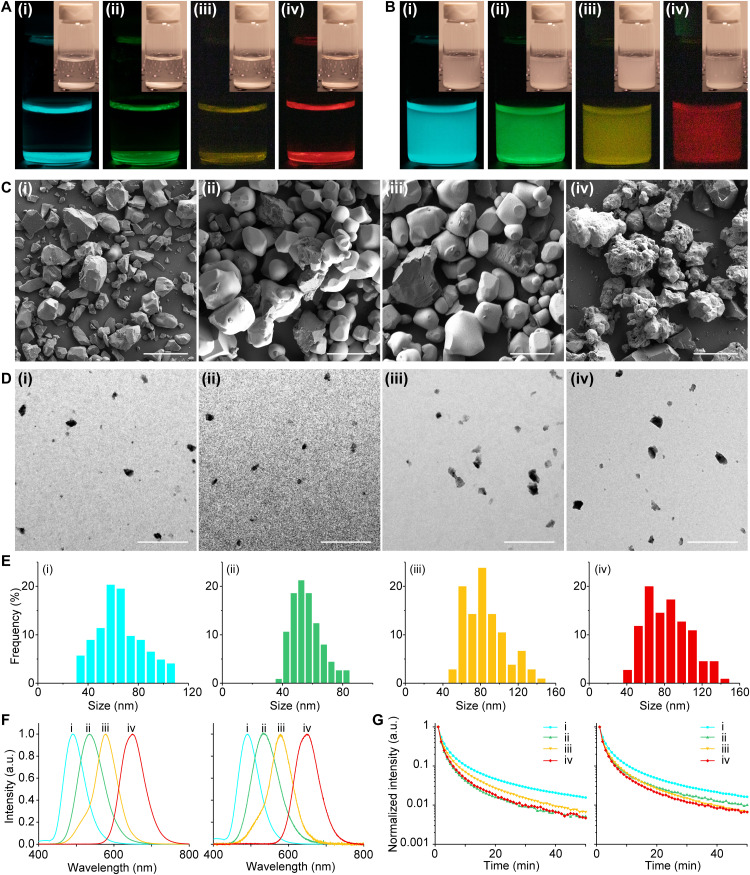
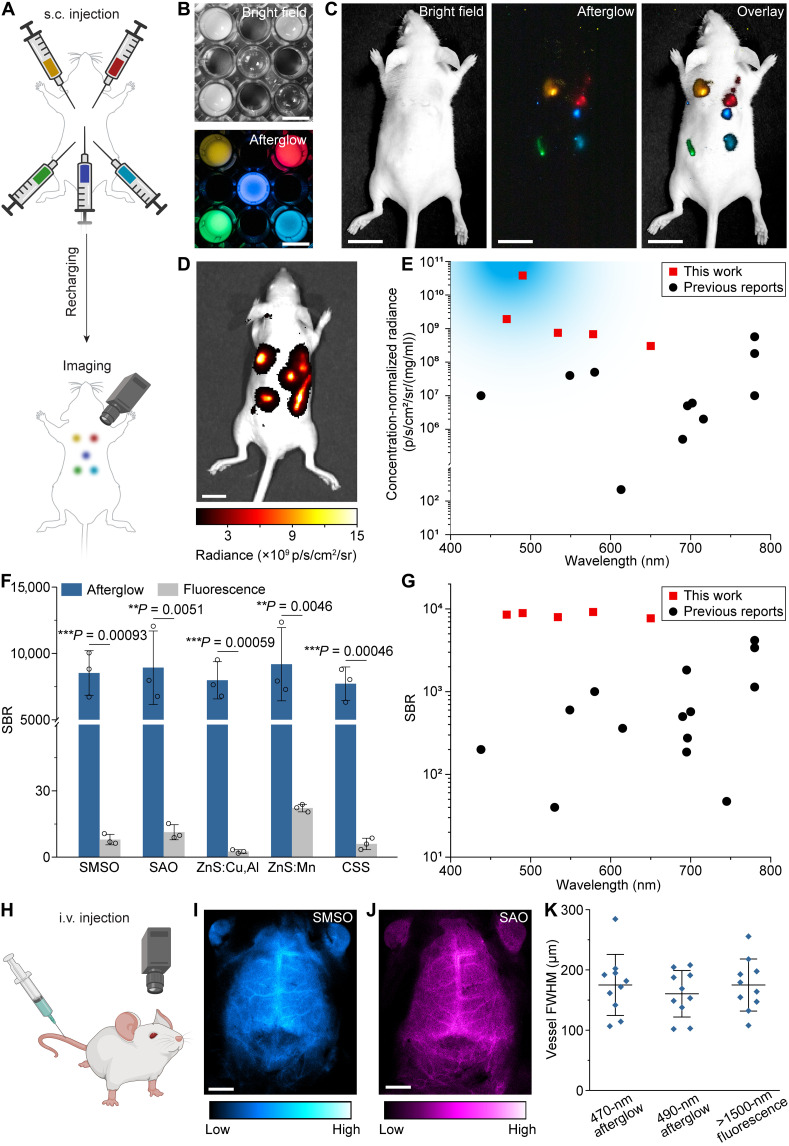
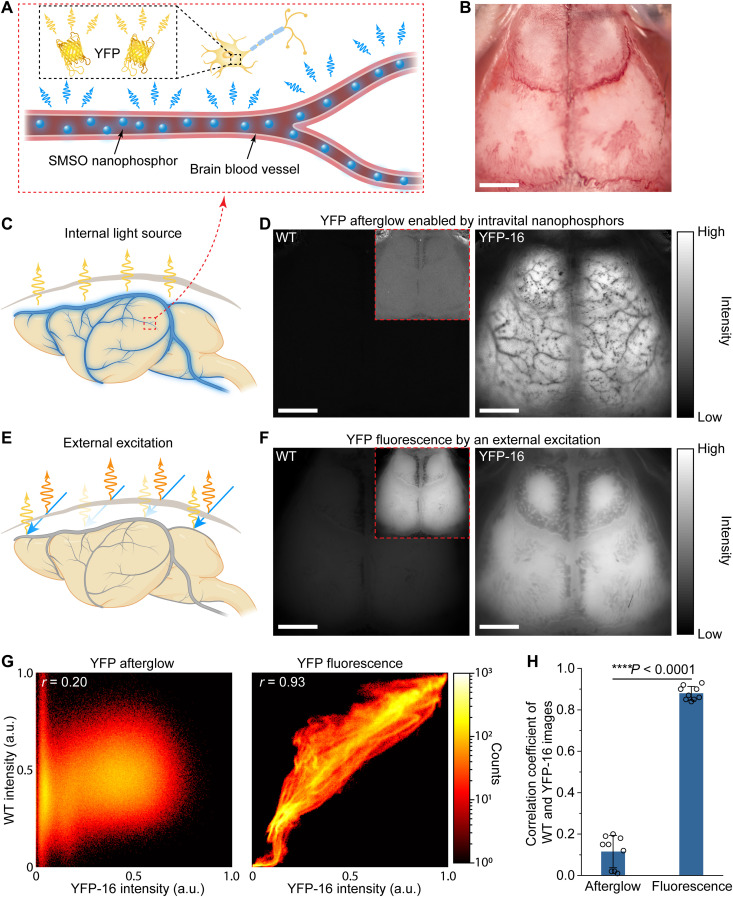
Many in vivo biological techniques, such as fluorescence imaging, photodynamic therapy, and optogenetics, require light delivery into biological tissues. The limited tissue penetration of visible light discourages the use of external light sources and calls for the development of light sources that can be delivered in vivo. A promising material for internal light delivery is persistent phosphors; however, there is a scarcity of materials with strong persistent luminescence of visible light in a stable colloid to facilitate systemic delivery in vivo. Here, we used a bioinspired demineralization (BID) strategy to synthesize stable colloidal solutions of solid-state phosphors in the range of 470 to 650 nm and diameters down to 20 nm. The exceptional brightness of BID-produced colloids enables their utility as multicolor luminescent tags in vivo with favorable biocompatibility. Because of their stable dispersion in water, BID-produced nanophosphors can be delivered systemically, acting as an intravascular colloidal light source to internally excite genetically encoded fluorescent reporters within the mouse brain.


Figures

Fig. 1.
Fig. 1.. BID approach for synthesizing colloidal SMSO solutions.
(A) Schematics showing the BID mechanism for dissolving tooth enamel (top) and sparingly soluble phosphors (bottom) into nanoparticles in an undersaturated solution. (B) SEM (i) and transmission electron microscope (TEM) (ii) images of the bulk SMSO phosphor and its colloidal nanoparticles, respectively. The inset in (ii) shows the high-resolution TEM image of an SMSO nanoparticle. A histogram showing the size distribution of SMSO colloids is shown in (iii). (C) Afterglow images and bright-field images (insets) of an aqueous suspension of bulk SMSO phosphor (i) and its stable colloidal solution of nanophosphors (ii). (D) X-ray diffraction (XRD) spectra of bulk SMSO phosphor and its colloidal nanoparticles. An average domain size of 52 nm was obtained by analyzing peak widths in the XRD spectrum of SMSO colloids with the Scherrer equation. a.u., arbitrary units. (E) SEM images of bulk SMSO particles after reaching a metastable equilibrium. (F) Plot showing the average instantaneous dissolution rate of SMSO particles as a function of their average inverse radius. The data are represented as mean values ± standard deviation (SD). (G) Plots of the titrant volume as a function of time for kinetically preserved dissolution of SMSO at different pH. (H) Plots of the flux rate (J) as a function of time for SMSO dissolution at different undersaturations. (I) Schematic showing the steps of an experimental procedure that verifies the BID mechanism. (J) Bright-field image (left), Tyndall effect (middle), and afterglow image (right) of colloidal solutions prepared under different conditions (see Materials and Methods).
Fig. 2.
Fig. 2.. Strong and persistent afterglow of BID-produced SMSO nanophosphor colloids.
(A) Excitation and emission spectra of untreated, bulk SMSO phosphor. (B) Excitation and emission spectra of a colloidal solution of SMSO nanophosphors. (C) Afterglow spectra of SMSO bulk phosphor and colloidal nanophosphor. (D) Afterglow curves of SMSO bulk phosphor and colloidal nanophosphor. (E) Afterglow image of a colloidal solution of SMSO nanophosphors (493 nM) in a 48-well plate acquired by the IVIS imaging system. Scale bar, 0.5 cm. (F) Afterglow images of colloidal solutions of SMSO nanophosphors in phosphate-buffered saline (PBS) (left), fetal bovine serum (FBS) (middle), and water (right) at day 1 (top) and day 14 (bottom). The decrease in afterglow intensity for FBS is due to the absorption of FBS at the emission wavelengths of SMSO colloids and does not reflect the instability of SMSO afterglow (fig. S10). (G) Chronic stability of normalized afterglow intensity of SMSO colloidal solutions in PBS, FBS, and water. All data are presented as mean values ± SD. DI, deionized.
Fig. 3.
Fig. 3.. Generalizability of the BID method.
(A) Afterglow images and their corresponding bright-field images (insets) of SAO (i), ZnS:Cu,Al (ii), ZnS:Mn (iii), and CSS (iv) bulk phosphors. (B) Afterglow images and their corresponding bright-field images (insets) of SAO (i), ZnS:Cu,Al (ii), ZnS:Mn (iii), and CSS (iv) nanophosphor colloids. (C) SEM images of SAO (i), ZnS:Cu,Al (ii), ZnS:Mn (iii), and CSS (iv) bulk phosphors. Scale bars, 50 μm. (D) TEM images of SAO (i), ZnS:Cu,Al (ii), ZnS:Mn (iii), and CSS (iv) nanophosphor colloids. Scale bars, 500 nm. (E) Histograms showing the size distributions of SAO (i), ZnS:Cu,Al (ii), ZnS:Mn (iii), and CSS (iv) nanophosphor colloids. Each histogram is based on 100 colloidal nanoparticles in the TEM images. (F) Afterglow spectra of SAO (i), ZnS:Cu,Al (ii), ZnS:Mn (iii), and CSS (iv) bulk phosphors (left) and colloidal nanophosphors (right). (G) Luminescence decay curves of SAO (i), ZnS:Cu,Al (ii), ZnS:Mn (iii), and CSS (iv) bulk phosphors (left) and colloidal nanophosphors (right).
Fig. 4.
Fig. 4.. BID-produced nanophosphor colloids are among the brightest afterglow materials after delivery in vivo.
(A) BID-produced colloids can be delivered via subcutaneous (s.c.) administration. (B) Bright-field (top) and afterglow (bottom) images of five colloidal solutions in a multiwell plate. (C) Bright-field (left), afterglow (middle), and overlay (right) images of subcutaneously administered colloidal solutions. (D) Afterglow image of subcutaneously injected colloids acquired using the IVIS imaging system. (E) Scatterplot of concentration-normalized afterglow radiance versus emission wavelength for subcutaneously injected colloids in this work and previous reports. The blue shade represents the desirable power density for activating SSFO and psCas9 in various biological applications. (F) Statistical analysis of the SBR for afterglow and fluorescence imaging with BID-produced nanophosphor colloids. All data are presented as mean values ± SD. n = 3 for all groups. **P < 0.01; ***P < 0.001. (G) Scatterplot of the SBR versus emission wavelength for subcutaneously injected colloidal solutions of nanophosphors in this work and previous reports. (H) BID-produced colloidal solutions of nanophosphors can be delivered via intravenous (i.v.) administration for brain imaging. (I and J) Transcranial afterglow images of brain vascular structures after intravenous injection of SMSO (I) and SAO (J) colloidal solutions. (K) Full width at half maximum (FWHM) of the smallest discernible cerebral vessels in afterglow images of this work and an NIR-II (>1500 nm) fluorescence image in (50) under the same level of magnification. Scale bars, 1 cm (B and D), 1.5 cm (C), and 2.5 mm (I and J).
Fig. 5.
Fig. 5.. BID-produced colloids as an intravital light source for YFP imaging.
(A) Schematic showing SMSO colloids in blood vessels as an internal light source for exciting YFP fluorescence in situ. (B) Photo of the mouse head with the intact skull, which is dominated by the intrinsic skull features. (C and E) Schematic of brain fluorescence imaging with an internal light source (C) or a conventional external light source (E). The blue glow represents the internal excitation light. The blue, yellow, and orange arrows represent external excitation light, YFP fluorescence, and skull autofluorescence, respectively. The fluorescence image excited by a conventional external light source (E) is contaminated by skull features because of spatially varying skull attenuation and autofluorescence. (D and F) YFP afterglow (D) or fluorescence (F) images of the wild-type (WT) (left) and YFP-16 (right) mouse brains excited by the intravenously delivered colloidal light source (D) or an external light source (F). The insets in the left panels are WT images with digitally enhanced brightness to match YFP-16 images. All images in (B), (D), and (F) were taken with the intact skull. Scale bars, 2 mm. (G) Intensity scatterplot of the WT and YFP-16 images under the afterglow (left) or fluorescence (right) modes. The Pearson’s correlation coefficient r is provided on the image. (H) Statistical analysis of Pearson’s correlation coefficients (indicating similarity) between the WT and YFP-16 images under the afterglow or fluorescence modes. All data are presented as mean values ± SD. ****P < 0.0001.

Similar articles

Cited by

References

    1. Hong G., Antaris A. L., Dai H., Near-infrared fluorophores for biomedical imaging. Nat. Biomed. Eng. 1, 0010 (2017).
    1. Fenno L., Yizhar O., Deisseroth K., The development and application of optogenetics. Annu. Rev. Neurosci. 34, 389–412 (2011). - PMC - PubMed
    1. Nihongaki Y., Kawano F., Nakajima T., Sato M., Photoactivatable CRISPR-Cas9 for optogenetic genome editing. Nat. Biotechnol. 33, 755–760 (2015). - PubMed
    1. Huang Z., Wu Y., Allen M. E., Pan Y., Kyriakakis P., Lu S., Chang Y.-J., Wang X., Chien S., Wang Y., Engineering light-controllable CAR T cells for cancer immunotherapy. Sci. Adv. 6, eaay9209 (2020). - PMC - PubMed
    1. Yun S. H., Kwok S. J. J., Light in diagnosis, therapy and surgery. Nat. Biomed. Eng. 1, 0008 (2017). - PMC - PubMed