. 2022 Jul 29;7(73):eabm6931.
doi: 10.1126/sciimmunol.abm6931. Epub 2022 Jul 29.

Epithelial HVEM maintains intraepithelial T cell survival and contributes to host protection

Affiliations

Epithelial HVEM maintains intraepithelial T cell survival and contributes to host protection

Goo-Young Seo et al. Sci Immunol. .

Abstract

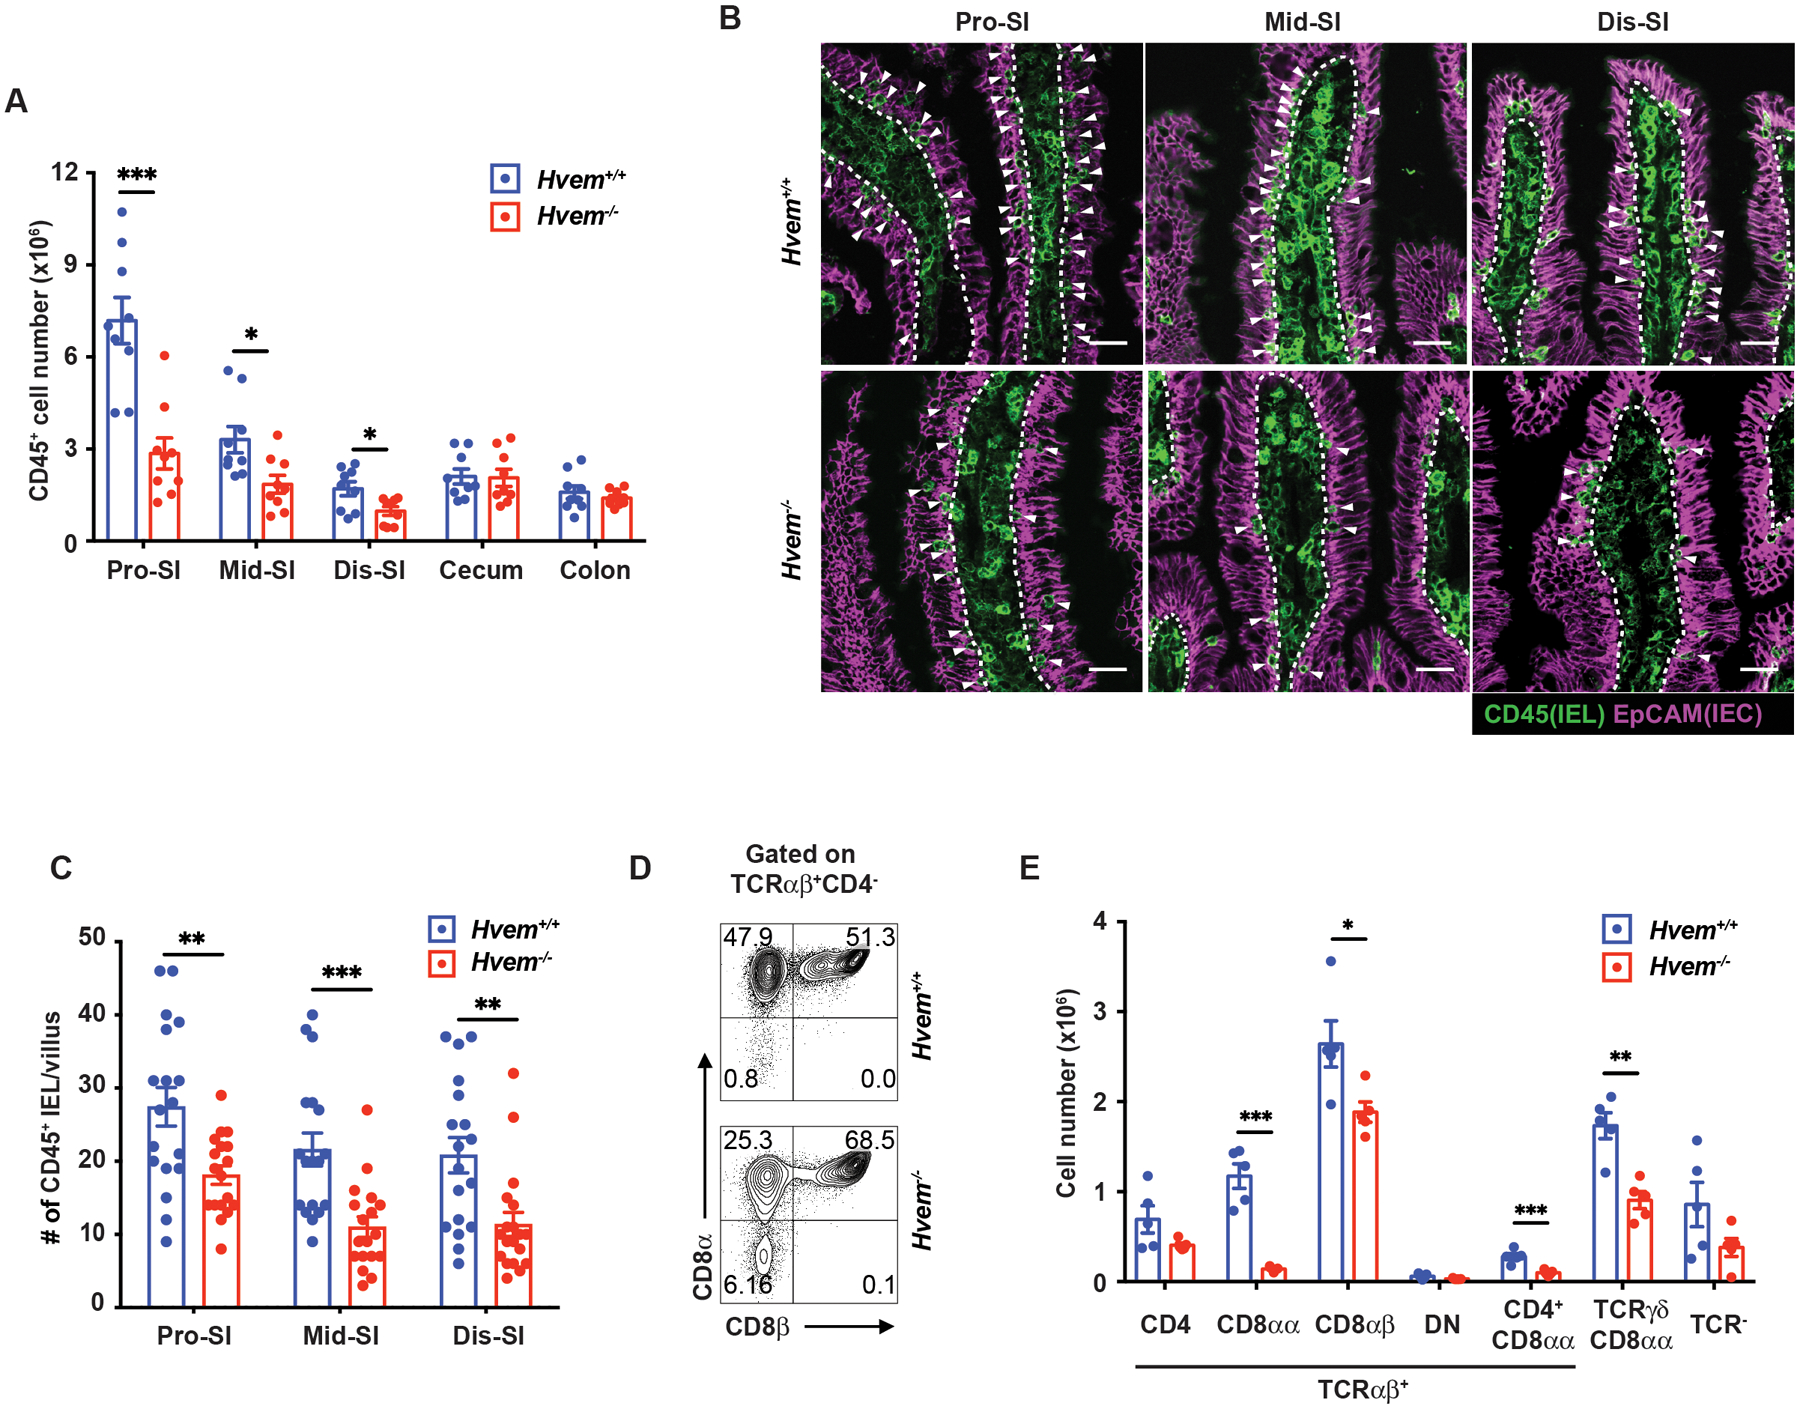
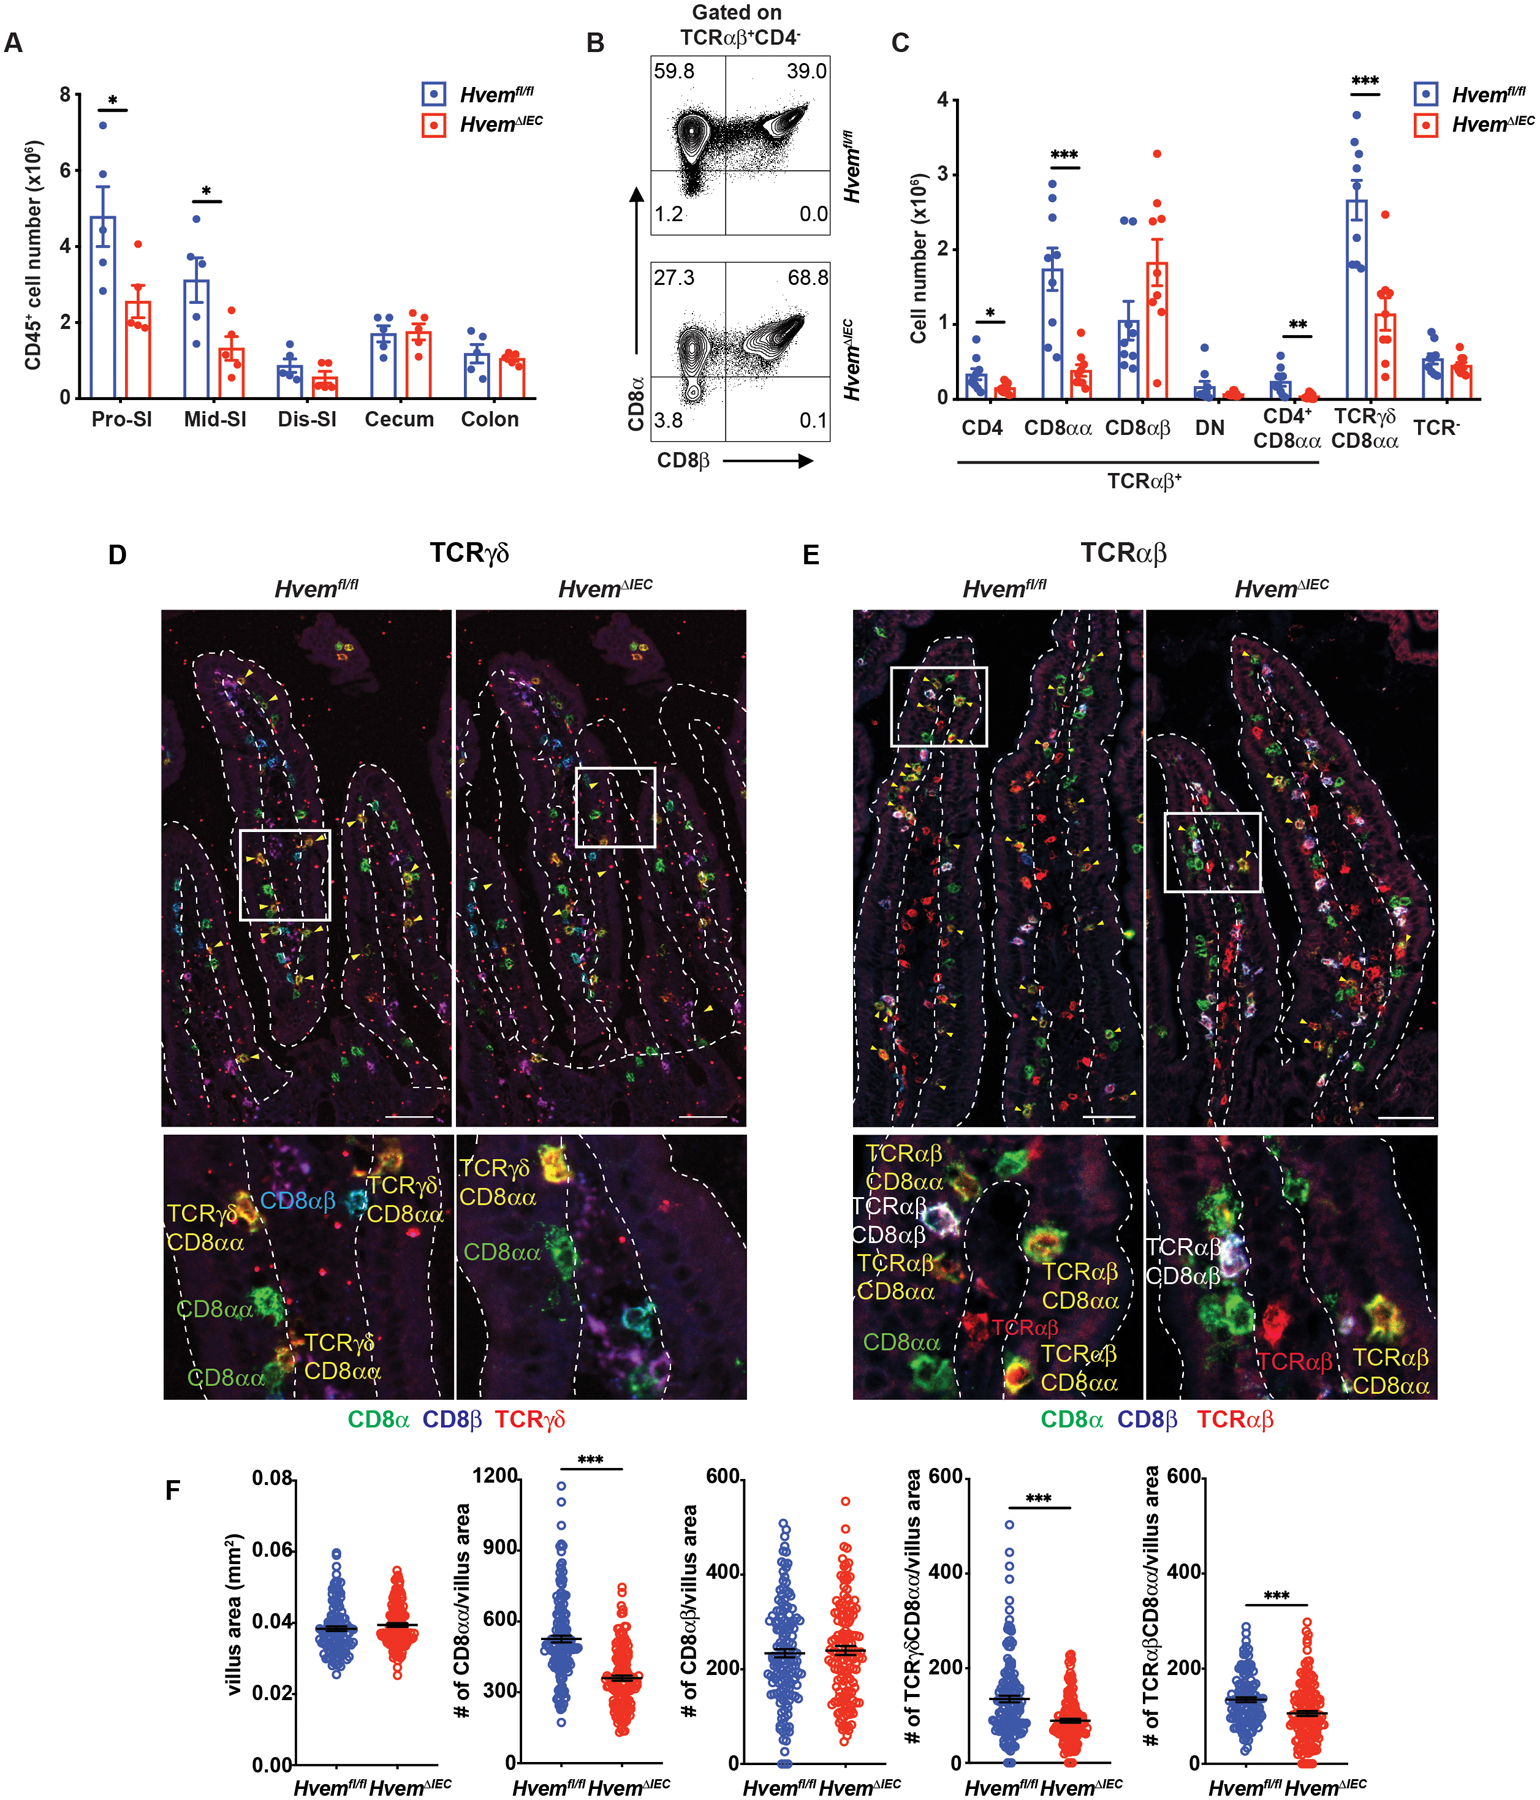
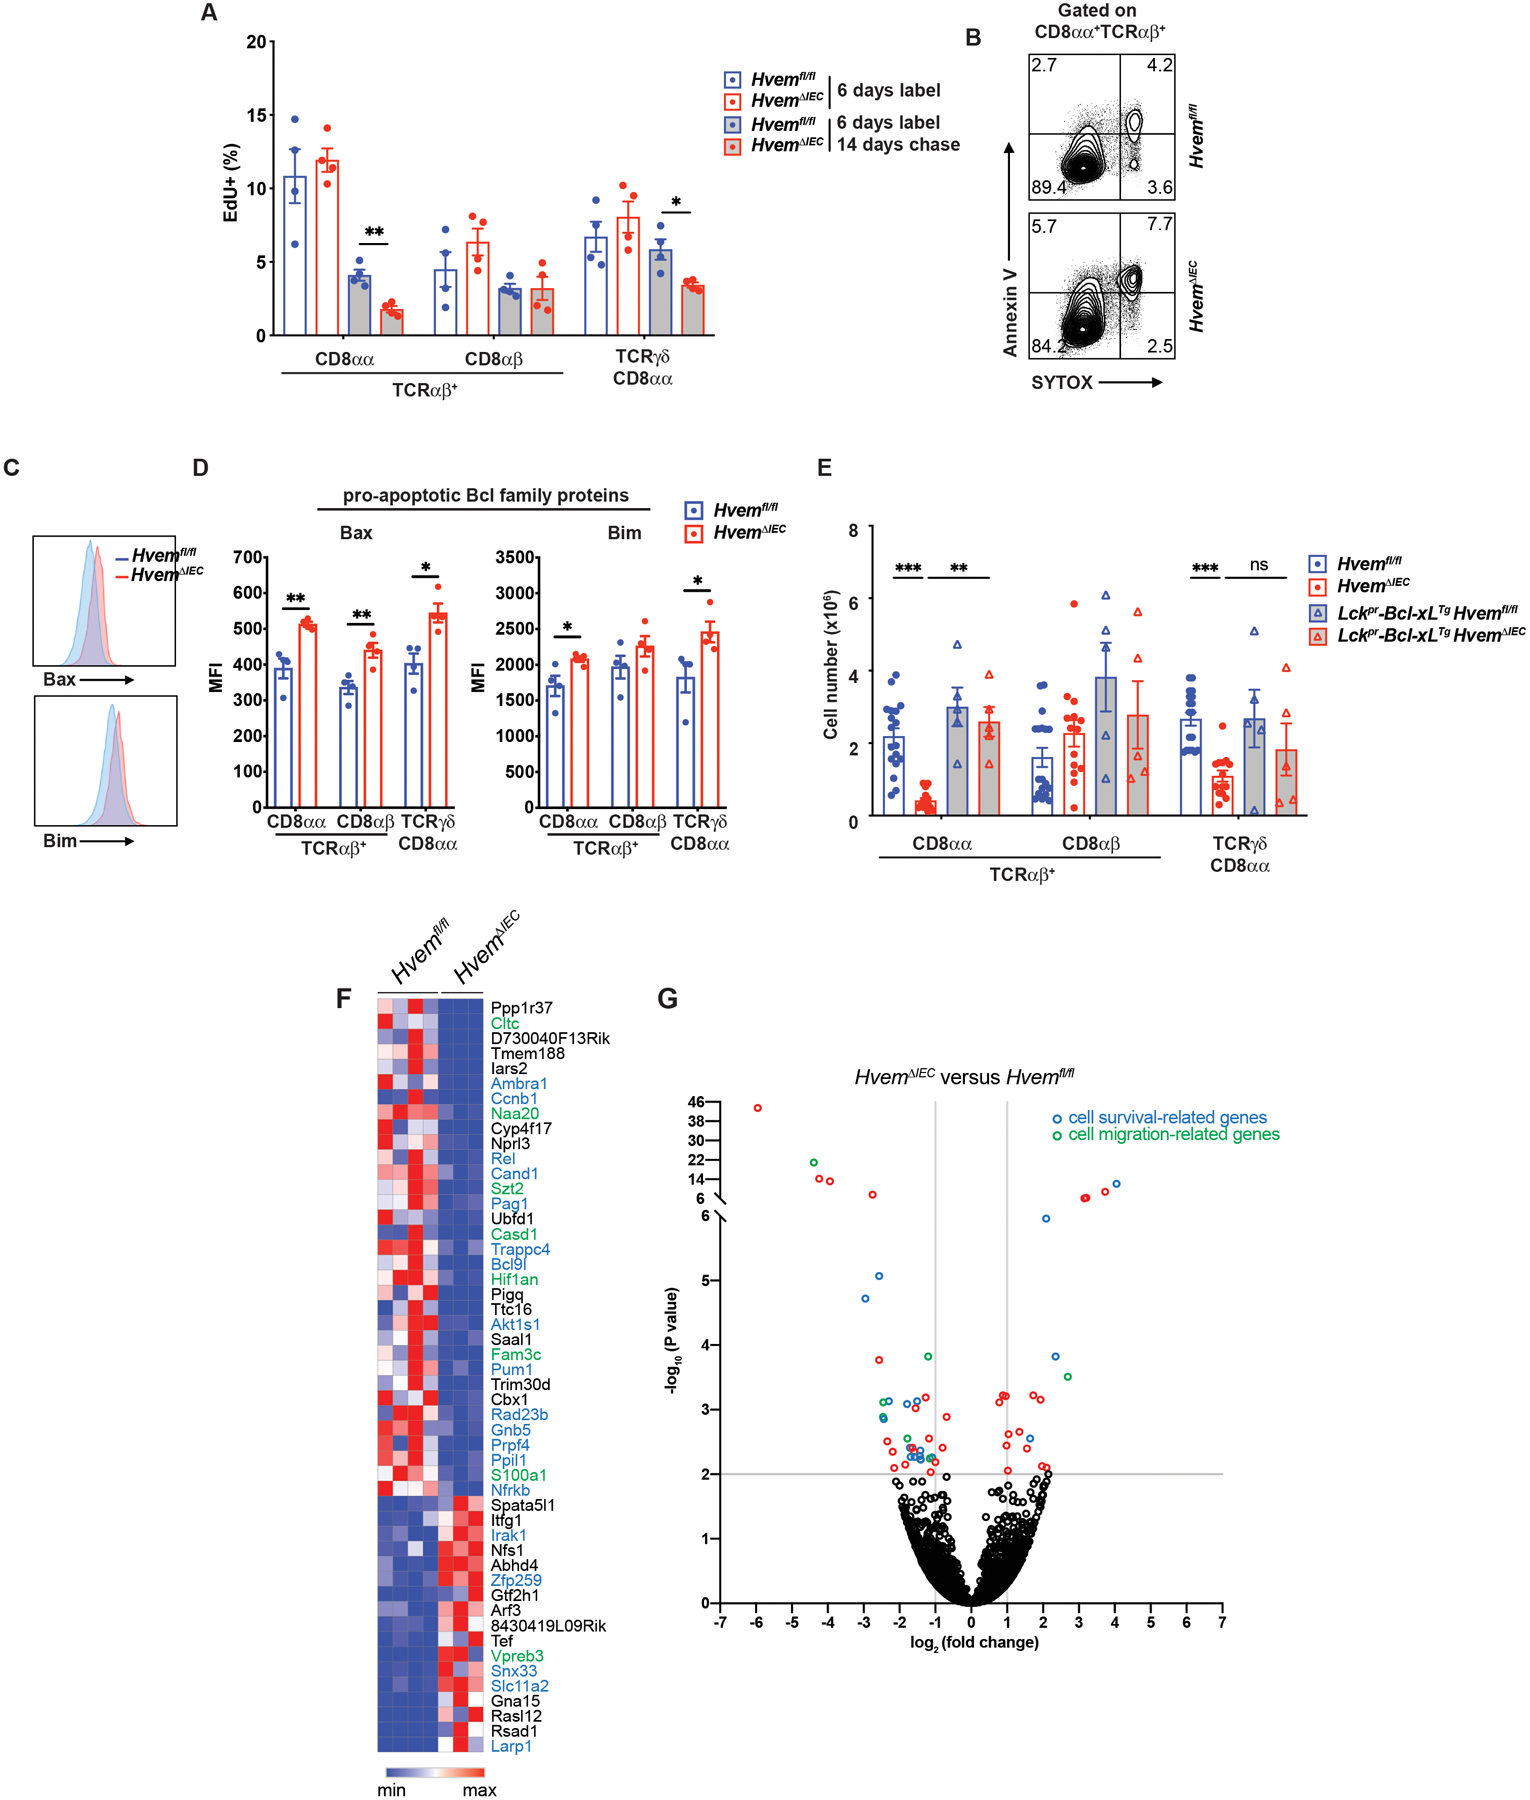
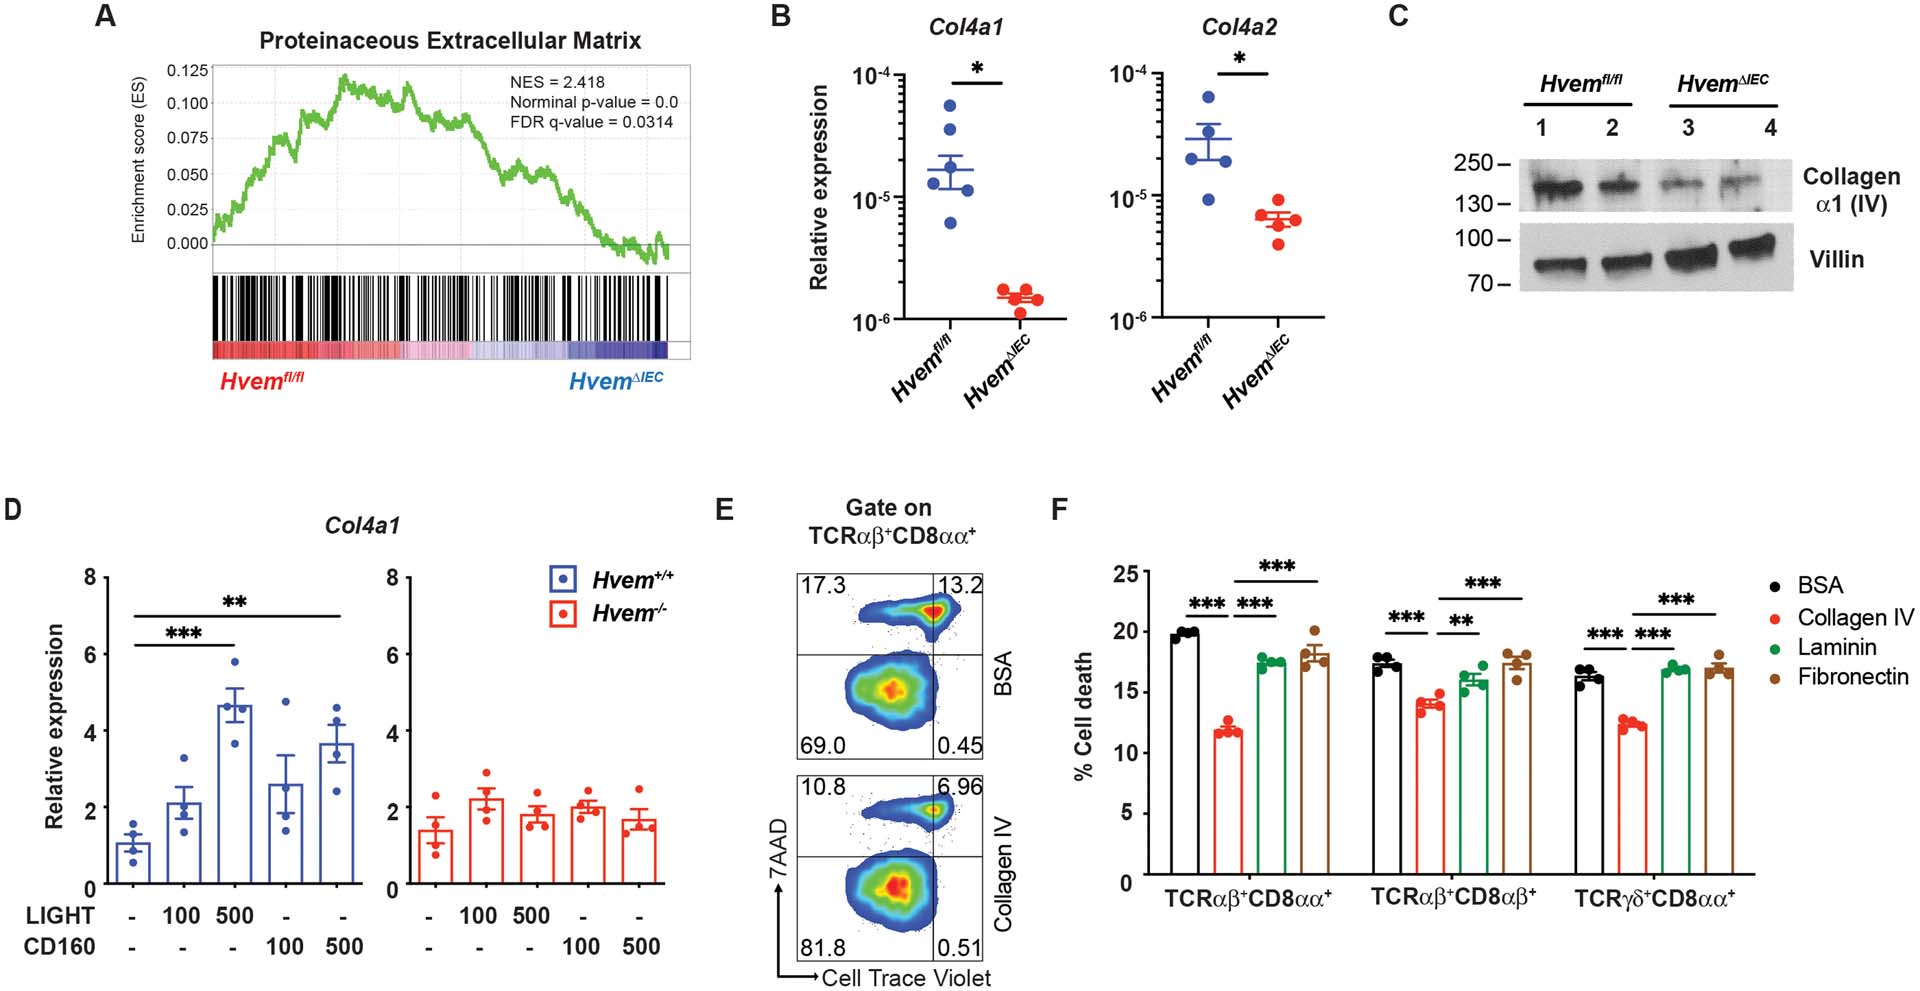
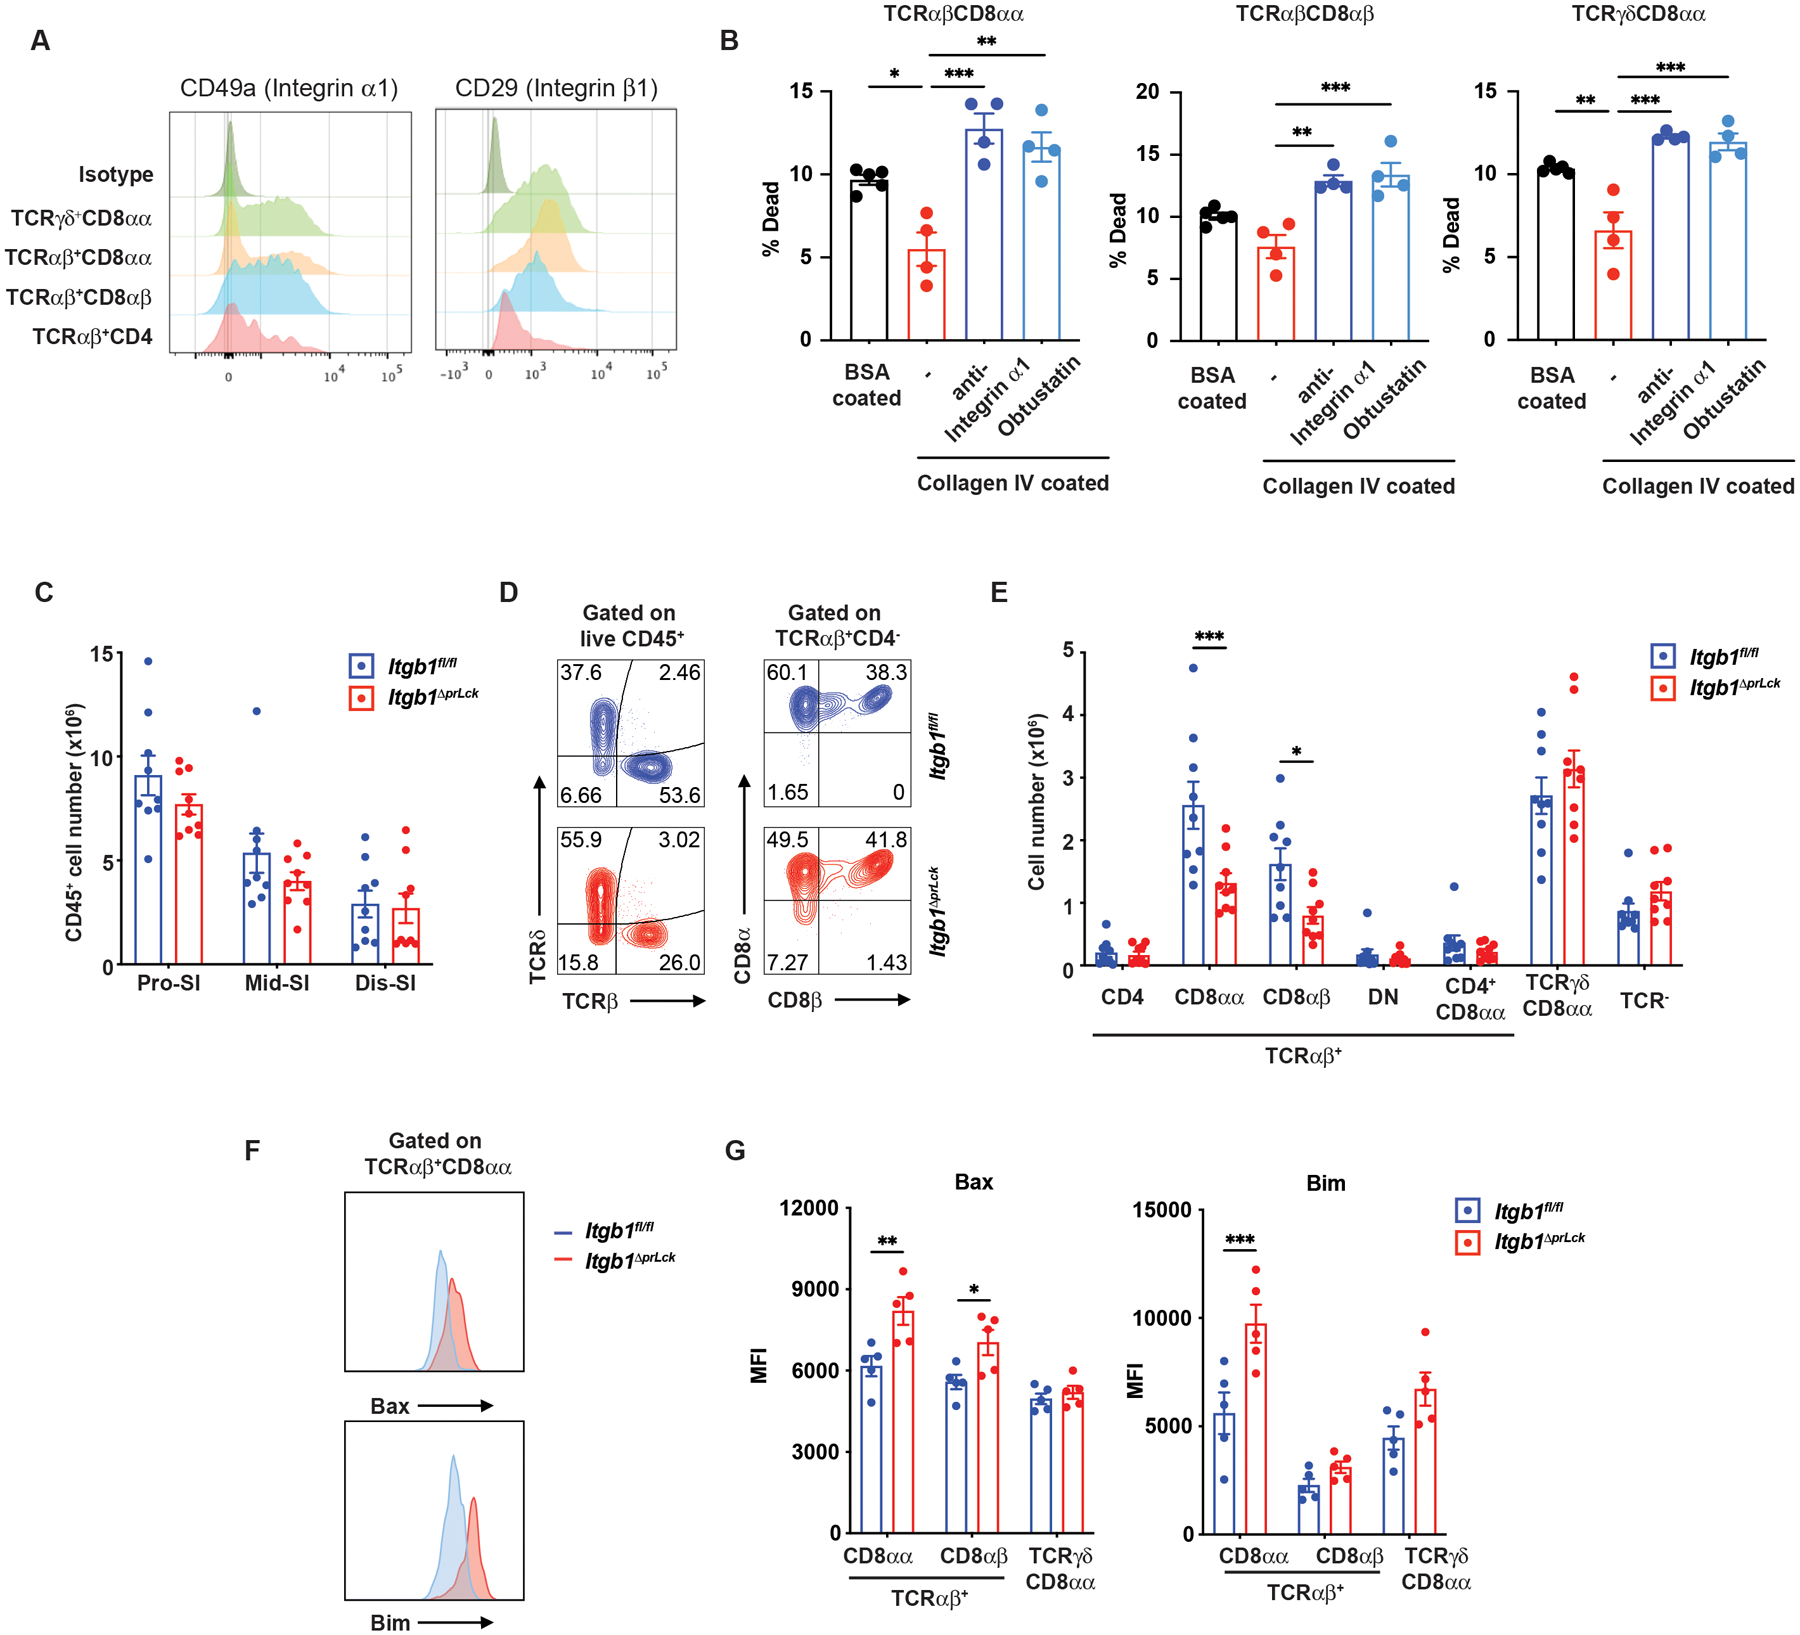
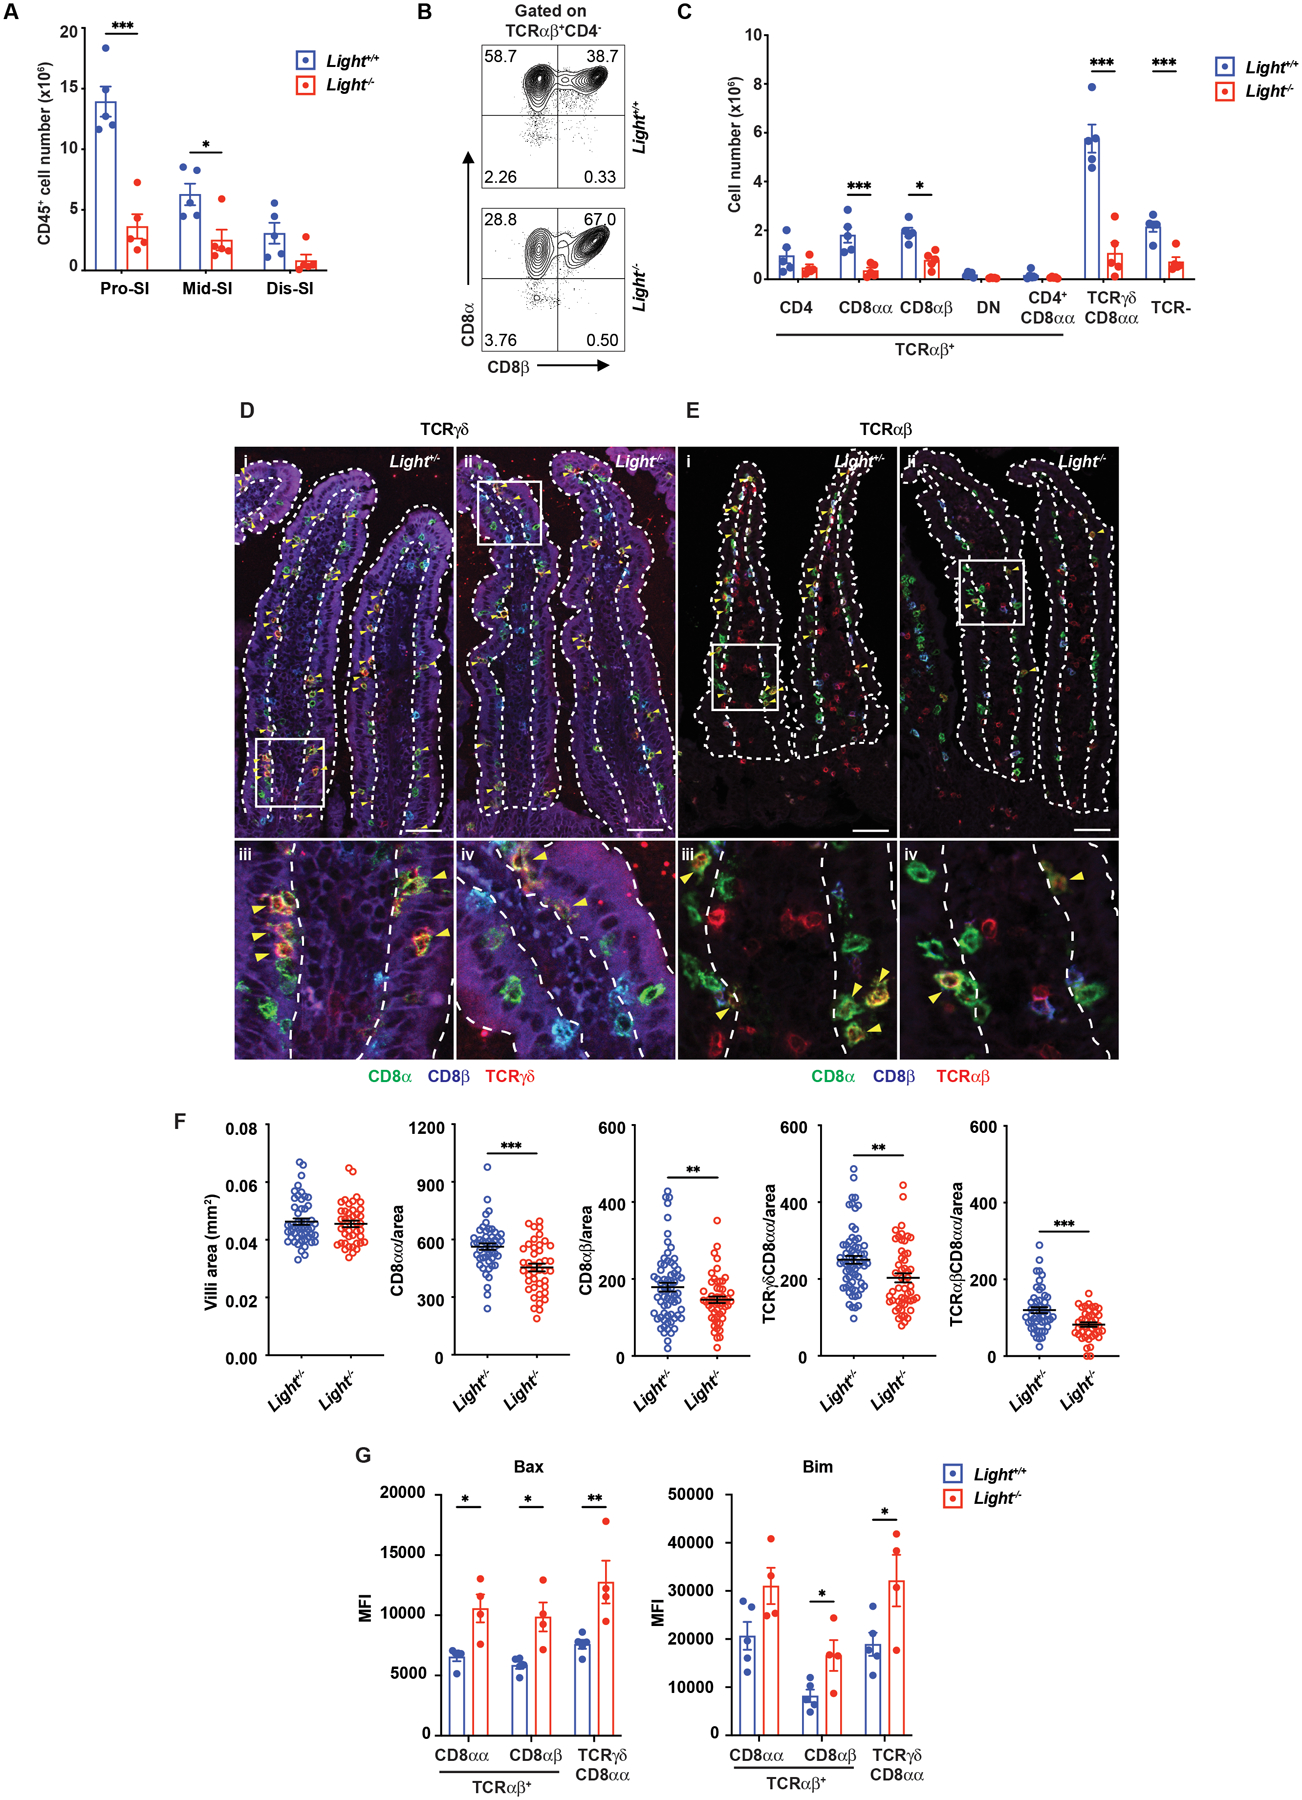
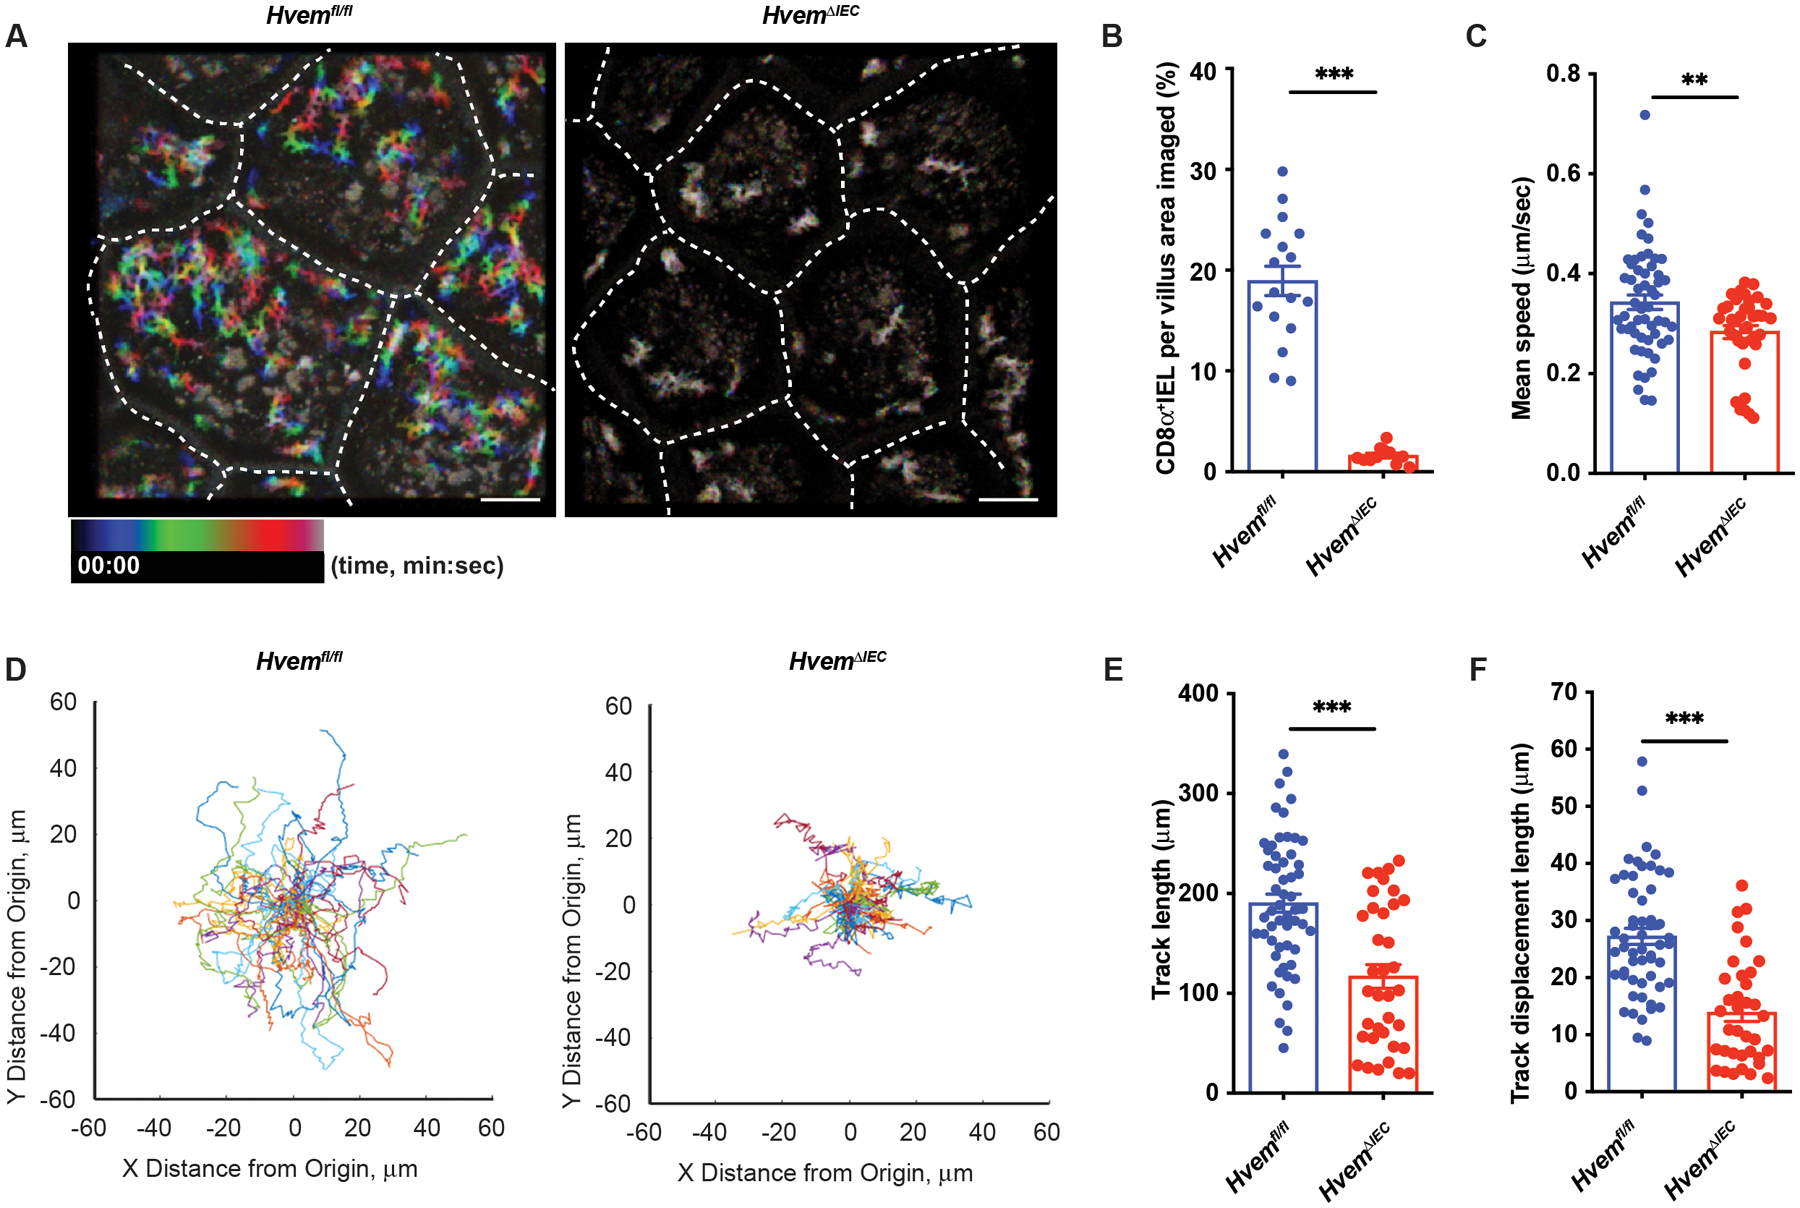
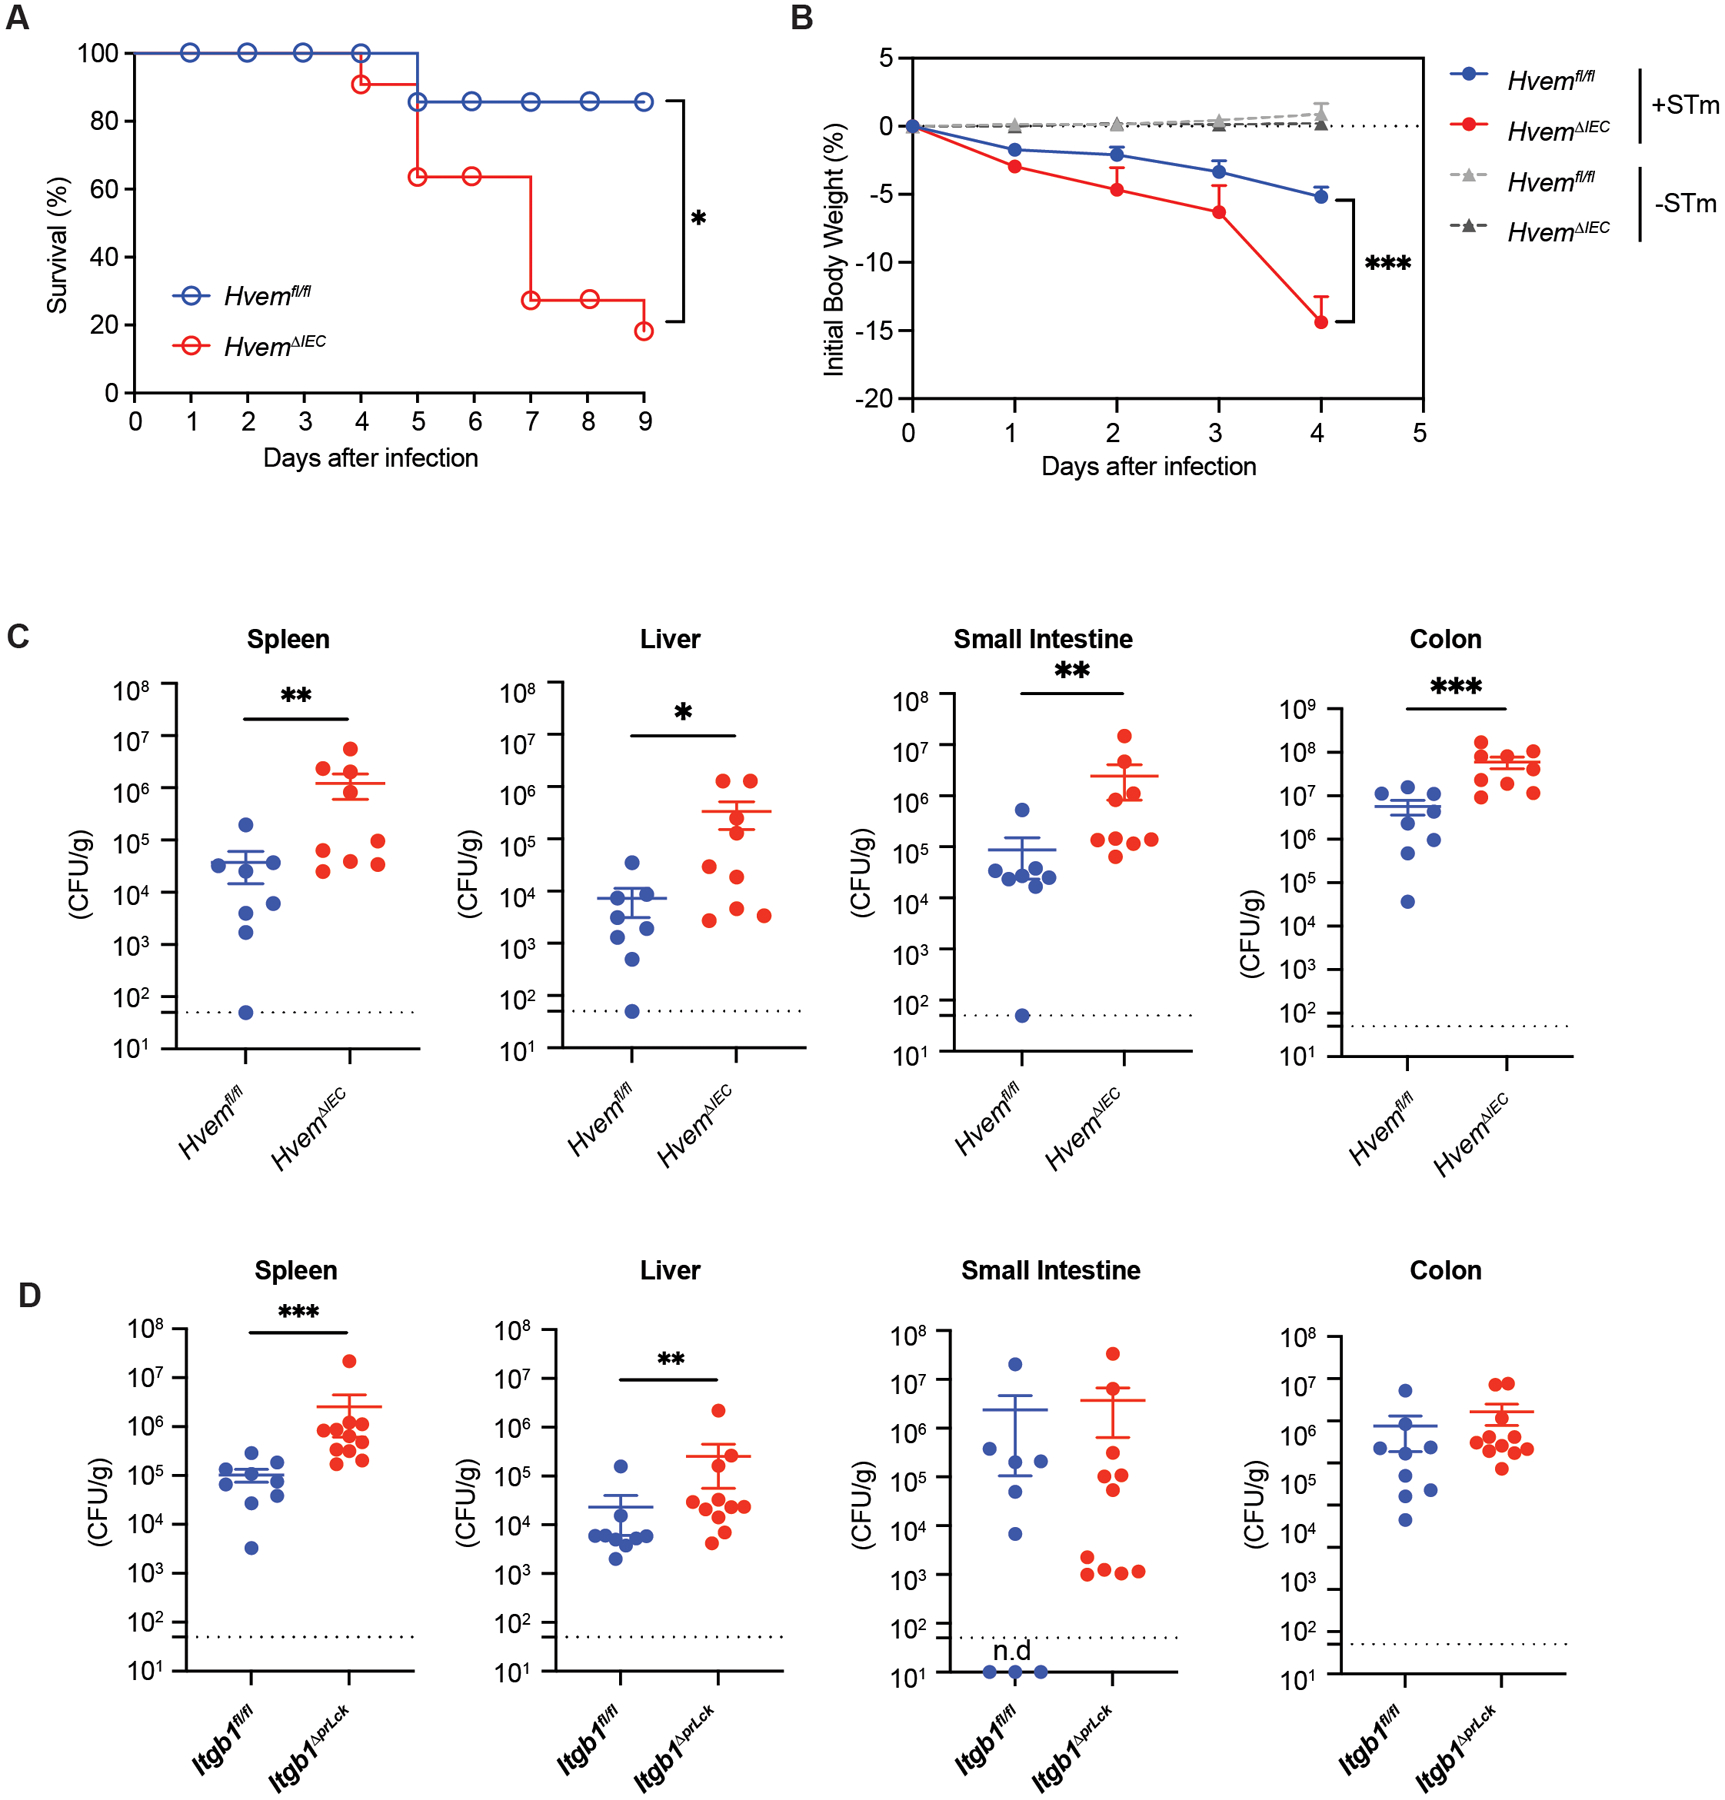
Intraepithelial T cells (IETs) are in close contact with intestinal epithelial cells and the underlying basement membrane, and they detect invasive pathogens. How intestinal epithelial cells and basement membrane influence IET survival and function, at steady state or after infection, is unclear. The herpes virus entry mediator (HVEM), a member of the TNF receptor superfamily, is constitutively expressed by intestinal epithelial cells and is important for protection from pathogenic bacteria. Here, we showed that at steady-state LIGHT, an HVEM ligand, binding to epithelial HVEM promoted the survival of small intestine IETs. RNA-seq and addition of HVEM ligands to epithelial organoids indicated that HVEM increased epithelial synthesis of basement membrane proteins, including collagen IV, which bound to β1 integrins expressed by IETs. Therefore, we proposed that IET survival depended on β1 integrin binding to collagen IV and showed that β1 integrin-collagen IV interactions supported IET survival in vitro. Moreover, the absence of β1 integrin expression by T lymphocytes decreased TCR αβ+ IETs in vivo. Intravital microscopy showed that the patrolling movement of IETs was reduced without epithelial HVEM. As likely consequences of decreased number and movement, protective responses to Salmonella enterica were reduced in mice lacking either epithelial HVEM, HVEM ligands, or β1 integrins. Therefore, IETs, at steady state and after infection, depended on HVEM expressed by epithelial cells for the synthesis of collagen IV by epithelial cells. Collagen IV engaged β1 integrins on IETs that were important for their maintenance and for their protective function in mucosal immunity.


Conflict of interest statement

Competing interests: MK and TFC have filed a patent on uses of HVEM with selective binding to ligands.

Figures

Fig. 1.
Fig. 1.. HVEM is important for maintaining IET.
(A) Total IEL numbers by flow cytometry in proximal SI (Pro-SI), middle SI (Mid-SI), distal SI (Dis-SI), cecum and colon from Hvem+/+ (n=9) and Hvem−/− (n=9) mice. (B) Representative immunofluorescence staining of CD45+ cells from the SI in Hvem+/+ and Hvem−/− mice. White arrowheads indicate CD45+ intraepithelial cells (IEL) in the epithelium. Dashed white lines indicate the interface between the epithelium and lamina propria. Scale bars, 25μm. (C) Quantification of CD45+ IEL in villi from Hvem+/+ (n=4) and Hvem−/− (n=4) mice. (D) Representative plots of TCRαβ+CD8αα+ and TCRαβ+CD8αβ+ IET in TCRαβ+ IET from proximal SI in Hvem+/+ and Hvem−/− mice. (E) Absolute numbers of the indicated subsets in total IEL from proximal SI in Hvem+/+ (n=5) and Hvem−/− (n=5) mice. Statistical analysis was performed using an unpaired t-test (A, C, E). Statistical significance is indicated by *, p < 0.05; **, p < 0.01; ***, p < 0.001. Data in A, C, and E show means ± SEM. In A and E, each symbol represents a measurement from a single mouse. In C, each symbol represents cell numbers of CD45+ IEL per a boundary approximating a villus. Data represent pooled results from at least two independent experiments with at least four mice per group in each experiment (A), compiled from four independent experiments (B, C) or representative results from one of at least two independent experiments with at least four mice in each experimental group (E). Groups of co-housed mice were analyzed.
Fig. 2.
Fig. 2.. Epithelial HVEM maintains IETs.
(A) Total IEL numbers in portions of the intestine from Hvemfl/fl (n=5) and HvemΔIEC (n=5) mice. (B) Representative plots of TCRαβ+CD8αα+ and TCRαβ+CD8αβ+ in TCRαβ IET from proximal SI in Hvemfl/fl and HvemΔIEC mice. (C) Absolute numbers of indicated IET subsets in total IEL from proximal SI in Hvemfl/fl (n=9) and HvemΔIEC (n=9) mice. (D-E) Representative immunofluorescence staining of TCRγδ IET (D) and TCRαβ IET (E) from proximal SI in Hvemfl/fl and HvemΔIEC mice. Composite images in which the three channels were merged. Composite images depict expression of CD8α (green), CD8β (blue), and TCRδ (red, D) or TCRβ (red, E). Yellow arrowheads highlight TCRγδ+CD8αα+ (D) and TCRαβ+CD8αβ+ IET (E). Single-channel images are in Figure S3. Dashed white lines indicate the boundaries of the epithelium, approximately one villus in each case, used for the quantitation. Scale bars, 50μm. Two independent experiments were carried out yielding similar results. (F) Quantification of TCRγδ+CD8αα+ and TCRαβ+CD8αβ+ per mm2 from proximal SI in Hvemfl/fl (n=6) and HvemΔIEC (n=7) mice. Statistical analysis was performed using unpaired t-test (A, C, F). *, p < 0.05; **, p < 0.01; ***, p < 0.001. Data in A, C, and F show means ± SEM. In A and C, each symbol represents a measurement from a single mouse. In F, each symbol represents a calculation to give the number per mm2. Data are representative results from one of at least two independent experiments with at least four mice in each experimental group (A) or pooled results from at least two independent experiments with at least four mice per group in each experiment (C, F). Groups of co-housed littermates were analyzed.
Fig. 3.
Fig. 3.. Epithelial HVEM affects CD8αα+ IET survival.
(A) Frequencies of EdU + cells from proximal SI IET of Hvemfl/fl (n=4) and HvemΔIEC (n=4) mice. Mice were administered EdU once per day for 6 days. Cells were isolated from proximal SI and EdU+ cells were measured at either day 6 or day 20. (B) Representative flow cytometry images detecting apoptotic cells in TCRαβ+CD8αα+ IET from proximal SI in Hvemfl/fl and HvemΔIEC mice. (C, D) Representative flow cytometry showing expression of pro-apoptotic Bcl family proteins (Bax and Bim) on TCRαβ+CD8αα+ IET from proximal SI of Hvemfl/fl (n=4) and HvemΔIEC (n=4) mice (C) and compiled MFI from multiple individual mice (D). (E) Absolute cell number of TCRαβ+CD8αα+, TCRαβ+CD8αβ+, and TCRγδ+CD8αα+ IET subsets from Hvemfl/fl (n=18), HvemΔIEC (n=14), Lckpr-Bcl-xLTgHvemfl/fl (n=5) and Lckpr-Bcl-xLTgHvemΔIEC (n=5) mice. Statistical analysis was performed using an unpaired t-test (A, D) or 2 way ANOVA with Bonferroni’s multiple comparison test (E). Statistical significance is indicated by *, p < 0.05; **, p < 0.01; ***, p < 0.001. Data in A and C show means ± SEM. In A, D and E, each symbol represents a measurement from a single mouse. Data are representative results of one of at least two independent experiments with at least four mice in each experimental group. (F) Sorted TCRαβ+CD8αα+ IET from SI of Hvemfl/fl and HvemΔIEC mice were analyzed by RNA-seq. The top 50 most differentially expressed genes with respect to P-value. (G) Volcano plots showing mean log2-transformed fold change (x axis) and significance (−log10 (adjusted P value)) of differentially expressed genes between the TCRαβ+CD8αα+ IET from the SI of Hvemfl/fl and HvemΔIEC mice. In F and G, genes in blue font or blue symbol are associated with cell survival or proliferation and those designated with green are associated with cell migration. Groups of co-housed littermates (A-D) or cohoused mice (E) were analyzed.
Fig. 4.
Fig. 4.. HVEM signaling contributes to induction of basement membrane synthesis.
(A) Gene set enrichment analysis (GSEA) of transcripts from isolated IEC (CD31CD45EpCAM+) showing downregulation of GO Proteinaceous Extracellular Matrix genes in HvemΔIEC mice. (B) Gene expression of Col4a1 and Col4a2 mRNA in IEC from Hvemfl/fl (n=5) and HvemΔIEC mice (n=5) by q-PCR. Data are normalized to the Actb housekeeping gene. (C) Expression of collagen α1 (IV) in sorted IEC from Hvemfl/fl and HvemΔIEC mice by Western blot. The expression level of villin is used as a control for the amount of protein lysates loaded. (D) Gene expression of Col4a1 mRNA determined by q-PCR in cells from intestinal organoid cultures from proximal SI of Hvemfl/fl (n=5) and HvemΔIEC mice (n=5). Isolated crypts from Hvem+/+ and Hvem−/− mice were cultured with growth factors in the presence or absence of HVEM ligands, indicated concentrations in ng/ml, for 7 days. Data are normalized to Rpl32 as the housekeeping gene. (E-F) Isolated SI IET subsets (CD4 from wild type mice were labeled with CellTrace Violet (CTV) and cultured on plates coated with the indicated mouse basement proteins or BSA control (n=4 per group). After 3 days, cells were stained with antibodies and 7AAD for monitoring cell death by flow cytometry. Representative plots (E) and calculated of % cell death (F) in IET subsets. Statistical analysis was performed using an unpaired t-test (B) or 2 way ANOVA with Bonferroni’s multiple comparison test (D, F). Statistical significance is indicated by *, p < 0.05; **, p < 0.01; ***, p < 0.001. Data in B, D, and F show means ± SEM. Each symbol represents a measurement from a single mouse (B), single organoid culture (D) or an individual well (E, F). Data are representative results from one of at least two independent experiments. Groups of co-housed littermates were analyzed.
Fig. 5.
Fig. 5.. Collagen-binding integrins influence IET survival and host defense.
(A) Expression of integrin α1 and β1 subunits by IET populations from proximal SI of wild type mice by flow cytometry. (B) Isolated IET subsets from SI of wild type mice labeled with CellTrace Violet (CTV) and cultured on plates coated with BSA control (n=5) or collagen IV in the presence or absence of anti-integrin α1 mAb or inhibitor Obtusatin (n=4 per group). After 3 days, cells were monitored for viability by flow cytometry as described in Materials and Methods. (C) Total IEL numbers in segments of SI from Itgb1fl/fl (n=9) and Itgb1ΔprLck (n=9) mice. (D) Representative plots of TCRαβ+ and TCRγδ+ among CD45+ IEL (left) and TCRαβ+CD8αα+ and TCRαβ+CD8αβ+ among TCRαβ IET (right) from proximal SI in Itgb1fl/fl and Itgb1ΔprLck mice. (E) Absolute numbers of indicated subsets in total IEL from proximal SI in Itgb1fl/fl (n=9) and Itgb1ΔprLck (n=9) mice. (F, G) Representative flow cytometry shows expression of pro-apoptotic Bcl family proteins (Bax and Bim) on TCRαβ+CD8αα+ IET from proximal SI of Itgb1fl/fl (n=5) and Itgb1ΔprLck (n=5) mice (F). The MFI on CD8α+ IET from multiple individual mice was measured by flow cytometry (G). Statistical analysis was performed using 2 way ANOVA with Bonferroni’s multiple comparison test (B) or unpaired t-test (C, E, G). Statistical significance is indicated by *, p < 0.05; **, p < 0.01; ***, p < 0.001. Data show means ± SEM. Each symbol represents a measurement from an individual well (B) or a single mouse (C, E, G). Data represent representative results from one of at least two independent experiments (B, G) or pooled results from at least two independent experiments (C, E). Groups of co-housed littermates were analyzed.
Fig 6.
Fig 6.. LIGHT is required for IET homeostasis.
(A) Total IEL numbers in portions of the intestine from Light+/+ (n=5) and Light−/− (n=5) mice. (B) Representative plots of TCRαβ+CD8αα+ and TCRαβ+CD8αβ+ in TCRαβ IET from proximal SI in Light+/+ and Light−/− mice. (C) Absolute numbers of indicated IET subsets in total IEL from proximal SI in Light+/+ (n=5) and Light−/− (n=5) mice. (D-E) Representative immunofluorescence staining of TCRγδ IET (D) and TCRαβ IET (E) from proximal SI in Light+/+ and Light−/− mice. Composite images in which the three channels were merged. Composite images depict expression of CD8α (green), CD8β (blue), and TCRδ (red, D) or TCRβ (red, E). Yellow arrowheads highlight TCRγδ+CD8αα+ (D) and TCRαβ+CD8αβ+ IET (E). Dashed white lines indicate the boundaries of the epithelium, approximately one villus in each case, used for the quantitation. Scale bars, 50μm. Two independent experiments were carried out yielding similar results. (F) Quantification of TCRγδ+CD8αα+ and TCRαβ+CD8αβ+ per mm2 from proximal SI in Light+/+ (n=5) and Light−/− (n=4) mice. (G) The MFI of Bax and Bim expression on CD8α+ IET from Light−/− (n=5) and Light+/+ (n=4) mice. Statistical analysis was performed using unpaired t-test (A, C, F, G). Statistical significance is indicated by *, p < 0.05; **, p < 0.01; ***, p < 0.001. Data show means ± SEM. In A, C and G, each symbol represents a measurement from a single mouse. In F, each symbol represents a calculation to give the number per mm2. Data are representative results from one of at least two independent experiments with at least four mice in each experimental group (A, C, G) or pooled results from at least two independent experiments with at least four mice per group in each experiment (F). (A-G) Groups of co-housed littermates were analyzed.
Fig. 7.
Fig. 7.. Epithelial HVEM influences patrolling by CD8α+ IET.
Mice were injected with anti-CD8α before imaging of the epithelium by taking Z-stacks encompassing the epithelium and the upper layers of the lamina propria at a 2.8 μm step size every 10 sec. Each XY plane spans 365 × 365 μm2. Fiji was used to calculate the coverage area and generate representative images. Movement metrics (mean speed, track length, track displacement length, and paths) for each CD8α+ lymphocyte were calculated with Imaris. (A) Rainbow plot time projection reveals the area covered by CD8α+ IET during 10 min, starting from time 0 (00:00) to 10 mins (10:00). Rainbow color shows the tracks of moving CD8α+ IET. Blue denotes starting position at the beginning of the recording it goes to green and then red, denotes ending position, as the time elapses. If the cell does not move, the superposition of colors blends to give a color closer to white. Scale bars, 50μm. (B-C) Quantification of the fraction of villus area covered by CD8α+ cells (B), mean speed (C) in a 10 min recording (Hvemfl/fl, n=3; HvemΔIEC, n=3). (D) Spider plots of tracks show the migratory path of each CD8+ IEL in the 10 min recording. Each cell path was translated to begin at (0,0) and randomly colored. (E-F) Quantification of track length (E), and the displacement between beginning and ending positions (F) in a 10 min recording (Hvemfl/fl, n=3; HvemΔIEC, n=3). Statistical analysis was performed using unpaired t-test (B-C, E-F). Statistical significance is indicated by *, p < 0.05; ***, p < 0.001. In B-C and E-F, bars show the mean and each symbol represents a measurement from a single cell. Dashed white lines (A) indicate the boundaries of each quantified villus. Data represent combined results of two independent experiments with at least three mice in each experimental group. Groups of co-housed littermates were analyzed.
Fig. 8.
Fig. 8.. Epithelial HVEM is required for host defense against S. typhimurium infection.
HvemΔIEC mice and control Hvemfl/fl mice were infected orally with 1 × 10⁷ S. typhimurium colony-forming units (CFU)/mouse (A-C). (A) Survival curves (Hvemfl/fl, n=8; HvemΔIEC, n=11). (B) Changes in body weight (% change from baseline) (infected Hvemfl/fl, n=8; infected HvemΔIEC, n=9; uninfected Hvemfl/fl, n=11; uninfected HvemΔIEC, n=8). (C) Bacterial burdens at day 4 p.i. (Hvemfl/fl, n=8; HvemΔIEC, n=9). (D) Itgb1fl/fl (n=9) and Itgb1ΔprLck (n=11) mice were infected orally with S. typhimurium and bacterial burdens measured at days 3–4 p.i. Dashed line represents the limit of detection (C, D). Statistical analysis was performed using Log-rank test (A), 2 way ANOVA with Bonferroni’s multiple comparison test (B), or Mann-Whitney test (C, D). Statistical significance is indicated by *, p < 0.05; **, p < 0.01; ***, p < 0.001. Data shown are means ± SEM (A). Bars show the mean, symbols represent individual mice. Data represent pooled results from at least two independent experiments having at least three mice per group in each experiment. Groups of co-housed littermates were analyzed.

Similar articles

Cited by

References

    1. Edelblum KL, Shen L, Weber CR, Marchiando AM, Clay BS, Wang Y, Prinz I, Malissen B, Sperling AI, Turner JR, Dynamic migration of gammadelta intraepithelial lymphocytes requires occludin. Proceedings of the National Academy of Sciences of the United States of America 109, 7097–7102 (2012). - PMC - PubMed
    1. Hoytema van Konijnenburg DP, Reis BS, Pedicord VA, Farache J, Victora GD, Mucida D, Intestinal Epithelial and Intraepithelial T Cell Crosstalk Mediates a Dynamic Response to Infection. Cell 171, 783–794 e713 (2017). - PMC - PubMed
    1. Wang X, Sumida H, Cyster JG, GPR18 is required for a normal CD8alphaalpha intestinal intraepithelial lymphocyte compartment. The Journal of experimental medicine 211, 2351–2359 (2014). - PMC - PubMed
    1. Sumida H, Lu E, Chen H, Yang Q, Mackie K, Cyster JG, GPR55 regulates intraepithelial lymphocyte migration dynamics and susceptibility to intestinal damage. Sci Immunol 2, (2017). - PMC - PubMed
    1. Cheroutre H, Lambolez F, Mucida D, The light and dark sides of intestinal intraepithelial lymphocytes. Nature reviews. Immunology 11, 445–456 (2011). - PMC - PubMed

Publication types