. 2022 Jan-Dec;14(1):2105102.
doi: 10.1080/19490976.2022.2105102.

Helicobacter pylori actively suppresses innate immune nucleic acid receptors

Affiliations

Helicobacter pylori actively suppresses innate immune nucleic acid receptors

Samuel D R Dooyema et al. Gut Microbes. 2022 Jan-Dec.

Abstract

Chronic mucosal pathogens have evolved multiple strategies to manipulate the host immune response; consequently, microbes contribute to the development of >2 million cases of cancer/year. Gastric adenocarcinoma is the fourth leading cause of cancer-related death and Helicobacter pylori confers the highest risk for this disease. Gastric innate immune effectors can either eliminate bacteria or mobilize adaptive immune responses including Toll-like receptors (TLRs), and cytosolic DNA sensor/adaptor proteins (e.g., stimulator of interferon genes, STING). The H. pylori strain-specific cag type IV secretion system (T4SS) augments gastric cancer risk and translocates DNA into epithelial cells where it activates the microbial DNA sensor TLR9 and suppresses injury in vivo; however, the ability of H. pylori to suppress additional nucleic acid PRRs within the context of chronic gastric inflammation and injury remains undefined. In this study, in vitro and ex vivo experiments identified a novel mechanism through which H. pylori actively suppresses STING and RIG-I signaling via downregulation of IRF3 activation. In vivo, the use of genetically deficient mice revealed that Th17 inflammatory responses are heightened following H. pylori infection within the context of Sting deficiency in conjunction with increased expression of a known host immune regulator, Trim30a. This novel mechanism of immune suppression by H. pylori is likely a critical component of a finely tuned rheostat that not only regulates the initial innate immune response, but also drives chronic gastric inflammation and injury.

Keywords: Helicobacter pylori; RIG-I; STING; TLR9; TRIM30; gastric cancer; innate immunity.


Conflict of interest statement

No potential conflict of interest was reported by the author(s).

Figures

Figure 1.
Figure 1.
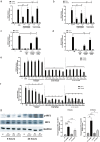
STING activation is reduced by H. pylori in vitro. STING+ or parental cells were challenged with PBS alone (UI), 2ʹ3’-cGAMP and/or (a) wild-type (wt) cag+ H. pylori strain J166, (b) H. pylori strain J166 at varying MOIs, (c) increasing pre-incubation times, or (d) cag+ H. pylori strains J166, G27, PMSS1, 7.13, or B128 at MOI 100:1 for 24 hours. STING activation was assessed and is shown as fold STING activation relative to uninfected control. Experiments were performed in triplicate, and samples were run in duplicate within each experiment. ANOVA with Bonferroni correction was used to determine statistical significance among groups. (e) STING+ or parental cells were challenged with PBS alone (UI), 2ʹ3’-cGAMP and/or H. pylori strain J166 for 6 and 24 hours and were then assessed for STING expression and activation by Western blot analysis. For Western blot analysis, conditions were tested at least 3 times and student’s t-tests were used to determine statistical significance between groups. *p < .05, **p < .01, ***p < .001, ****p < .0001, ns = not significant.
Figure 2.
Figure 2.
RIG-I activation is attenuated by H. pylori in vitro. RIG-I+ or parental cells were challenged with PBS alone (UI), RIG-I agonist 3p-hpRNA and/or (a) wild-type (wt) cag+ H. pylori strain J166 at MOI 100:1 for 24 hours, (b) H. pylori strain J166 at varying MOIs, (c) increasing pre-incubation times, or (d) cag+ H. pylori strains J166, G27, PMSS1, 7.13, or B128. RIG-I activation was assessed and is shown as fold RIG-I activation relative to uninfected control. Experiments were performed in triplicate, and samples were run in duplicate within each experiment. ANOVA with Bonferroni correction was used to determine statistical significance among groups. *p < .05, ***p < .001, ****p < .0001, ns = not significant.
Figure 3.
Figure 3.
H. pylori suppresses STING and RIG-I activation in vitro. (a) STING+ or parental cells were challenged with PBS alone (UI), 2ʹ3’-cGAMP and/or viable or heat inactivated (HI) wild-type (wt) H. pylori strain J166. (b) RIG-I+ or parental cells were challenged with PBS alone (UI), 3p-hpRNA and/or viable or heat inactivated (HI) H. pylori strain J166. (c) STING+ or parental cells were challenged with PBS alone (UI), 2ʹ3’-cGAMP, and/or H. pylori strain J166 or H. pylori gDNA. (d) RIG-I+ or parental cells were challenged with PBS alone (UI), 3p-hpRNA with or without H. pylori strain J166 or H. pylori gDNA. (e) STING+ or parental cells were challenged with PBS alone (UI), 2ʹ3’-cGAMP, and/or H. pylori strain J166 in the presence of increasing concentrations of Ruxolitinib. (f) RIG-I+ or parental cells were challenged with PBS alone (UI), 3p-hpRNA and/or H. pylori strain J166 in the presence of increasing concentrations of Ruxolitinib. STING and RIG-I activation was assessed and data are shown as fold activation relative to uninfected control. Experiments were performed in triplicate, and samples were run in duplicate within each experiment. ANOVA with Bonferroni correction was used to determine statistical significance between groups. (g) STING+ or parental cells were challenged with PBS alone (UI), 2ʹ3’-cGAMP with or without H. pylori strain J166 for 6 and 24 hours and were then assessed for IRF3 expression and activation by Western blot analysis. For Western blot analysis, conditions were tested at least 3 times and student’s t-tests were used to determine statistical significance between groups. *p < .05, **p < .01, ***p < .001, ****p < .0001, ns = not significant.
Figure 4.
Figure 4.
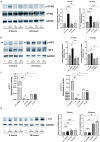
H. pylori downregulates STING and IRF3 activation but induces autophagy in human gastric organoids. Human gastric organoid monolayers were challenged with PBS alone (UI), 2ʹ3’-cGAMP with or without wild-type (wt) H. pylori strain J166 at MOI 100:1 for 6 and 24 hours. (a) STING activation was determined by quantifying levels of phosphorylated STING (pSTING). (b) IRF3 activation was determined by quantifying levels of phosphorylated IRF3 (p-IRF3, arrow) in gastric organoid co-cultures. Representative Western blots and densitometric analyses normalizing levels of pSTING and pIRF3 to total levels are shown at each time point. (c) RT-PCR analysis of MX1 and CXCL10 transcript levels are represented as relative gene expression levels normalized to levels of GAPDH gene expression. (d) Induction of autophagy was determined by quantifying levels of LC3-II. Representative Western blots and densitometric analyses normalizing levels of LC3-II to GAPDH are shown at each time point. In each experiment, conditions were tested at least 3 times and student’s t-tests were used to determine statistical significance between groups. *p < .05, **p < .01, ***p < .001, ns = not significant.
Figure 5.
Figure 5.
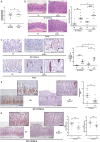
H. pylori infection significantly augments acute immune responses in Sting-deficient mice and decreases Sting and RigI expression in wild-type mice. Wild-type (WT) C57BL/6 and Sting−/− mice were challenged with Brucella broth (BB) or wild-type (wt) H. pylori strain PMSS1 for 8 weeks. (a) Gastric sections were homogenized and serially diluted on blood-agar plates to quantify H. pylori colonization in infected mice. (b) Acute inflammation was assessed and scored in the antrum and corpus of C57BL/6 wild-type or Sting−/− mice infected with or without H. pylori by a pathologist blinded to treatment groups. Histologic parameters were scored according to the Sydney System. Representative images of acute inflammation are shown at 200x. Scale bars = 100 µm. (c) MPO was assessed by IHC in wild-type or Sting−/− mice infected with or without H. pylori. Representative images of antral MPO IHC are shown at 400x and 1000x magnification. Scale bars = 50 µm. MPO+ cells were enumerated in 5 high-powered fields (HPF) from each mouse and averaged. Sting (d) and RigI (e) were assessed by IHC in wild-type mice infected with or without H. pylori. Representative images of antral Sting and RigI IHC are shown at 200x and 400x magnification. Scale bars = 100 µm (200x) and 50 µm (400x). (D) Sting immunoreactive score (IRS) gives a range of 0–12 as a product of multiplication between positive cells proportion score (0–4) and staining intensity score (0–3) across 5 HPFs from each animal. (E) RigI staining is shown as percent epithelial staining and epithelial staining intensity. Each data point represents an individual animal (WT BB, n = 8; WT PMSS1, n = 8; Sting−/− BB, n = 8; Sting−/− PMSS1, n = 10) from one experiment. Student’s t-tests were used to determine statistical significance between groups. *p < .05, **p < .01, ***p < .001, ****p < .0001, ns = not significant.
Figure 6.
Figure 6.
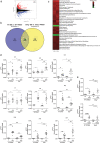
Differential gene expression between uninfected and infected wild-type C57BL/6 and Sting−/− mice from RNA-seq data. (a) Volcano plot representing differentially expressed genes in the RNA-seq dataset of uninfected wild-type (WT) C57BL/6 and Sting−/− mice at baseline. (b) Venn diagram representing differentially expressed genes in the RNA-seq dataset of uninfected and H. pylori-infected wild-type (WT) C57BL/6 and Sting−/− mice. (c) Top significantly affected (2.0 < Z score < −2.0) canonical pathways based on Ingenuity Pathway Analysis (IPA). The horizontal bars denote the different pathways based on the Z-scores. Red indicates activation, while green indicates suppression. (d) mRNA expression of Th17-related genes in uninfected and H. pylori-infected wild-type mice, and uninfected and H. pylori-infected Sting−/− mice. (e) mRNA expression of IRF3-dependent type I interferon stimulated genes, Mx1 and Cxcl10, in uninfected and H. pylori-infected wild-type mice, and uninfected and H. pylori-infected Sting−/− mice. Data are represented as relative gene expression normalized to levels of Gapdh gene expression. Each data point represents an individual animal (WT BB, n = 8; WT PMSS1, n = 8; Sting−/− BB, n = 8; Sting−/− PMSS1, n = 10) from one experiment. Student’s t-tests were used to determine statistical significance between groups. *p < .05, **p < .01, ***p < .001, ****p < .0001, ns = not significant.
Figure 7.
Figure 7.
H. pylori infection of murine gastric organoids downregulates IRF3-dependent type I interferon stimulated genes. Murine gastric organoid monolayers were challenged with PBS alone (UI), STING agonist 2ʹ3’-cGAMP, and/or wild-type (wt) H. pylori strain J166 or PMSS1 at MOI 100:1 for 6 or 24 hours. RT-PCR analysis of (a) Mx1 and (b) Cxcl10 transcript levels was assessed in co-cultured murine gastric organoids. Data are represented as relative gene expression levels normalized to levels of Gapdh gene expression. In each experiment, conditions were tested at least 3 times and student’s t-tests were used to determine statistical significance between groups. *p < .05, **p < .01, ***p < .001, ****p < .0001.
Figure 8.
Figure 8.
Trim30a, a known Sting suppressor, is upregulated by H. pylori in vivo in a Sting-dependent manner. (a) Venn diagram representing differentially expressed genes in the RNA-seq dataset of wild-type (WT) C57BL/6 and Sting−/− mice and schematic of how Sting-dependent genes were determined. (b) Genes that were determined to be dependent on Sting are shown by heatmap. Heatmap is displayed as logFC and red indicates upregulation, while green indicates downregulation. Trim30a is denoted by the arrow. (c) RT-PCR analysis of Trim30a mRNA levels in uninfected and H. pylori infected wild-type mice, and uninfected and H. pylori infected Sting−/− mice. Data are represented as relative Trim30a gene expression levels normalized to levels of Gapdh gene expression. (d) Trim30a was assessed by IHC in wild-type or Sting−/− mice infected with or without H. pylori. Representative images of antral Trim30a IHC are shown at 200x and 400x magnification. Red boxes indicate confirmed co-localization with PMNs. TRIM30a+ cells were enumerated in 5 high-powered fields (HPF) from each animal and averaged. Scale bars = 100 µm (200x) and 50 µm (400x). Each data point represents an individual animal (WT BB, n = 8; WT PMSS1, n = 8; Sting−/− BB, n = 8; Sting−/− PMSS1, n = 10) from one experiment. Student’s t-tests were used to determine statistical significance between groups. *p < .05, **p < .01, ***p < .001, ****p < .0001, ns = not significant.
Figure 9.
Figure 9.
Trim30a is upregulated by H. pylori in a STING-dependent manner. Murine gastric organoid monolayers or bone marrow derived dendritic cells (BMDC) derived from wild-type (WT) C57BL/6 or Sting−/− mice were challenged with PBS alone (UI) or wild-type (wt) H. pylori strain J166 or PMSS1 at MOI 100:1 for 24 hours. (a) Trim30a was quantified by Western blot analysis in co-cultured murine gastric organoid. Representative Western blots and densitometric analysis normalizing levels of Trim30a to Gapdh. (b) RT-PCR analysis of Trim30a mRNA levels in uninfected and H. pylori-infected wild-type and Sting−/− BMDCs. Data are represented as relative gene expression normalized to levels of Gapdh gene expression. (c) Trim30a was quantified by Western blot analysis in co-cultured BMDCs. Representative Western blots and densitometric analysis normalizing levels of Trim30a to Gapdh. In each experiment, conditions were tested at least 3 times and student’s t-tests were used to determine statistical significance between groups. *p < .05, **p < .01, ns = not significant. ##p < .01, ###p < .001 ####p < .0001 compared to untreated.
Figure 10.
Figure 10.
TRIM6, TRIM22, and TRIM29 are upregulated in inflamed or cancerous human clinical gastric specimens. (a) Multiple sequence alignment of human TRIM30a orthologs to the murine Trim30a protein sequence. The sequence alignment was performed using the T-Coffee program. (b) RT-PCR analysis of TRIM6, TRIM22, and TRIM29 expression in patient samples of normal gastric tissue or samples that harbored inflammation alone (open symbols) or cancer (closed symbols). Data are represented as relative gene expression normalized to levels of GAPDH gene expression. Each data point represents an individual patient sample (normal, n = 10; diseased, n = 20). Student’s t-tests were used to determine statistical significance between groups. *p < .05, **p < .01, ****p < .0001.

References

    1. Gewirtz AT, Yu Y, Krishna US, Israel D, Lyons S, Peek, Jr R.. Helicobacter pylori flagellin evades toll-like receptor 5–mediated innate immunity. J Infect Dis. 2004 May 15;189(10):1914–27. doi:10.1086/386289. - DOI - PubMed
    1. Chow J, Tang H, Mazmanian SK. Pathobionts of the gastrointestinal microbiota and inflammatory disease. Curr Opin Immunol. 2011. Aug;23(4):473–480. doi:10.1016/j.coi.2011.07.010. - DOI - PMC - PubMed
    1. Gagnaire A, Nadel B, Raoult D, Neefjes J, Gorvel J-P. Collateral damage: insights into bacterial mechanisms that predispose host cells to cancer. Nat Rev Microbiol. 2017. Feb;15(2):109–128. doi:10.1038/nrmicro.2016.171. - DOI - PubMed
    1. Amieva M, Peek RM Jr. Pathobiology of Helicobacter pylori-induced gastric cancer. Gastroenterology. 2016. Jan;150(1):64–78. doi:10.1053/j.gastro.2015.09.004. - DOI - PMC - PubMed
    1. Polk DB, Peek RM Jr. Helicobacter pylori: gastric cancer and beyond. Nat Rev Cancer Jun. 2010;10(6):403–414. doi:10.1038/nrc2857. - DOI - PMC - PubMed

Publication types