. 2022 Jul 29;145(7):2378-2393.
doi: 10.1093/brain/awac103.

Harnessing cortical plasticity via gabapentinoid administration promotes recovery after stroke

Affiliations

Harnessing cortical plasticity via gabapentinoid administration promotes recovery after stroke

Andrea Tedeschi et al. Brain. .

Abstract

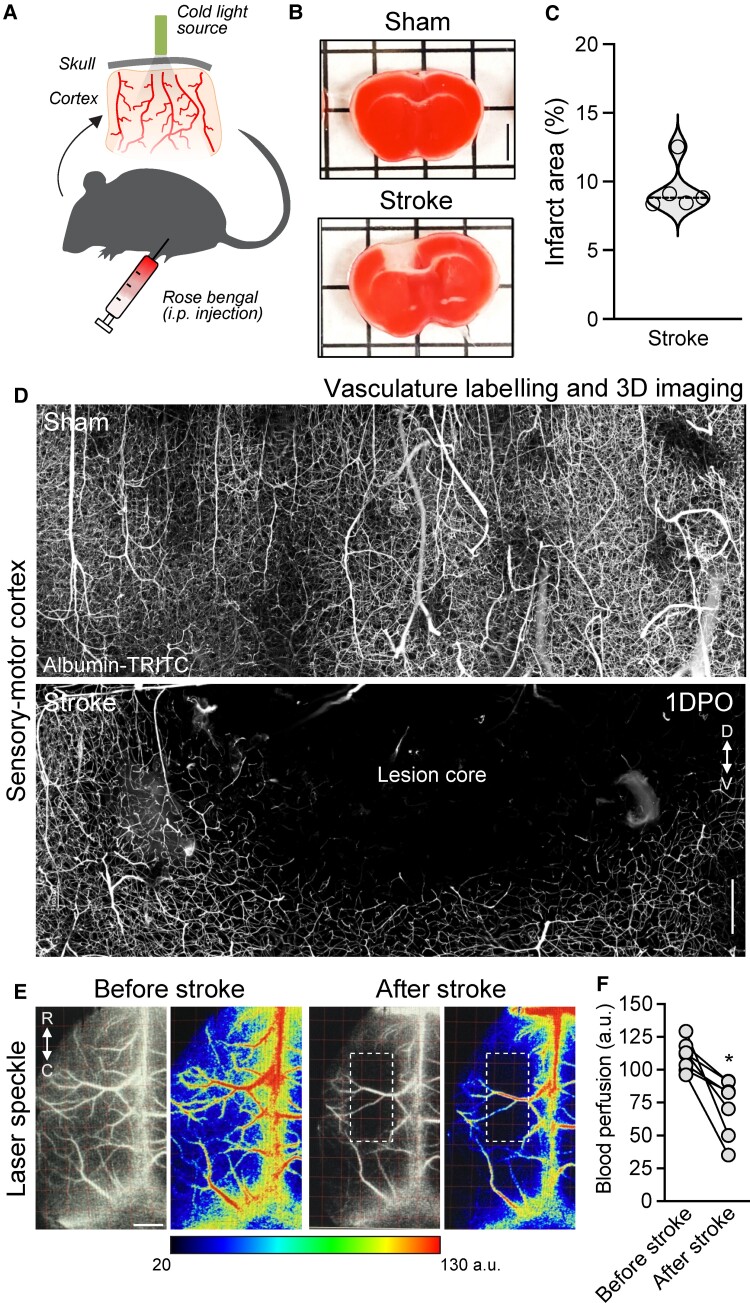
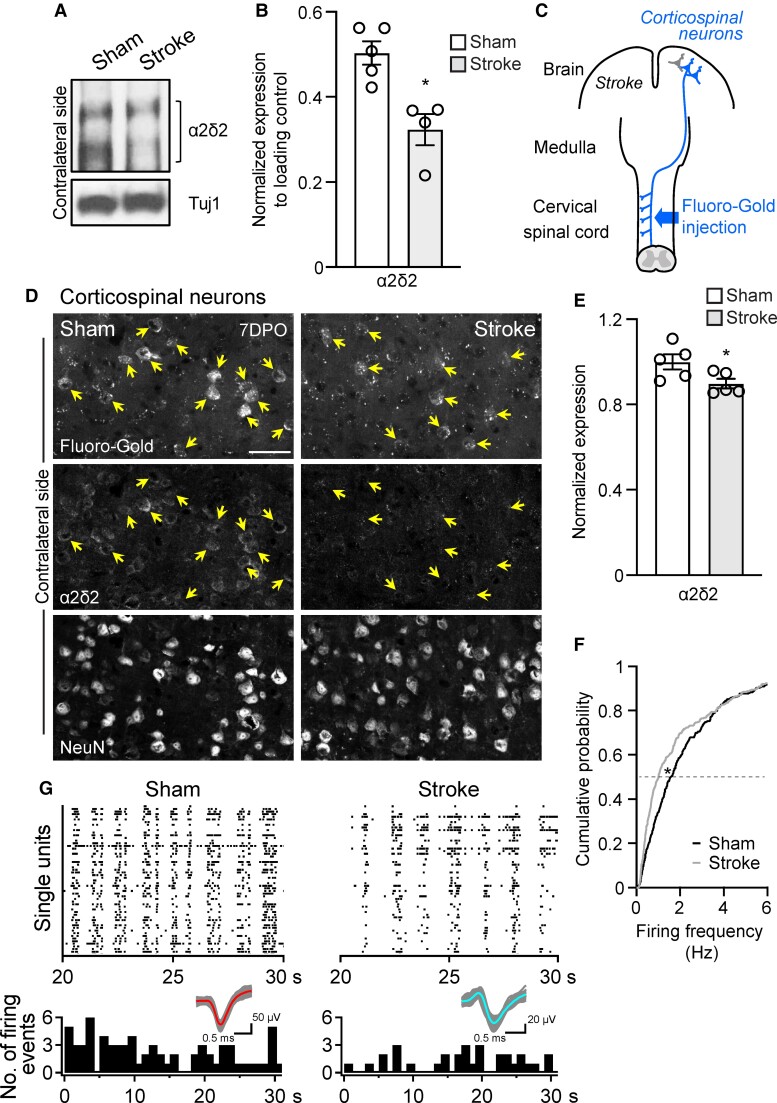
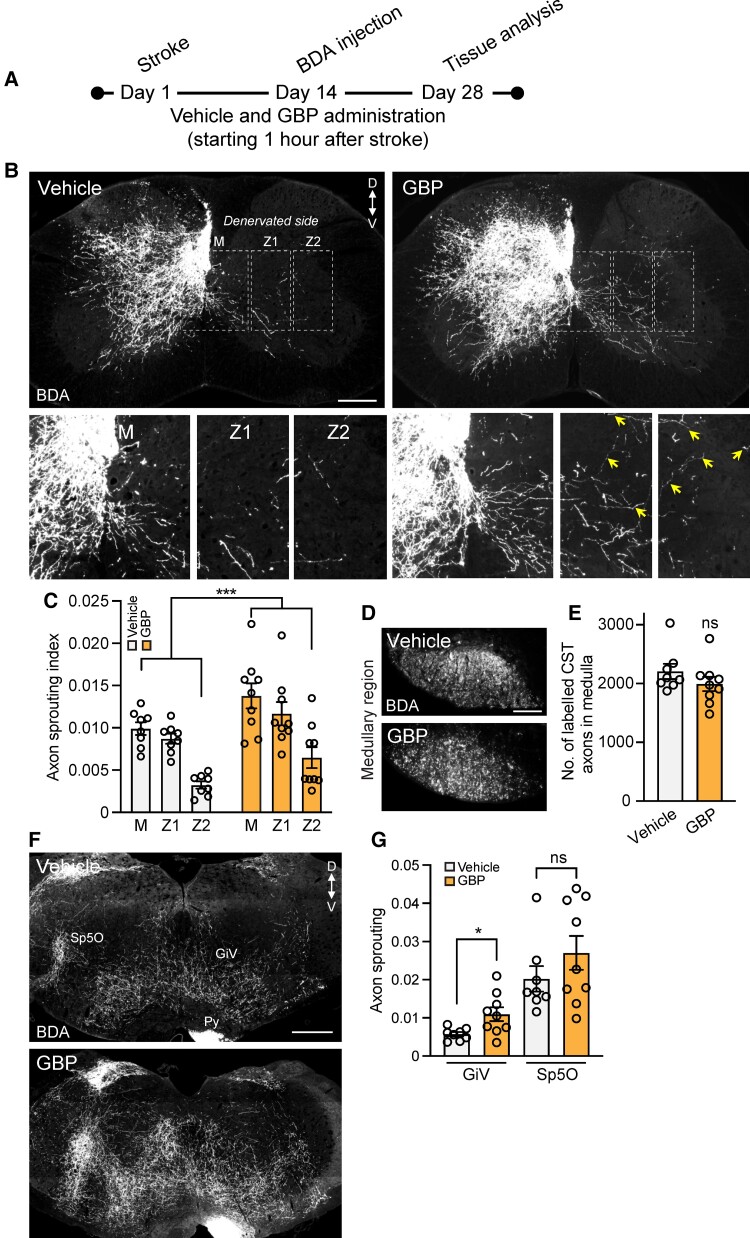
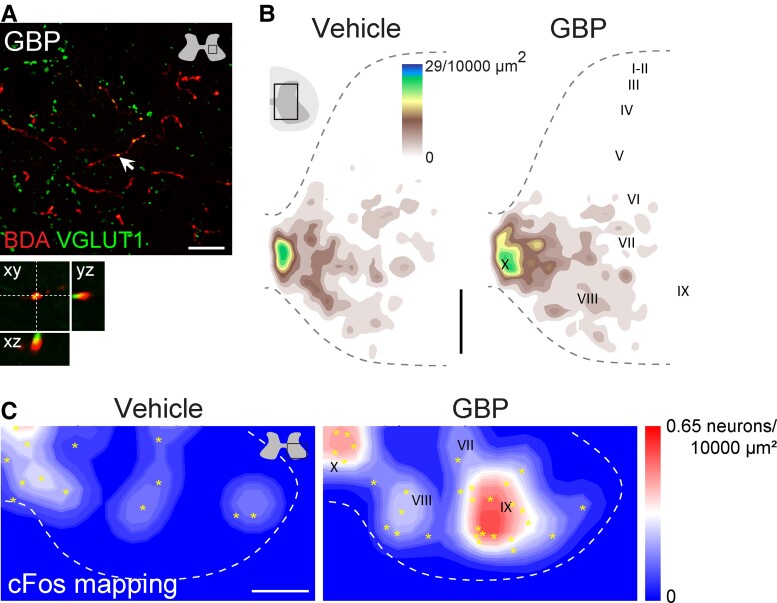
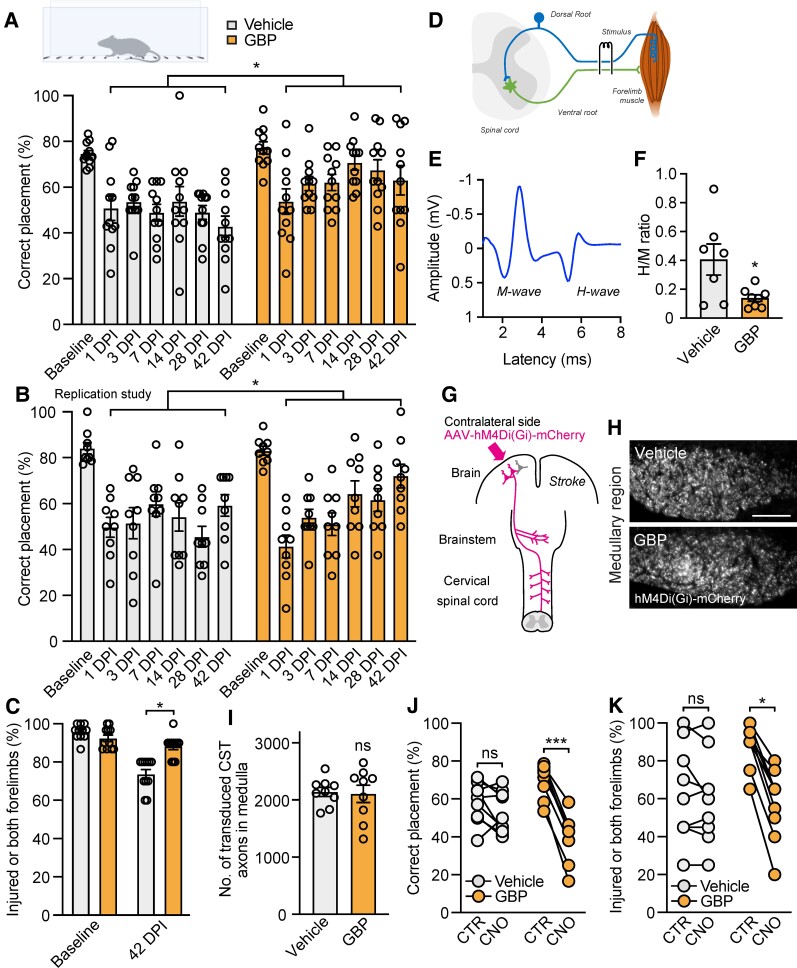
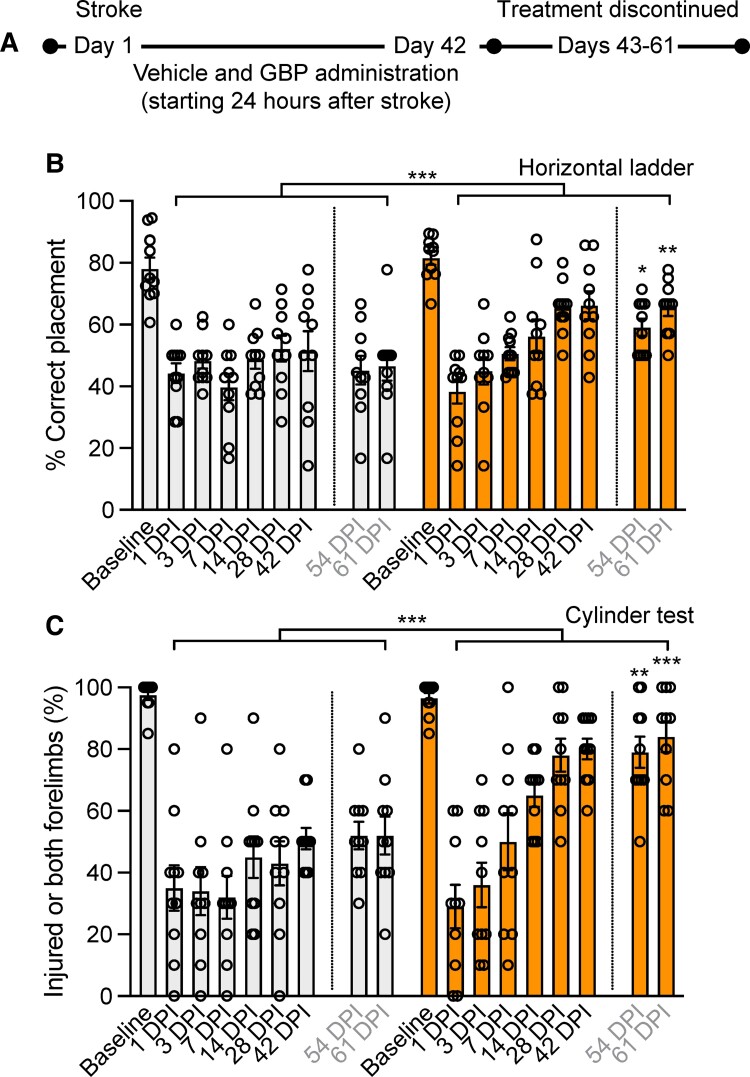
Stroke causes devastating sensory-motor deficits and long-term disability due to disruption of descending motor pathways. Restoration of these functions enables independent living and therefore represents a high priority for those afflicted by stroke. Here, we report that daily administration of gabapentin, a clinically approved drug already used to treat various neurological disorders, promotes structural and functional plasticity of the corticospinal pathway after photothrombotic cortical stroke in adult mice. We found that gabapentin administration had no effects on vascular occlusion, haemodynamic changes nor survival of corticospinal neurons within the ipsilateral sensory-motor cortex in the acute stages of stroke. Instead, using a combination of tract tracing, electrical stimulation and functional connectivity mapping, we demonstrated that corticospinal axons originating from the contralateral side of the brain in mice administered gabapentin extend numerous collaterals, form new synaptic contacts and better integrate within spinal circuits that control forelimb muscles. Not only does gabapentin daily administration promote neuroplasticity, but it also dampens maladaptive plasticity by reducing the excitability of spinal motor circuitry. In turn, mice administered gabapentin starting 1 h or 1 day after stroke recovered skilled upper extremity function. Functional recovery persists even after stopping the treatment at 6 weeks following a stroke. Finally, chemogenetic silencing of cortical projections originating from the contralateral side of the brain transiently abrogated recovery in mice administered gabapentin, further supporting the conclusion that gabapentin-dependent reorganization of spared cortical pathways drives functional recovery after stroke. These observations highlight the strong potential for repurposing gabapentinoids as a promising treatment strategy for stroke repair.

Keywords: corticospinal tract; functional recovery; gabapentinoids; stroke; structural plasticity.


Figures

Figure 1
Figure 1
Vascular and haemodynamic changes within the sensory-motor cortex in the acute stages of stroke. (A) Schematic of photothrombotic stroke in mice. (B) Representative photographs of the brain following TTC staining 1 day after operation. Scale bar = 2 mm. (C) Quantification of B. Violin plot with median (n = 5). (D) Automated tile scanning of the vasculature in the cleared sensory-motor cortex 1 day after operation (DPO) (D = dorsal, V = ventral). Scale bar = 250 μm. (E) Laser speckle imaging before stroke and 10 min after offset of light. The dashed box indicates the infarct area (R = rostral, C = caudal). Scale bar = 1 mm. (F) Quantification of E. Aligned dot plot (signed rank test, paired *P < 0.05; n = 7).
Figure 2
Figure 2
A reduction in α2δ2 expression coincides with changes in electrophysiological properties of corticospinal neurons after stroke. (A) Immunoblot shows α2δ2 expression in the contralateral sensory-motor cortex 7 days after operation. Under reducing conditions, the α2δ2 antibody recognizes two bands at 130 and 105 kDa. Tuj1 is used as the loading control. (B) Quantification of A. Mean and SEM. Biological replicates originated from two independent experiments with sham #1, 2, 3 and stroke #1, 2, 3 from experiment no. 1 and sham #4, 5 and stroke #4 from experiment no. 2. Immunoblots were processed in parallel. Data normalized using loading control (Wilcoxon rank sum test *P < 0.05, sham n = 5 and stroke n = 4). (C) Schematic of retrograde labelling of corticospinal neurons in the brain. (D) Representative fluorescence images of retrogradely labelled corticospinal neurons (arrows) on the contralateral side of the brain 7 days after operation. Scale bar = 50 μm. (E) Quantification of D. Mean and SEM (mixed model type III test of fixed effects *P < 0.05; sham n = 5 and stroke n = 5; 55–133 neurons/animal, 440–461 neurons/group in total). (F) Differential distribution of firing frequency for all recorded single units (two-sample Kolmogorov–Smirnov test *P < 0.05; sham n = 5 and stroke n = 5; 353–355 single units/experimental group). (G) Raster plots show spontaneous firing within layer V of the sensory-motor cortex 7 days after operation. Bottom: histograms of firing events. Inset: spiking waveform of the single unit; the coloured lines show the average waveform and grey lines show all recorded waveforms.
Figure 3
Figure 3
GBP administration promotes corticospinal plasticity after stroke. (A) Experimental scheme of B. (B) Representative fluorescence images of C7 spinal cord sections from adult mice 4 weeks after stroke (D = dorsal, V = ventral). The yellow arrows indicate corticospinal collaterals (bottom). Scale bar = 250 μm. (C) Quantification of B. Mean and SEM (type III test from linear regression model ***P < 0.001; vehicle n = 8 and GBP n = 9). (D) BDA-labelled corticospinal axons in the medullary region. Scale bar = 100 μm. (E) Quantification of D. Mean and SEM (Wilcoxon rank sum test; ns = not significant; vehicle n = 8 and GBP n = 9). (F) Representative fluorescence images of brainstem. GiV = gigantocellular reticular nucleus; Sp5O = spinal trigeminal nucleus; Py = pyramidal tract. Scale bar = 500 μm. (G) Quantification of F. Mean and SEM (Wilcoxon rank sum test, *P < 0.05, ns = not significant; vehicle n = 8 and GBP n = 9).
Figure 4
Figure 4
Mice administered GBP display enhanced functional connectivity. (A) Representative fluorescence images of C7 spinal cord sections from stroke mice administered GBP. Bottom: Orthogonal projections of the region in the main panel indicated by the arrow. Scale bar = 20 μm. (B) Mapping of excitatory presynaptic terminals on the contralateral side of the spinal cord 4 weeks after stroke (vehicle n = 9 and GBP n = 9). Roman numerals indicate spinal laminae. Scale bar = 200 μm. (C) cFos activity mapping in the ventral horn on the contralateral side of the C7 spinal cord. 2D histogram represents average density and yellow asterisks indicate the location of cFos+ neurons (vehicle n = 4 and GBP n = 4). Dashed line and Roman numerals indicate the border of the grey matter and spinal laminae, respectively. Scale bar = 200 μm.
Figure 5
Figure 5
Mice administered GBP beginning 1 h after stroke recover forelimb function. (A) Recovery of forelimb skilled function was assessed using the horizontal ladder rung walking test. Mean and SEM (mixed model with repeated measures using compound symmetry covariance structure and controlled on baseline values *P < 0.05; vehicle n = 11 and GBP n = 11). (B) Replication of the study shown in A. Mean and SEM (mixed model with repeated measures using compound symmetry covariance structure and controlled on baseline values *P < 0.05; vehicle n = 9 and GBP n = 9). (C) Recovery of forelimb symmetry was assessed using the cylinder test. Mean and SEM (mixed model with repeated measures using compound symmetry covariance structure *P < 0.05; vehicle n = 11 and GBP n = 11). (D) Schematic of H-reflex electrophysiological recording. (E) Representative M and H wave responses from forelimb muscles. (F) Hmax/Mmax ratio at 35 days after stroke. Mean and SEM (Wilcoxon rank sum test *P < 0.05; vehicle n = 7 and GBP n = 8). (G) Schematic of chemogenetic silencing. (H) hM4Di(Gi)-mCherry transduced corticospinal axons in the medullary region. Scale bar = 100 μm. (I) Quantification of H. Mean and SEM (Wilcoxon rank sum test; ns, not significant; vehicle n = 9 and GBP n = 9). Abrogation of recovery of (J) forelimb skilled walking and (K) forelimb symmetry in rearing after stroke on transient activation of hM4Di(Gi) in corticospinal neurons of mice administered GBP. Aligned dot plot (linear regression model *P < 0.05, ***P < 0.001; ns = not significant; vehicle n = 9 and GBP n = 9).
Figure 6
Figure 6
Mice administered GBP beginning 24 h after stroke recover forelimb function, even after treatment has been discontinued. (A) Experimental scheme of B and C. (B) Recovery of forelimb skilled function was assessed using the horizontal ladder rung walking test. Mean and SEM (mixed model with repeated measures using compound symmetry covariance structure and controlled on baseline values. For the 54 and 61 DPI comparison, time was used as categorical variable in the model *P < 0.05, **P < 0.01; vehicle n = 10 and GBP n = 10). (C) Recovery of forelimb symmetry was assessed using the cylinder test. Mean and SEM (mixed model with repeated measures using compound symmetry covariance structure. For the 54 and 61 DPI comparison, time was used as categorical variable in the model **P < 0.01, ***P < 0.001; vehicle n = 10 and GBP n = 10).

Similar articles

Cited by

References

    1. Collaborators GBDS . Global, regional, and national burden of stroke, 1990–2016: A systematic analysis for the Global Burden of Disease Study 2016. Lancet Neurol. 2019;18:439–458. - PMC - PubMed
    1. Murphy TH, Corbett D. Plasticity during stroke recovery: From synapse to behaviour. Nat Rev Neurosci. 2009;10:861–872. - PubMed
    1. Dobkin BH. Clinical practice. Rehabilitation after stroke. N Engl J Med. 2005;352:1677–1684. - PMC - PubMed
    1. Ward NS, Brander F, Kelly K. Intensive upper limb neurorehabilitation in chronic stroke: Outcomes from the Queen Square programme. J Neurol Neurosurg Psychiatry. 2019;90:498–506. - PubMed
    1. Tedeschi A, Bradke F. Spatial and temporal arrangement of neuronal intrinsic and extrinsic mechanisms controlling axon regeneration. Curr Opin Neurobiol. 2017;42:118–127. - PubMed

Publication types