. 2022 Sep:83:104182.
doi: 10.1016/j.ebiom.2022.104182. Epub 2022 Jul 26.

Dissecting drivers of immune activation in chronic HIV-1 infection

Affiliations

Dissecting drivers of immune activation in chronic HIV-1 infection

Hendrik Streeck et al. EBioMedicine. 2022 Sep.

Abstract

Background: Immune activation is a significant contributor to HIV pathogenesis and disease progression. In virally-suppressed individuals on ART, low-level immune activation has been linked to several non-infectious comorbid diseases. However, studies have not been systematically performed in sub-Saharan Africa and thus the impact of demographics, ART and regional endemic co-infections on immune activation is not known. We therefore comprehensively evaluated in a large multinational African cohort markers for immune activation and its distribution in various settings.

Methods: 2747 specimens from 2240 people living with HIV (PLWH) and 477 without HIV from the observational African Cohort Study (AFRICOS) were analyzed for 13 immune parameters. Samples were collected along with medical history, sociodemographic and comorbidity data at 12 HIV clinics across 5 programs in Uganda, Kenya, Tanzania and Nigeria. Data were analyzed with univariate and multivariate methods such as random forests and principal component analysis.

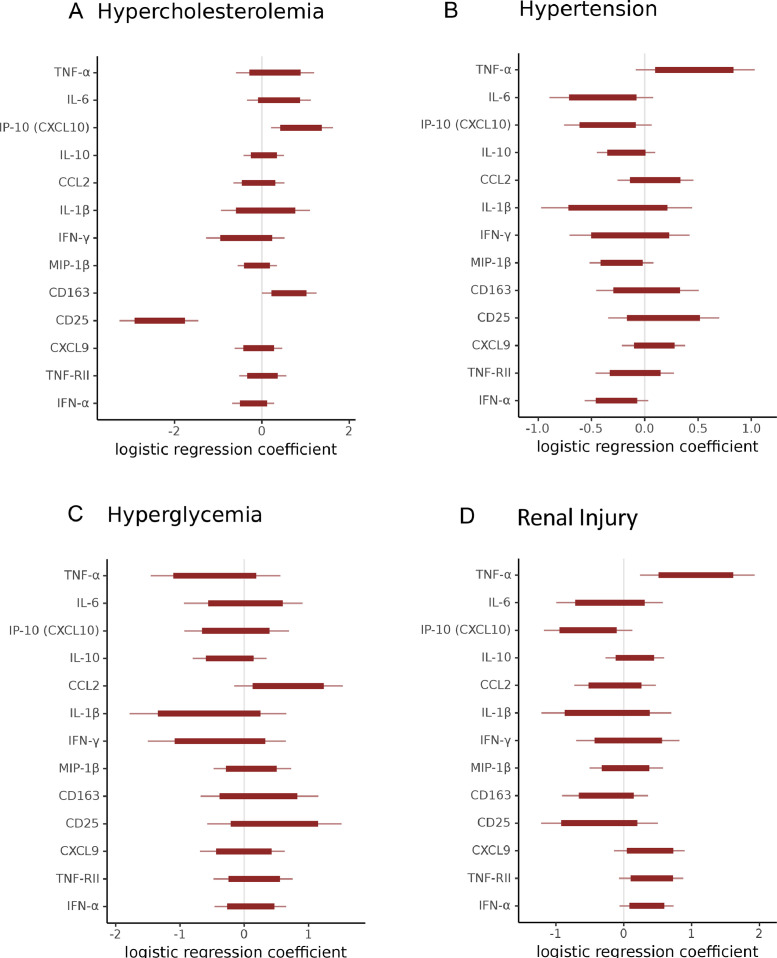
Findings: Immune activation was markedly different between PLWH with detectable viral loads, and individuals without HIV across sites. Among viremic PLWH, we found that all immune parameters were significantly correlated with viral load except for IFN-α. The overall inflammatory profile was distinct between men and women living with HIV, in individuals off ART and with HIV viremia. We observed stronger differences in the immune activation profile with increasing viremia. Using machine learning methods, we found that geographic differences contributed to unique inflammatory profiles. We also found that among PLWH, age and the presence of infectious and/or noninfectious comorbidities showed distinct inflammatory patterns, and biomarkers may be used to predict the presence of some comorbidities.

Interpretation: Our findings show that chronic immune activation in HIV-1 infection is influenced by HIV viral load, sex, age, region and ART use. These predictors, as well as associations among some biomarkers and coinfections, influence biomarkers associated with noncommunicable diseases.

Funding: This work was supported by the President's Emergency Plan for AIDS Relief via a cooperative agreement between the Henry M. Jackson Foundation for the Advancement of Military Medicine, Inc., and the U.S. Department of Defense [W81XWH-11-2-0174, W81XWH-18-2-0040]. The investigators have adhered to the policies for protection of human subjects as prescribed in AR 70-25. This article was prepared while Michael A. Eller was employed at Henry M. Jackson Foundation for the Advancement of Military Medicine for the U.S. Military HIV Research Program. The views expressed are those of the authors and should not be construed to represent the positions of the US Army or the Department of Defense. The opinions expressed in this article are the author's own, and do not reflect the view of the National Institutes of Health, the U.S. Department of Health and Human Services, or the U.S. government.

Keywords: Antiretroviral therapy; HIV; Immune activation; Inflammation.


Conflict of interest statement

Declaration of interests All authors declare no conflicts of interest.

Figures

Figure 1
Figure 1
Differences in Immune activation Profiles depending on Gender and Viral Load. (a) Linear regression of viral load vs. immune parameter concentration. R² is the squared correlation coefficient (coefficient of determination), Pminus is the posterior probability of the slope exceeding 0. High values of Pminus mean that no association between viral load (VL) and the respective immune parameter is consistent with the observed data. The magnitude of the slope is color coded and corresponds to an expected increase of the immune parameter concentration for a 10-fold increase in viral load, e.g. a 10-fold increase in viral load is associated with an expected increase in immune parameter concentration between 5% and 55%. (b) Average immune parameter difference between female and male subjects for different subgroups based on viral load, e.g. given the model and the observed data, female subjects in the HIV infected, VL < 50 cp/ml subgroup have on average around 10% higher CD163 levels than male subjects. Error bars correspond to interquantile intervals of marginal probabilities (bold: 10% and 90% quantiles, thin: 2.5% and 97.5% quantiles).
Figure 2
Figure 2
Predictors of Immune activation. The differences are estimated with a model that predicts immune parameter concentrations from gender, viral load, region, education, age, time since HIV diagnosis CD3+ CD4+ cell counts, hepatitis B status, hepatitis C status, tuberculosis, syphilis, hepatitis B and on NRTI (as an interaction term) and HIV-infected and on NRTI (as an interaction term). (a) Random forest classification of non-communicable diseases (NCDs), communicable diseases (CDs), region, gender, body mass index (BMI) and age as measured by Cohen's kappa. The explanatory variables are the list of immune parameters, region, education, age category, HIV category, gender, alcohol use, smoker, viral load and active ART therapy. Corresponding explanatory variables are removed when necessary, e.g. region is removed from the predictors when region is the explained variable. (b) The plots show that the random forest is able to predict region, gender and NCDs based on the predictors, indicating that there is an association between the predictors and these variables. This analysis was used as a starting point for further modeling, e.g. see Figure 1 for the association between gender and immune parameter values. (c) Violin plots of the distribution of CCL2 and MIP-1beta for different regions. The dots represent individual data points. The plots how that CCL2 levels are on average lower in Uganda and Kenya than in the other regions, and that MIP-1beta levels are comparatively higher in SRV, Kenya.
Figure 3
Figure 3
Association of Age and Immune activation. Average immune parameter increase for an age difference of 10 years, e.g. given the model and the observed data, subjects that are 10 years older have CCL2 levels that are around 7% higher compared to younger subjects. Error bars correspond to interquantile intervals of marginal probabilities (bold: 10% and 90% quantiles, thin: 2.5% and 97.5% quantiles). Estimates are computed from a model that predicts immune parameters and includes gender, viral load, region, education, age, time since HIV diagnosis, CD3+ CD4+ cell counts, hepatitis B status, hepatitis C status, tuberculosis, syphilis, hepatitis B and on NRTI (as an interaction term) and HIV-infected and on NRTI (as an interaction term).
Figure 4
Figure 4
Differences in Immune activation and Co-Infections. Logistic regression model predicting the presence of hepatitis B, hepatitis C, syphilis and tuberculosis with explanatory variables gender, HIV category (uninfected, VL < 50 cp/ml, VL ≥ 50 cp/ml), VL, region, education, age, and the list of immune parameters. Regression coefficients for the different immune parameters are shown. Immune parameters that have a high probability of being associated with the respective communicable disease are marked with an asterisk. The immune parameters are measured on a log10 scale, e.g. a 10-fold increase in CXCL9 levels is associated with an increased probability of the subjects being infected with hepatitis B. The model does not make a statement on causality or the direction of the effect and is purely a summary of the observed data, e.g. subjects with hepatitis B have higher CXCL9 levels on average, but it does not say that hepatitis B induces higher CXCL9 levels or that subjects with high CXCL9 levels are more likely to contract hepatitis B. Positive regression coefficients correspond to a positive association with the respective communicable disease, negative regression coefficients correspond to a negative association with the communicable disease, e.g. for tuberculosis, higher CXCL9 levels are associated with an increased probability of observing tuberculosis in this subjects, whereas increased IL-10 levels are associated with a decreased probability of observing tuberculosis in this subject. The regression coefficients are in units of log-odds, which are defined as log(p/1-p).
Figure 5
Figure 5
Perturbation of Immune activation profiles in non-communicable diseases. Logistic regression model predicting the presence of Hypercholesterolemia, Hypertension, Hyperglycemia and Renal injury based on the explanatory variables gender, HIV category (uninfected, infected VL < 50 cp/ml, infected VL ≥ 50 cp/ml), viral load, region, education, age and the list of immune parameters. Regression coefficients for the different immune parameters are shown. Immune parameters that have a high probability of being associated with the respective non-communicable disease are marked with an asterisk. The immune parameters are measured on a log10 scale, e.g. a 10-fold increase in TNF-alpha levels is associated with an increased probability of the subjects having renal injury. The model does not make a statement on causality or the direction of the effect and is purely a summary of the observed data, e.g. subjects with renal injury have higher TNF-alpha levels on average, but it does not say that high TNF-alpha levels are the result of renal injury or that TNF-alpha is a risk factor for renal injury. Positive regression coefficients correspond to a positive association with the respective non-communicable disease, negative regression coefficients correspond to a negative association with the non-communicable disease, e.g. for Hypercholesterolemia, higher IL-6 levels are associated with an increased probability of observing hypercholesterolemia in this subjects, whereas increased CD25 levels are associated with a decreased probability of observing hypercholesterolemia in this subject. The regression coefficients are in units of log-odds, which are defined as log(p/1-p).

References

    1. Wing E.J. HIV and aging. Int J Infect Dis. 2016;53:61–68. - PubMed
    1. Guaraldi G., Milic J., Mussini C. Aging with HIV. Curr HIV/AIDS Rep. 2019;16(6):475–481. - PubMed
    1. Franceschi C., Bonafé M., Valensin S., et al. Inflamm-aging. An evolutionary perspective on immunosenescence. Ann N Y Acad Sci. 2000;908:244–254. - PubMed
    1. Nasi M., De Biasi S., Gibellini L., et al. Ageing and inflammation in patients with HIV infection. Clin Exp Immunol. 2017;187(1):44–52. - PMC - PubMed
    1. Hunt P.W., Brenchley J., Sinclair E., et al. Relationship between T cell activation and CD4+ T cell count in HIV-seropositive individuals with undetectable plasma HIV RNA levels in the absence of therapy. J Infect Dis. 2008;197(1):126–133. - PMC - PubMed

Substances