. 2022 Jul 26;40(4):111139.
doi: 10.1016/j.celrep.2022.111139.

Dynamic control of visually guided locomotion through corticosubthalamic projections

Affiliations

Dynamic control of visually guided locomotion through corticosubthalamic projections

Elie M Adam et al. Cell Rep. .

Abstract

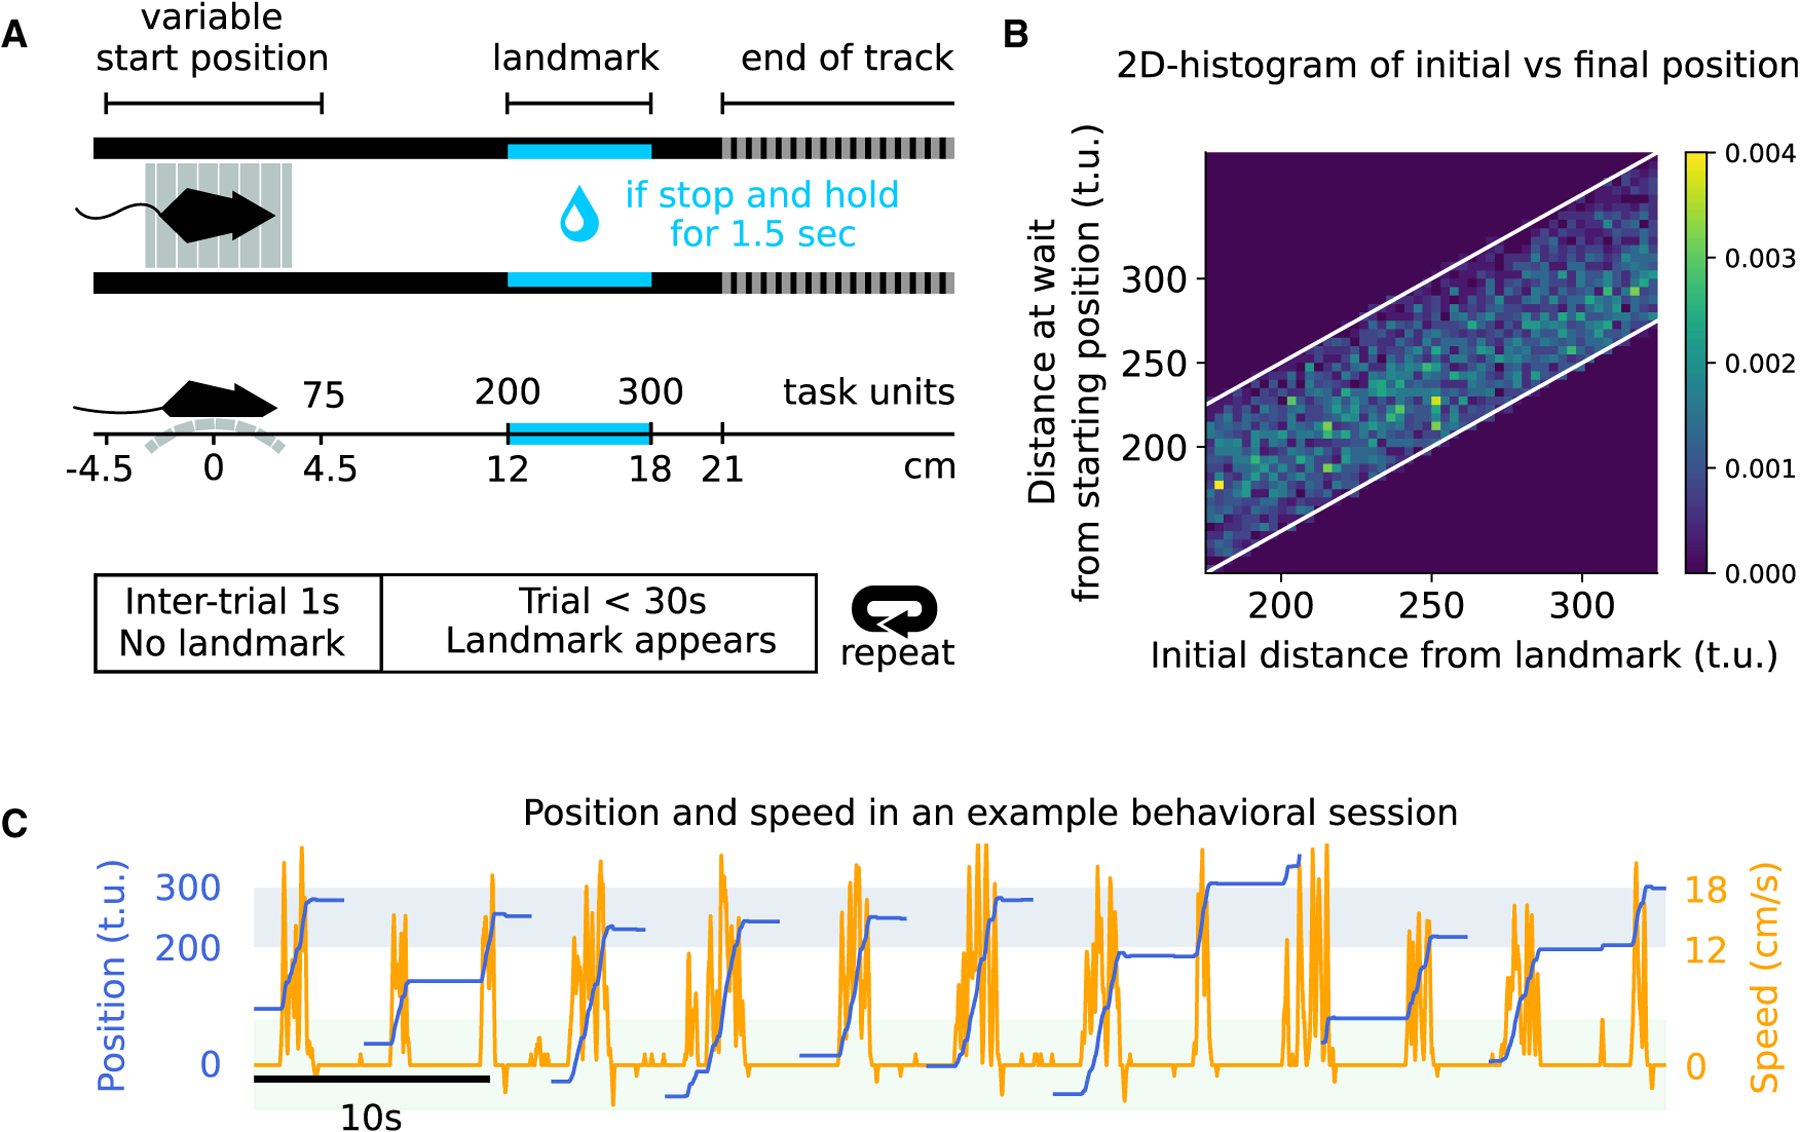
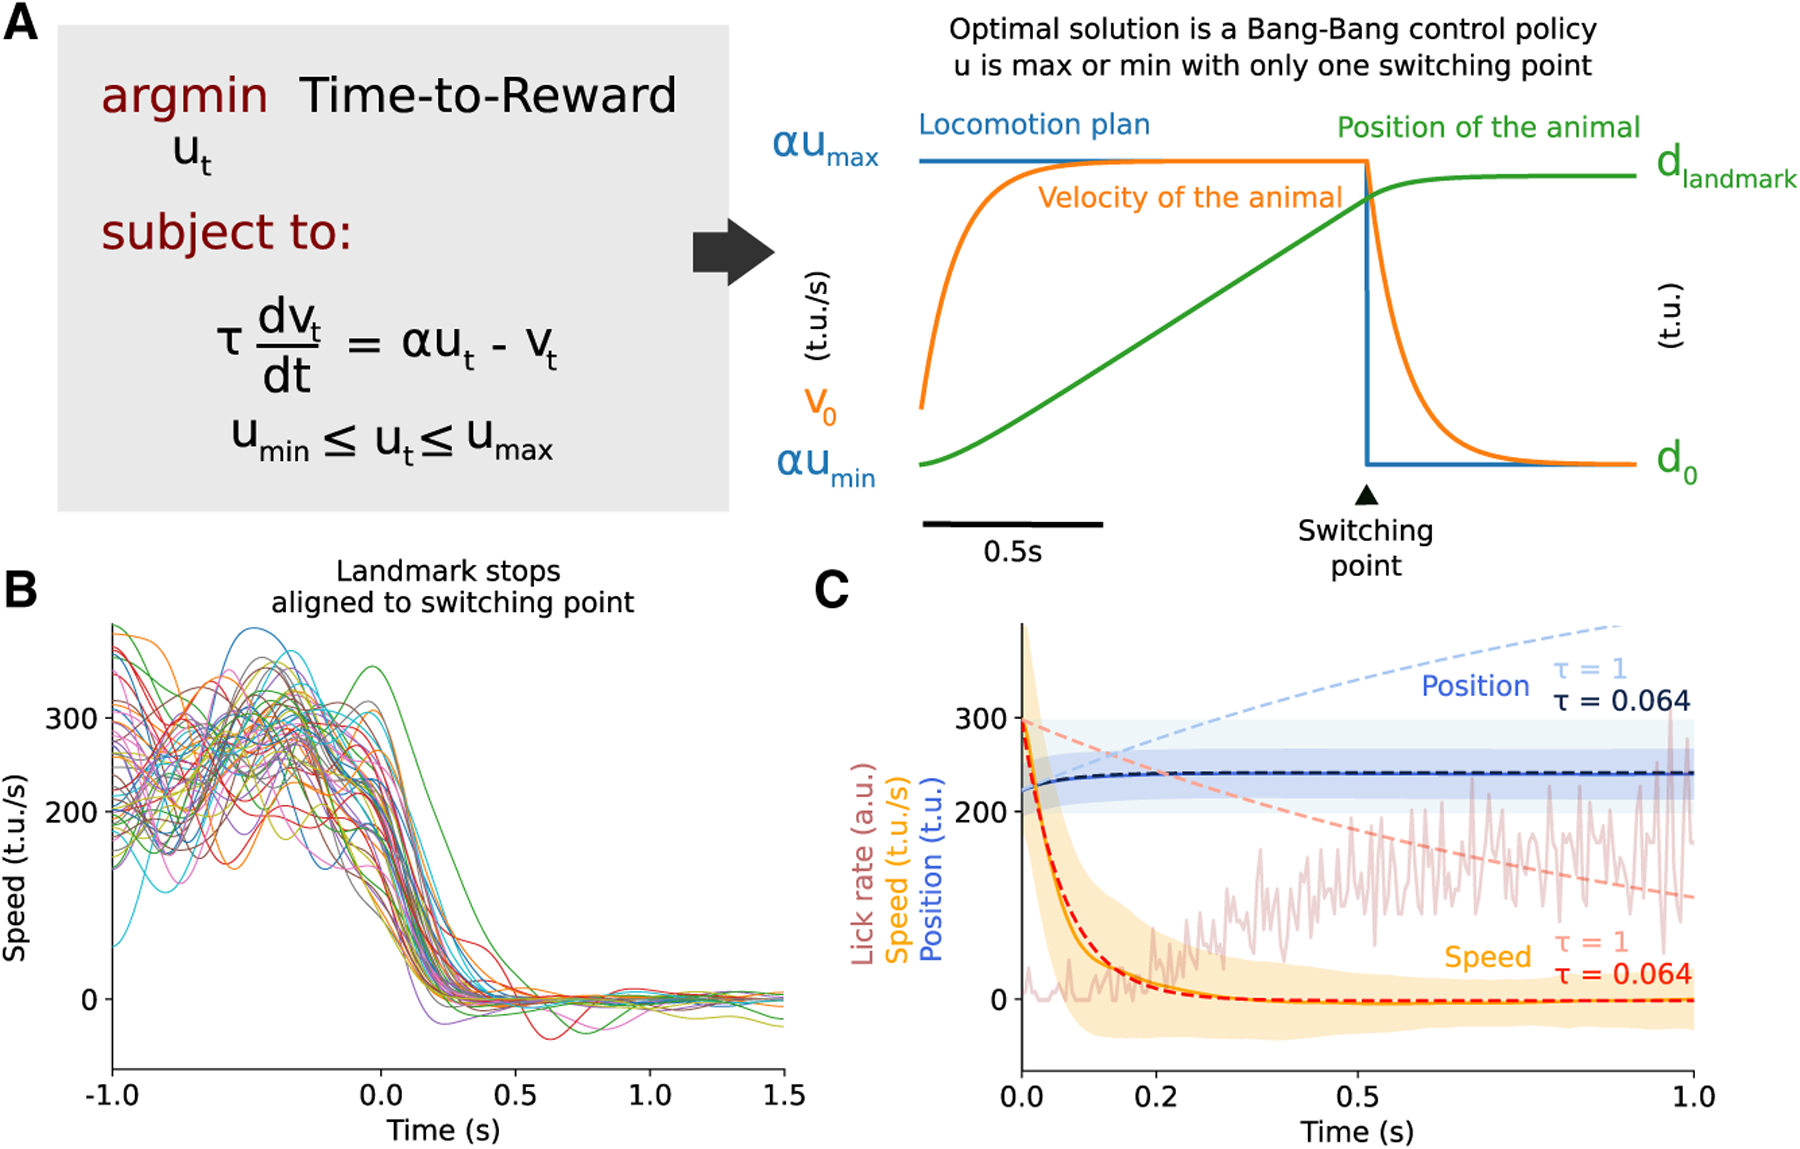
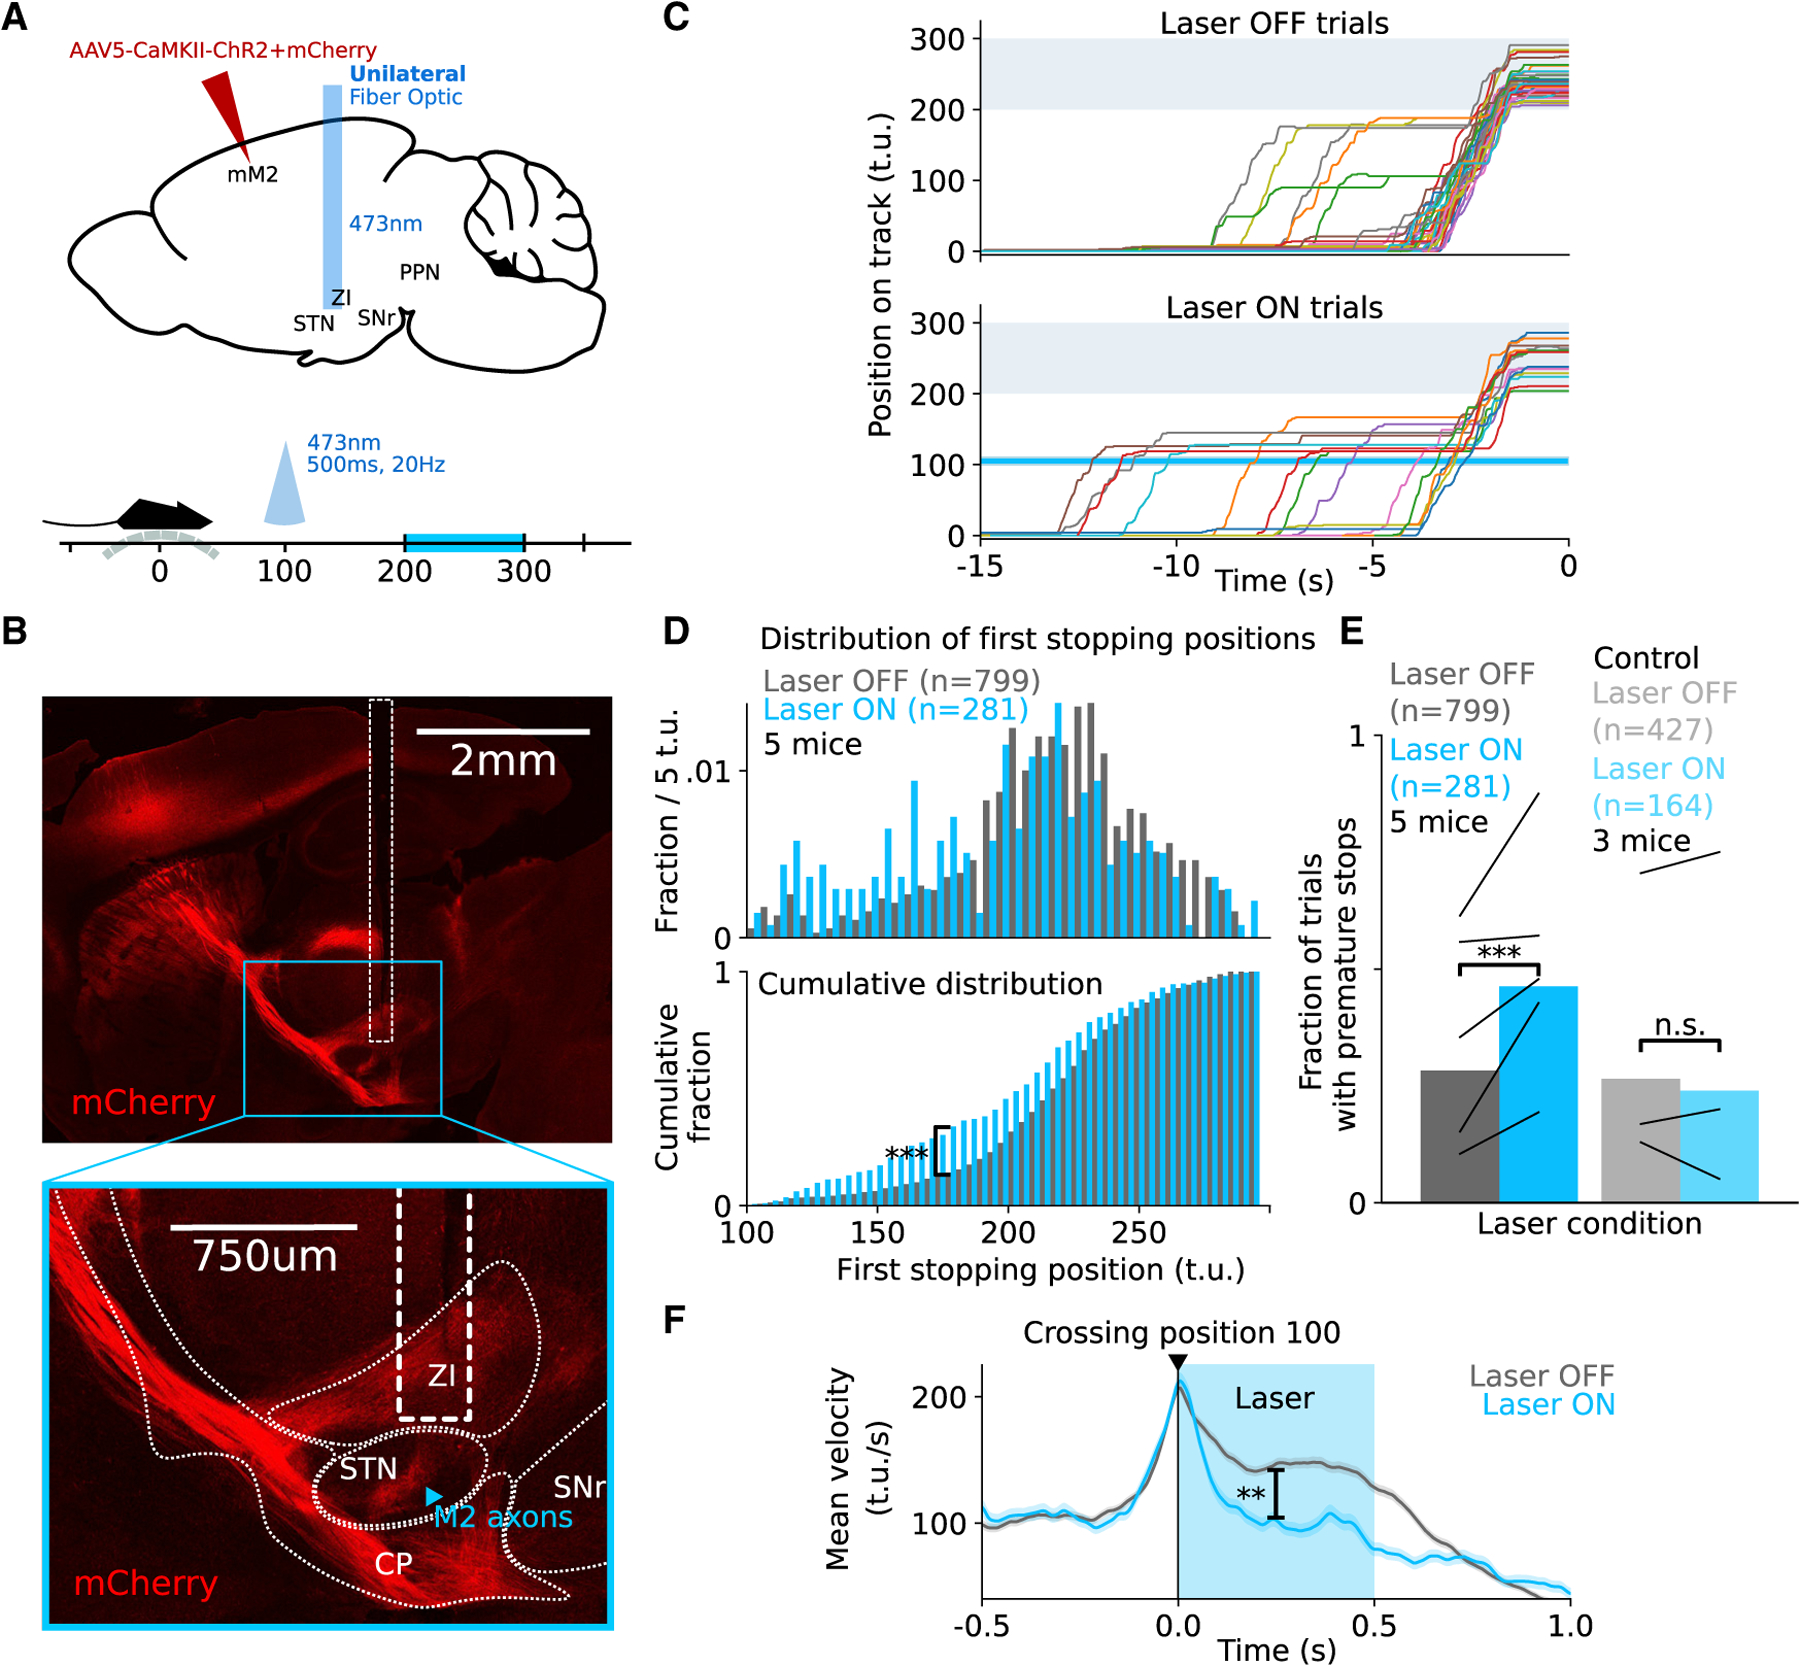
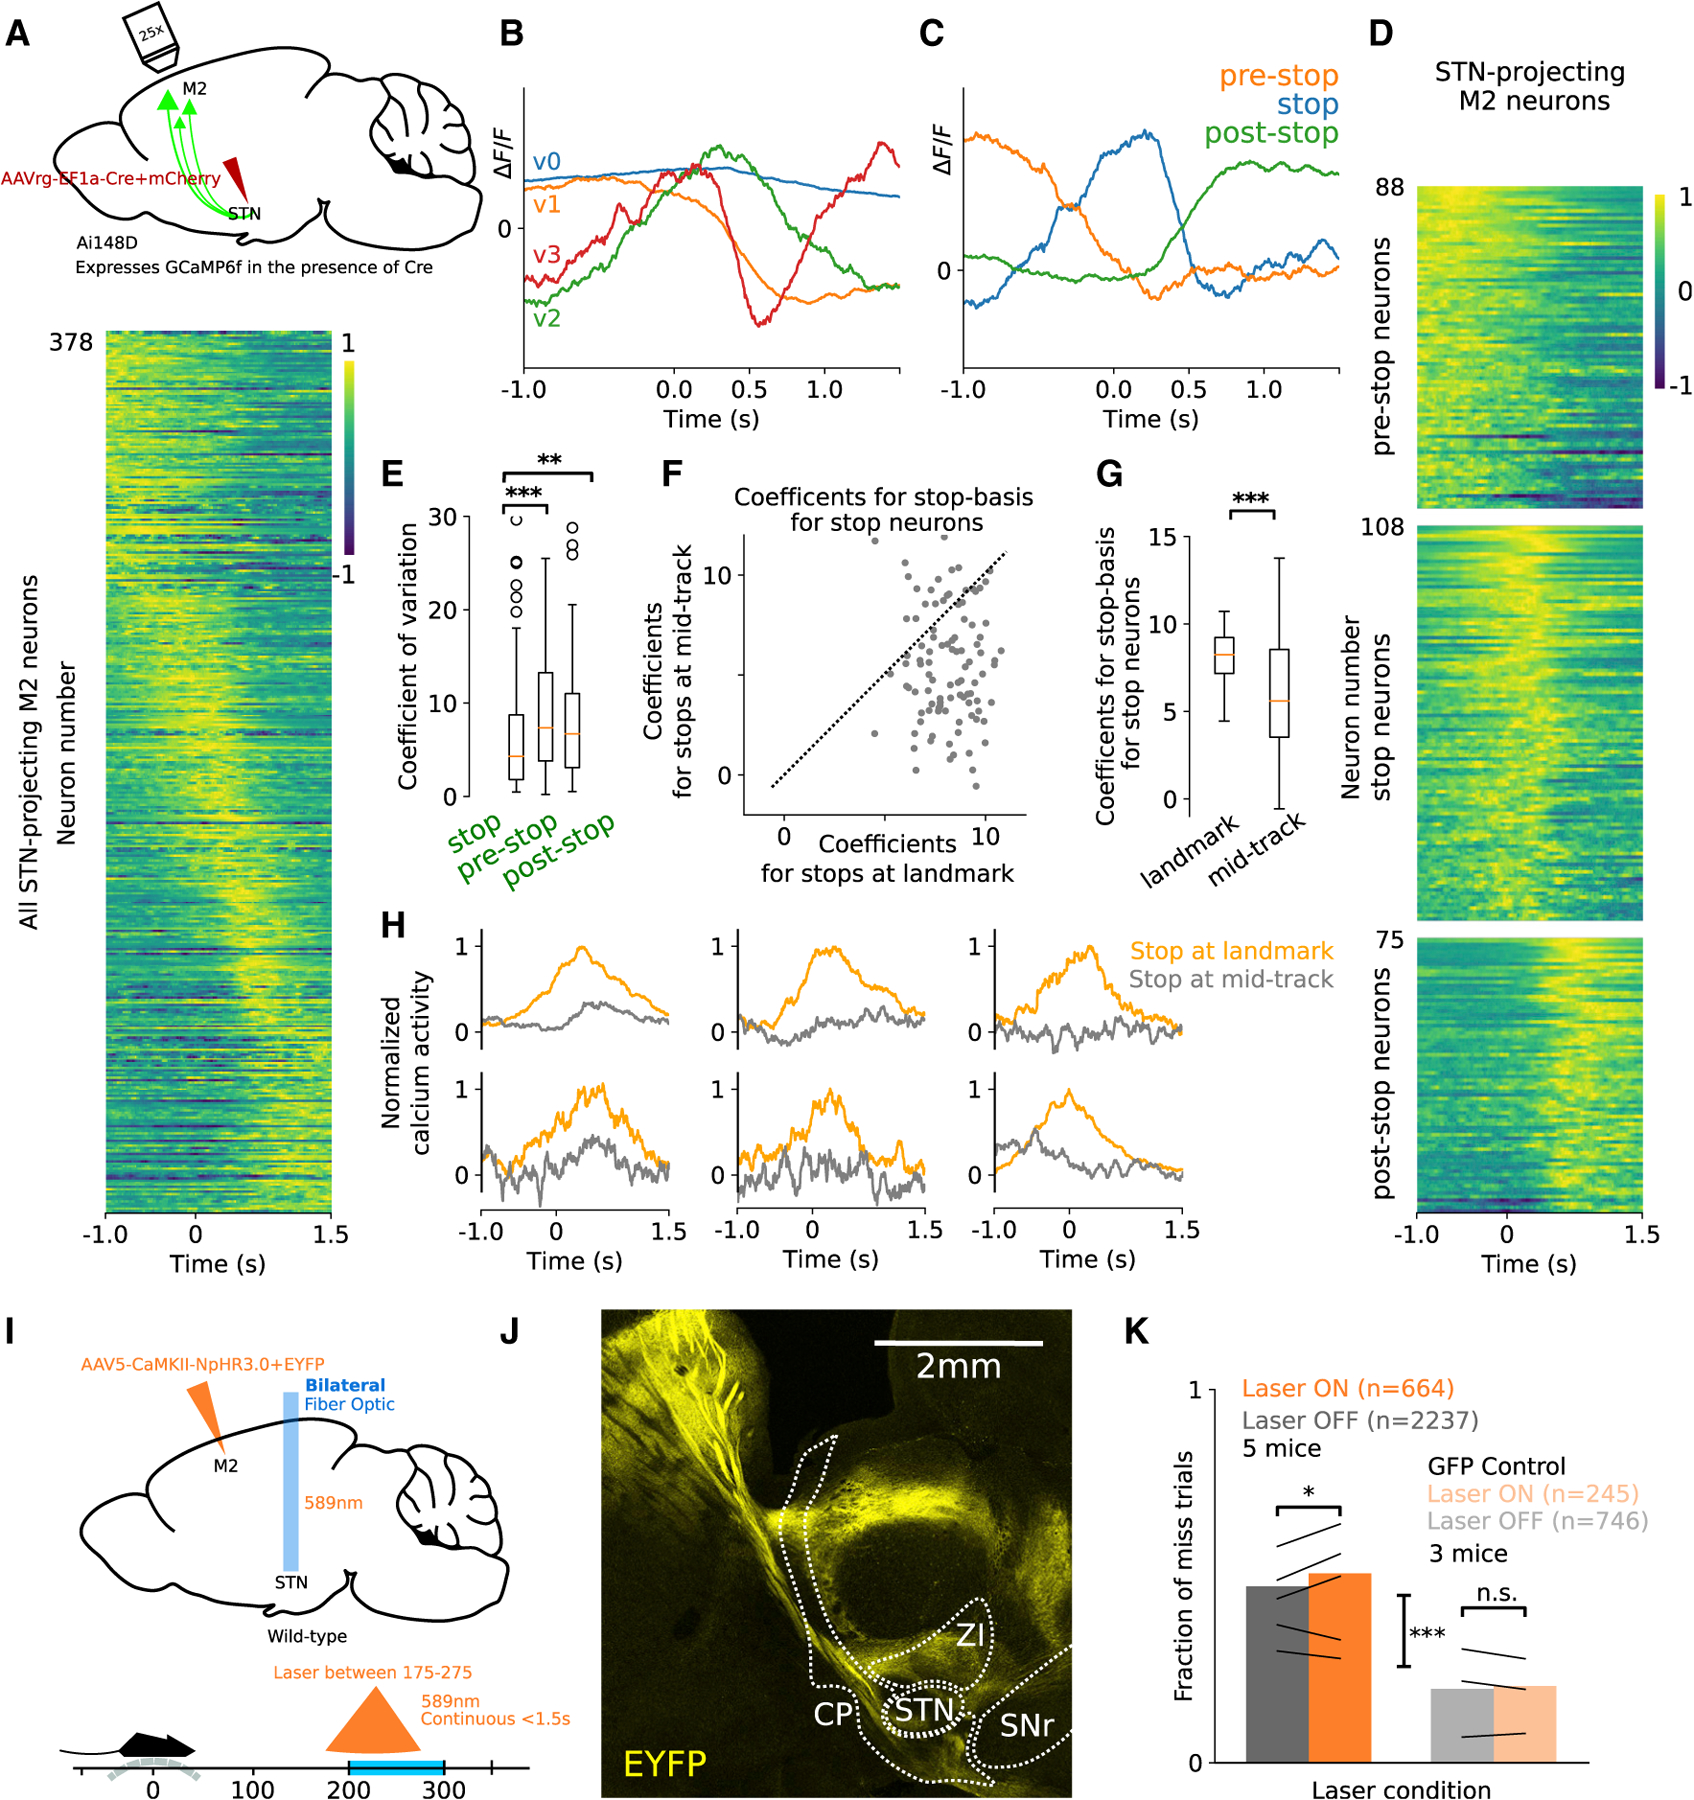
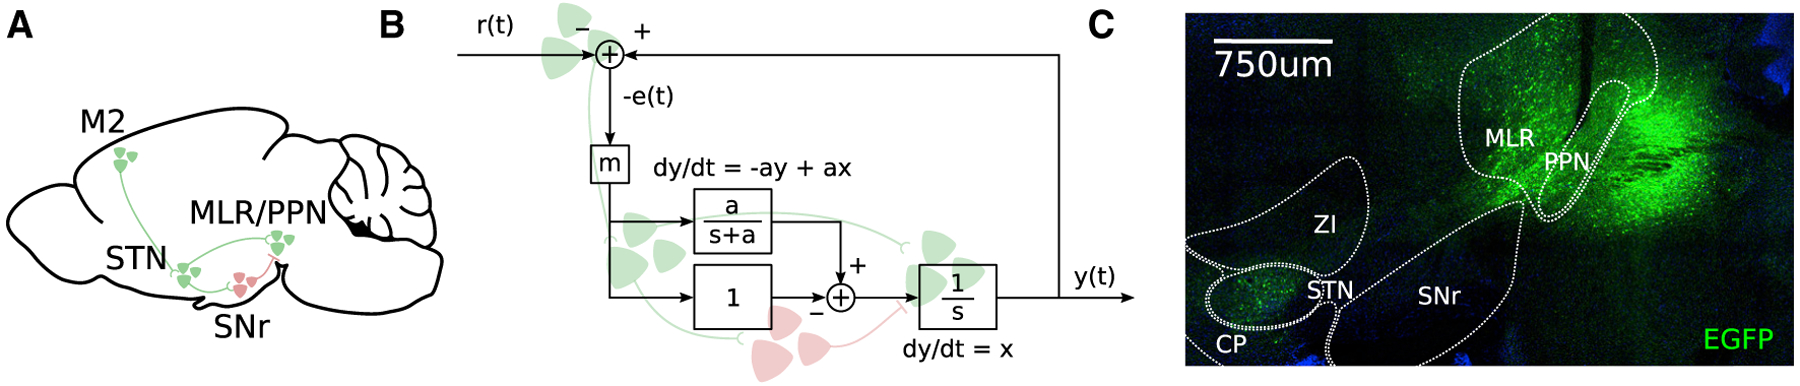
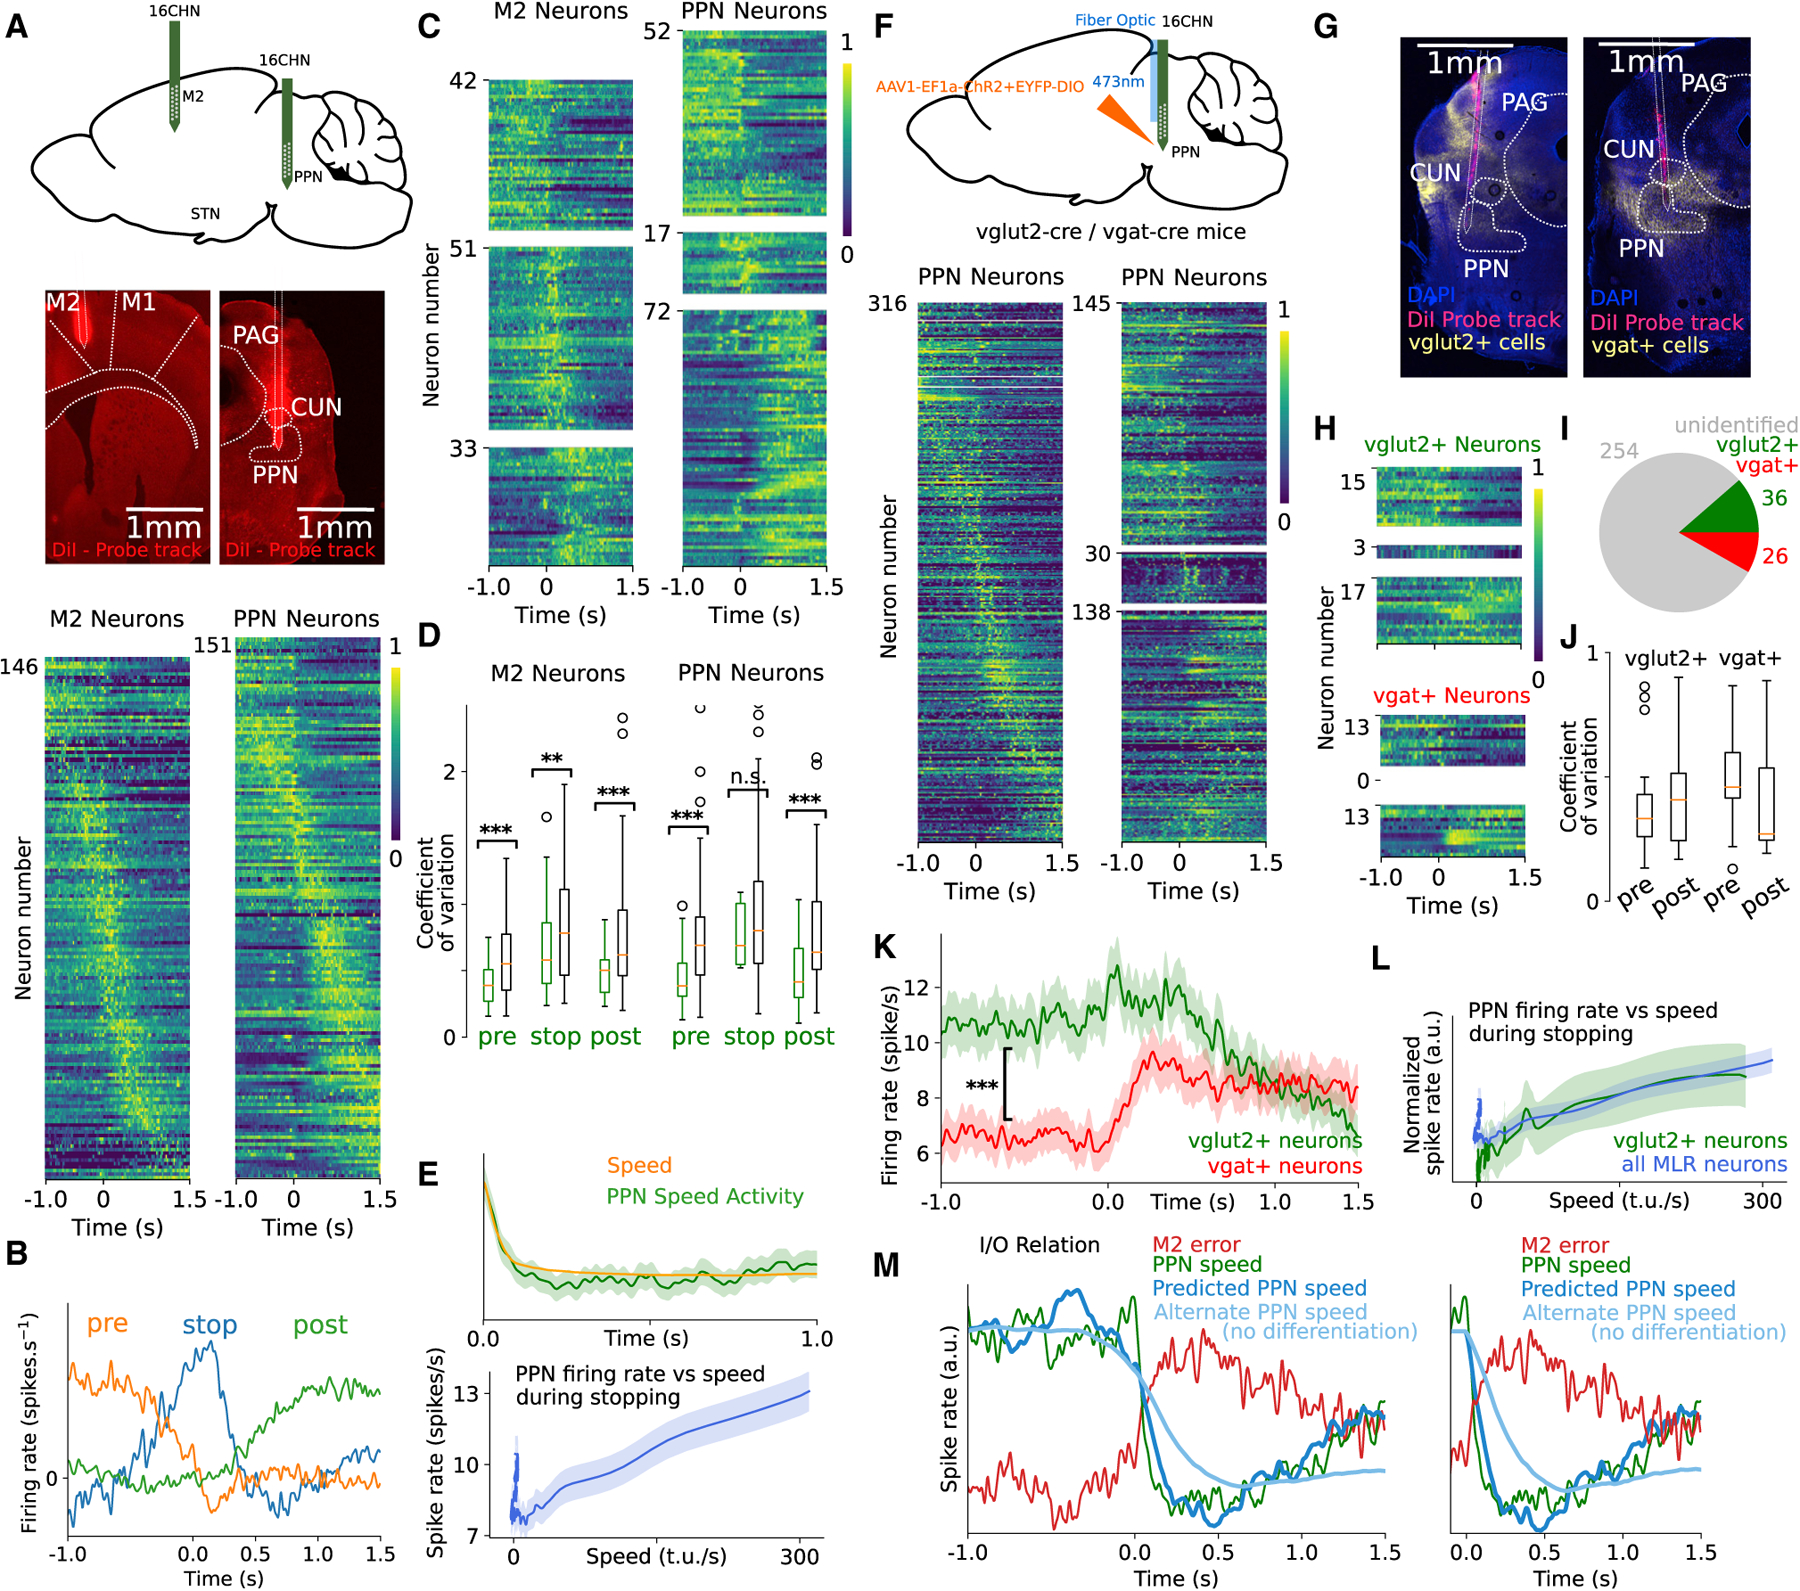
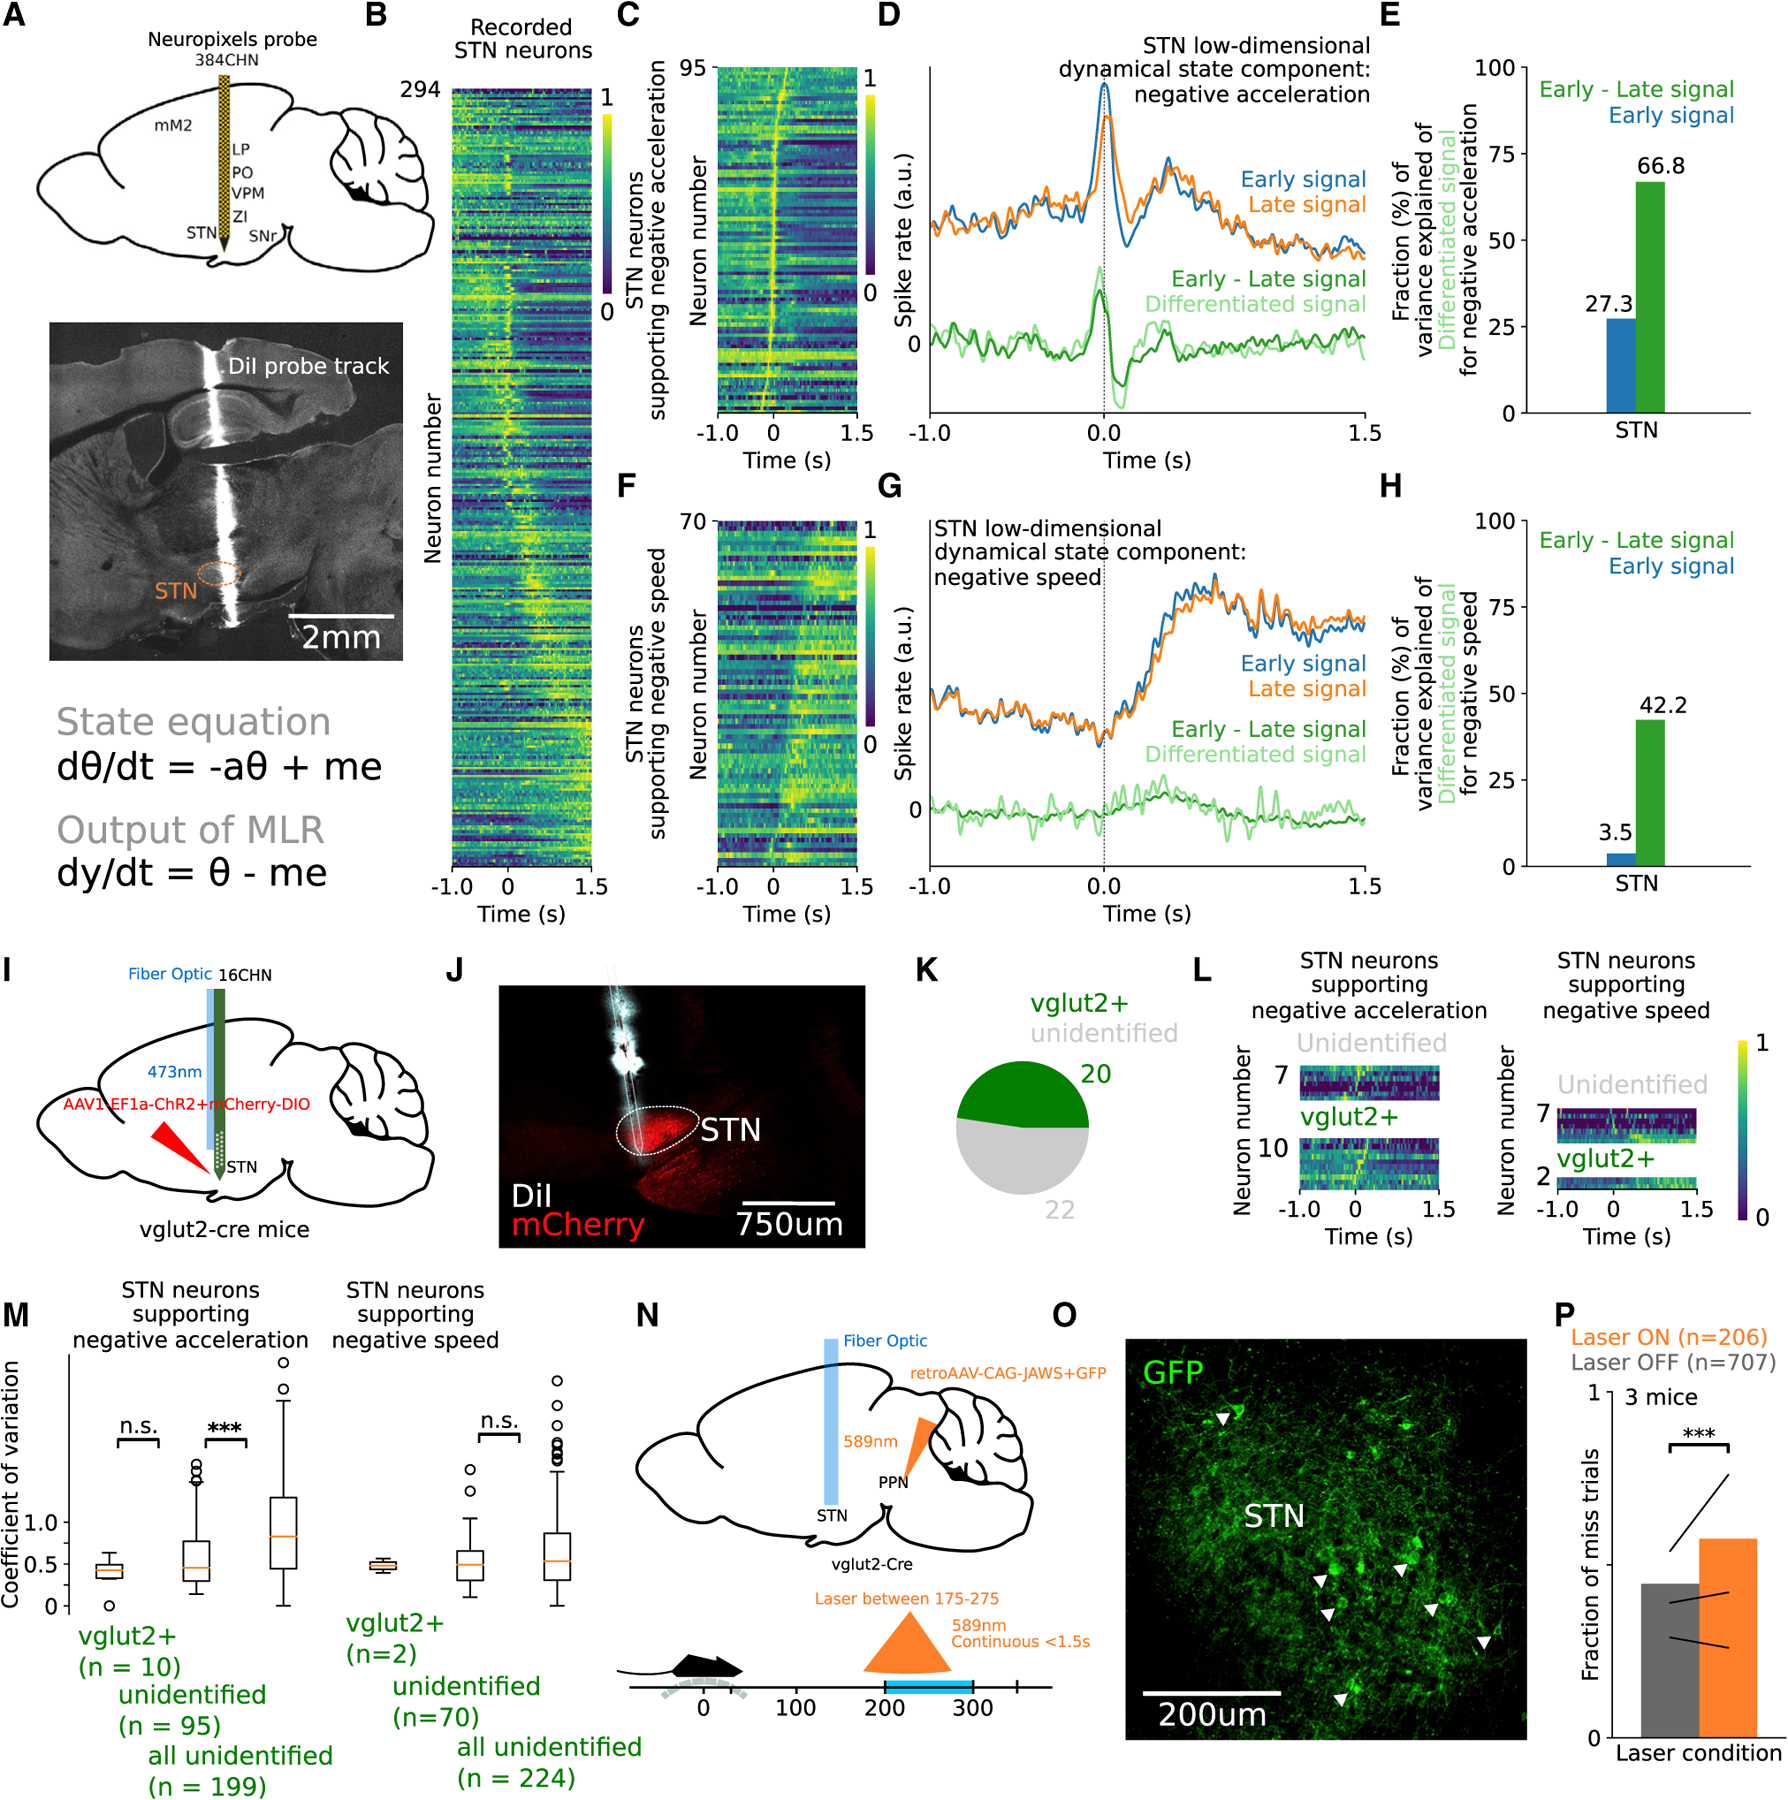
Goal-directed locomotion requires control signals that propagate from higher order areas to regulate spinal mechanisms. The corticosubthalamic hyperdirect pathway offers a short route for cortical information to reach locomotor centers in the brainstem. We developed a task in which head-fixed mice run to a visual landmark and then stop and wait to collect the reward and examined the role of secondary motor cortex (M2) projections to the subthalamic nucleus (STN) in controlling locomotion. Our behavioral modeling, calcium imaging, and optogenetics manipulation results suggest that the M2-STN pathway can be recruited during visually guided locomotion to rapidly and precisely control the pedunculopontine nucleus (PPN) of the mesencephalic locomotor region through the basal ganglia. By capturing the physiological dynamics through a feedback control model and analyzing neuronal signals in M2, PPN, and STN, we find that the corticosubthalamic projections potentially control PPN activity by differentiating an M2 error signal to ensure fast input-output dynamics.

Keywords: CP: Neuroscience; controller; dynamical system; hyperdirect pathway; landmark; locomotion; mesencephalic locomotor region; pedunculopontine nucleus; secondary motor cortex; stopping; subthalamic nucleus; visually guided.


Conflict of interest statement

Declaration of interests The authors declare no competing interests.

Figures

Figure 1.
Figure 1.. Mice were trained to run, stop, and wait at visual landmarks to collect reward
(A) Schematic showing the task design. Position is defined in terms of track units (t.u.), with 200 t.u. corresponding to 12 cm. (B) Graph showing the distance at wait from starting position versus the distance from the landmark at the beginning of each trial. The color gradient indicates the frequency of stopping at the corresponding distance. The white lines indicate the beginning and end of the landmark. The distance of the landmark from the initial position does not affect the final stop position of the animal, indicating that the animals are using the visual cues, instead of relying on other mechanisms. N = 10 mice, 3 sessions each, between 100 and 250 hit trials each. (C) Example data showing the position of a mouse on the track and its underlying speed for 9 trials. The blue- and green-shaded area indicates landmark position and potential starting position, respectively.
Figure 2.
Figure 2.. The behavior suggests a sudden switch in locomotion state
(A) Left: Formulation of the behavior as a minimumtime optimal-control problem. The mouse is tasked to select a locomotor plan (ut) that minimizes the time required to collect reward. The locomotor plan dictates the speed of the animal, and the relation is governed by a first-order ordinary differential equation, parametrized by a time constant τ. Furthermore, the locomotor plan, and therefore the speed, are bounded and cannot be infinite. Right: The optimal solution is a bang-bang control policy, where ut starts at its maximum and suddenly switches to its minimum. (B) Examples of speed traces in landmark-stop windows aligned to the last peak in velocity before stopping, indicating the “switching point” (30 trials drawn from all of the sessions across animals. N = 10 mice, 3 sessions each). (C) Graph of the average speed, position, lick rate, and model fits (dashed line) to actual data (continuous line) for speed and position in the period immediately following the switching point (N = 10 mice, 3 sessions each). Modeled position and speed using the equation in (A) identified a time constant τ = 63.75 ms are depicted with dark blue and red dashed lines. Predicted position and speed with τ = 1 s are depicted with light blue and light red dashed lines. The shaded regions correspond to the standard deviation of the sampled distribution. N = 10 mice, 3 sessions each.
Figure 3.
Figure 3.. Activating M2 axons in STN leads to stopping
(A) An AAV virus expressing ChR2 was unilaterally injected in M2 of wild-type mice (N = 5 mice) and an optic fiber implanted over STN (ipsilateral to the injection site) to optogenetically target M2 axons in STN. On pseudorandom trials, blue light (473nm) was presented for 500 ms at 20 Hz as soon as the animal crossed track position 100. (B) M2 projects directly to STN via the hyperdirect pathway. The image shows the projections (mCherry) and a fiber-optic placement. (C) Position traces showing laser on and off hit trials aligned to reward time for 1 session in 1 animal. The blue line indicates the position at which the laser is turned on. To ensure enough running distance to position 100 and have it be a midpoint, the optogenetics sessions were performed at a fixed starting position of 0, although mice were trained on variable landmark distance. (D) Plots showing the distribution of the first position the animal stops at after position 100 (N = 5 mice). We observe a shift in the distribution, toward position 100, indicating that during laser on trials, the animal stopped prematurely (Kolmogorov-Smirnov test, ***p = 4.76e−8 < 0.005). (E) Plot showing the fraction of hits trials with premature stops (stopping first before position 200) (N = 5 mice) during laser on and off trials (permutation test, ***p = 0.0 < 0.005) and for control experiments (N = 3 mice) expressing GFP instead of ChR2 during laser on and off trials. (F) Plot showing the average speed of the animal (N = 5 mice) in laser on and off trials aligned to the time of crossing position 100, with a significant difference between laser on and off trials after crossing position 100 (Mann-Whitney U test, **p = 0.0034). The blue-shaded area shows the period in which the laser is delivered. The peak of velocity at position 100 is an effect from averaging; as speed fluctuates, it is high while the animal is crossing position 100. Averaging will then yield a high average speed at position 100, and lower average elsewhere where peaks and troughs in speed are averaged.
Figure 4.
Figure 4.. Stop activity is seen in STN-projecting M2 neurons at landmark stops but not at mid-stops
(A) Top: An AAV virus was injected in STN of Ai148D mice (N = 4 mice, applicable to A–H) to retrogradely express Cre, and thereby GCaMP6f in M2 neurons projecting there. Bottom: Plot showing the normalized average calcium activity of labeled M2 neurons within landmark-stop windows aligned to the switching point. (B) Graph showing a basis for a 4-dimensional subspace that captures >70% of the energy in the responses, all pooled together. (C) Graph showing 3 templates of ideal neuronal responses, derived through a change of basis from the templates in (B), that are selectively active in different epochs in the task: before stops (pre-stop), during stops (stop), and after stops (post-stop). Each neuronal response can then be expressed as a weighted combination of these 3 templates. (D) Plot showing neurons (n = 271), whose neural response energy (area under the squared signal) was >80% explained by the subspace, clustered into 3 groups (pre-stop, stop, and post-stop) using the templates in (B). (E) Boxplots showing the reliability of neuronal responses during the stop period for each of the 3 clustered populations in (D). High reliability is measured by a low coefficient of variation. Stop neurons show a significantly higher reliability compared to pre-stop (Mann-Whitney U test, ***p = 6.3e−4 < 0.005) and post-stop neurons (Mann-Whitney U test, *p = 0.011 < 0.05). (F) Scatterplot of the coefficient of contribution of the stop template in (C) in spontaneous stops versus landmark stops. Each data point represents a stop neuron (N = 108) taken from (D), and the coefficient represents the energy of the response along the dimension of the template, obtained by taking the dot product of the calcium response with the stop template. Landmark stops have a higher coefficient than spontaneous stops, indicating that the stop template has a greater contribution to responses during landmark stops. (G) Boxplots for the distribution of the coefficients in (F). The orange lines represent the respective medians. The means of the distributions are significantly different (paired t test, ***p = 1.09e−6). (H) Examples of the calcium activity of 6 M2 neurons projecting to STN during stops at the landmark and in the middle of the track. The response for spontaneous stops is normalized to the maximum value of the corresponding response for landmark stops. (I) An AAV virus expressing NpHR3.0 was bilaterally injected in M2 of wild-type mice (N = 5 mice) and optic fibers were bilaterally implanted over STN to optogenetically target M2 axons in STN. On pseudorandom trials, amber light (589 nm) was presented continuously starting at position 175 for either 1.5 s or until the animal crossed position 275, whichever occurred first. (J) Sagittal section showing M2-STN projections expressing EYFP and NpHR3.0. (K) Plot showing the fraction of miss trials (N = 5 mice) during laser on (inhibiting M2-STN axons), during laser off trials (permutation test, *p = 0.045 < 0.05), and during laser off/on trials for control experiments (N = 3 mice) expressing GFP instead of NpHR3.0 (permutation test, ***p = 0.0 < 0.005).
Figure 5.
Figure 5.. Behavioral dynamics can be physiologically realized through feedback control
(A) Schematic showing the implicated neural circuit, with green and red indicating excitatory and inhibitory cells, respectively. Activity through the corticosubthalamic projection can reach the MLR/PPN either through a direct STN-PPN projection or via an STN-SNr-PPN pathway. (B) Control theoretic model of corticosubthalamic activity that enables rapid control of locomotion. Each box indicates a transfer function in the Laplace s-domain and is labeled with the corresponding input-output relation, with x, y, and t denoting input, output, and time. The pathways bifurcating from STN interact to simulate mathematical differentiation, canceling the slow integrative dynamics of the PPN. (C) Sagittal slice showing STN Vglut2+ neurons projecting to PPN. An AAVrg-EF1a-DO_DIO-tdTomato_EGFP virus was injected in PPN of Vglut2-Cre animals (N = 3 mice) to retrogradely express EGFP in Vglut2+ neurons projecting to PPN.
Figure 6.
Figure 6.. Fast input-output neuronal dynamics are enabled by mathematical differentiation
(A) Top: We recorded extracellular single-unit activity using two 16-channel silicon probes, simultaneously, in M2 and PPN of wild-type mice (N = 4 mice, applicable to A–E).Center: Coronal sections showing DiI recording probe track in M2 and PPN. Bottom: Plot showing the normalized average firing rate of M2 and PPN neurons, within landmark-stop windows aligned to the switching point. (B) Graph showing 3 templates of ideal neuronal responses related to 3 epochs in the task: pre-stop, stop, and post-stop. Each neuronal response can be expressed as a weighted combination of these 3 templates. (C) Plots of all of the neurons whose neural response energy (area under the squared signal) was more than 80% explained by the subspace, clustered into 3 groups (pre-stop, stop, and post-stop, from top to bottom) using the templates in (B). The stop-related activity is significantly more prominent in M2 compared to PPN, comprising 40.5% (51 of 126) of the neurons in M2 versus 12.1% (17 of 141) in PPN (chi-square test, p = 3.5e−14 < 0.005). (D) Boxplots showing the reliability of neuronal responses during the pre-stop, stop, and post-stop period for M2 and PPN neurons. The reliability of each of the 3 clustered populations in (C) is computed in its corresponding epoch (e.g., the reliability of the pre-stop cluster is computed at the pre-stop epoch) and compared to that of the remaining neurons. High reliability is measured by a low coefficient of variation. Clustered neurons show increased reliability for their corresponding epoch (Mann-Whitney U test, ***p < 0.005, **p < 0.01), with stop PPN neurons showing a non-significant difference from the remaining neurons (Mann-Whitney U test, p = 0.329). (E) Top: Plot superposing the speed of the animal and the speed-related PPN neural response following the switching point. Bottom: Plot showing the speed-related PPN neural response plotted against the speed of the animal, following the switching point. The dashed red line is fit through linear regression to the data during the first second after the switching point (R2 = 0.829 p = 5.36e−78). Activity in PPN is linearly related to the speed of the animal during locomotion halts (N = 4 mice). (F) Top: ChR2 was expressed in a Cre-dependent manner in PPN neurons of Vglut2-Cre and Vgat-Cre mice (N = 3 mice for each line, applicable to F–M). An optic fiber coupled with a recording probe was lowered above PPN to identify Vglut2+ and Vgat+ PPN cells expressing ChR2 while recording. Bottom: Plots showing all of the neurons recorded during phototagging and their clustering into 3 clusters as in (C). (G) Coronal sections showing DiI probe track location and ChR2 expression (mCherry) in Vglut2+ and Vgat+ PPN cells. (H) Plots showing the 3 clusters of Vglut2+ and Vgat+ identified cells as clustered in (C). (I) Plot showing the fraction of unidentified, Vglut2+, and Vgat+ cells among all recorded cells, before applying the clustering in (F) and (H). (J) Boxplots showing the reliability of neuronal responses for pre- and post-stop neurons during the pre- and post-stop epochs, respectively. Vglut2+ neurons show higher reliability in pre-stop neurons (Mann-Whitney U test, n.s. p = 0.325), while Vgat+ cells show higher reliability in post-stop neurons (Mann-Whitney U test, n.s. p = 0.129). (K) Plot showing the average responses of Vglut2+ and Vgat+ neurons, with a significant difference in the pre-stop epoch (Mann-Whitney U test, ***p = 1.6e−37 < 0.005). (L) Plot showing the normalized speed-related PPN neural response of Vglut2+ cells (green) and the cells recorded in (A) (blue) plotted against the speed of the animal, following the switching point. The linear relation observed in (E) extends to Vglut2+ neurons. (M) Left: Plot showing the reconstructed M2 error signal (input), the PPN response (output), and the predicted PPN response using the reconstructed input-output relation (predicted output) starting from 1 s before the stopping onset. The plot also shows an alternative prediction obtained by removing the STN-PPNprojection from the model, where we find that activity cannot decay quickly enough (RMSE computed starting from the switching point, RMSEalternate/RMSEpredicted = 4.45-fold increase). Right: Plot showing the same analysis, but performed starting at the onset of stopping, by forcing the error signal to be zero before time 0, thereby forcing speed decay to initiate only at the onset of stopping (RMSEalternate/RMSEpredicted = 6.63-fold increase).
Figure 7.
Figure 7.. STN supports the dynamical state required to drive the dynamics
(A) Top: We recorded extracellular single-unit activity in the STN of wild-type mice (N = 4 mice, applicable to A–H) using Neuropixels probes. Center: Sagittal section showing the Neuropixels probe placement track (DiI) after recording. Bottom: Equations that dictate the evolution of the dynamical state q, and its interaction with the error signal e to produce a differentiated input y to PPN. The scaling factors a and m represent the time constant and gain in the control diagram of Figure 5B. (B) Plot of the normalized firing rate of STN neurons, within landmark stop windows aligned to the switching point. (C) Plot showing neurons whose activity peaks between 250 ms and after 250 ms of the stop onset. The neurons are ordered by peak timing. (D) Within the population of (C), we recreated 2 low-dimensional signals representing the negative acceleration component of the error signal (early signal) and its dynamical state counterpart (late signal). The difference of these 2 produced a differentiated signal, matching the theoretical prediction. (E) Bar graph showing the variance of the theoretical differentiated signal in (D) explained by the difference between the early and late signals (green) versus that explained by the early signal as if no computation was performed (blue). (F) Plot showing neurons whose activity transitions from low to high between 250 ms before the stop onset and 750 ms after. (G) Within this population of (F), we recreated 2 low-dimensional signals representing the negative speed component of the error signal (early signal) and its dynamical state counterpart (late signal). The difference of these 2 produced a differentiated signal, matching the theoretical prediction. (H) Bar graph showing the variance of the theoretical differentiated signal in (G) explained by the difference between the early and late signals (green) versus that explained by the early signal as if no computation was performed (blue). (I) ChR2 was expressed in a Cre-dependent manner in STN neurons of Vglut2-Cre mice (N = 2 mice, applicable to I–L). An optic fiber coupled with a recording probe was lowered above STN to identify STN cells expressing ChR2 while recording. (J) Sagittal section showing the DiI probe track location and ChR2 expression (mCherry) in Vglut2+ cells in STN. (K) Plot showing the fraction of Vglut2+ identified cells among recorded cells. (L) Plots showing neuronal responses clustered as in (C) and (F) for the recorded cells. (M) Boxplots showing the reliability of neuronal responses during the stop period for STN cells supporting negative acceleration and during the post-stop period for STN cells supporting negative speed. Vglut2+ cells show a reliability similar to the unidentified cells during the stop period (Mann-Whitney U test, n.s. p = 0.236), which show a significant difference in reliability compared to the remaining recorded STN cells, not supporting negative acceleration (Mann-Whitney U test, ***p = 5.4e−7 < 0.005). (N) A retroAAV expressing Jaws in a Cre-dependent manner was bilaterally injected in PPN of Vglut2-cre mice (N = 3 mice), and optic fibers were bilaterally implanted over STN to target the Vglut2+ STN neurons projecting to PPN. On pseudorandom trials, amber light (589 nm) was presented continuously starting at position 175 for either 1.5 s or until the animal crosses position 275, whichever occurs first. (O) Sagittal section showing STN neurons projecting to PPN and retrogradely expressing GFP and Jaws. (P) Plot showing the fraction of miss trials (N = 3 mice) during laser on and off trials (permutation test, ***p = 0.004 < 0.005).

Similar articles

Cited by

References

    1. Aarts E, Verhage M, Veenvliet JV, Dolan CV, and Van Der Sluis S (2014). A solution to dependency: using multilevel analysis to accommodate nested data. Nat. Neurosci 17, 491–496. 10.1038/nn.3648. - DOI - PubMed
    1. Alexander GE, DeLong MR, and Strick PL (1986). Parallel organization of functionally segregated circuits linking basal ganglia and cortex. Annu. Rev. Neurosci 9, 357–381. 10.1146/annurev.ne.09.030186.002041. - DOI - PubMed
    1. Arber S, and Costa RM (2018). Connecting neuronal circuits for movement. Science 360, 1403–1404. 10.1126/science.aat5994. - DOI - PubMed
    1. Aron AR (2011). From reactive to proactive and selective control: developing a richer model for stopping inappropriate responses. Biol. Psychiatry 69, e55–68. 10.1016/j.biopsych.2010.07.024. - DOI - PMC - PubMed
    1. Aron AR, and Poldrack RA (2006). Cortical and subcortical contributions to stop signal response inhibition: role of the subthalamic nucleus. J. Neurosci 26, 2424–2433. 10.1523/JNEUROSCI.4682-05.2006. - DOI - PMC - PubMed

Publication types