

GigaAssay - An adaptable high-throughput saturation mutagenesis assay platform
- PMID: 35905834
- PMCID: PMC9420302
- DOI: 10.1016/j.ygeno.2022.110439
GigaAssay - An adaptable high-throughput saturation mutagenesis assay platform
Abstract
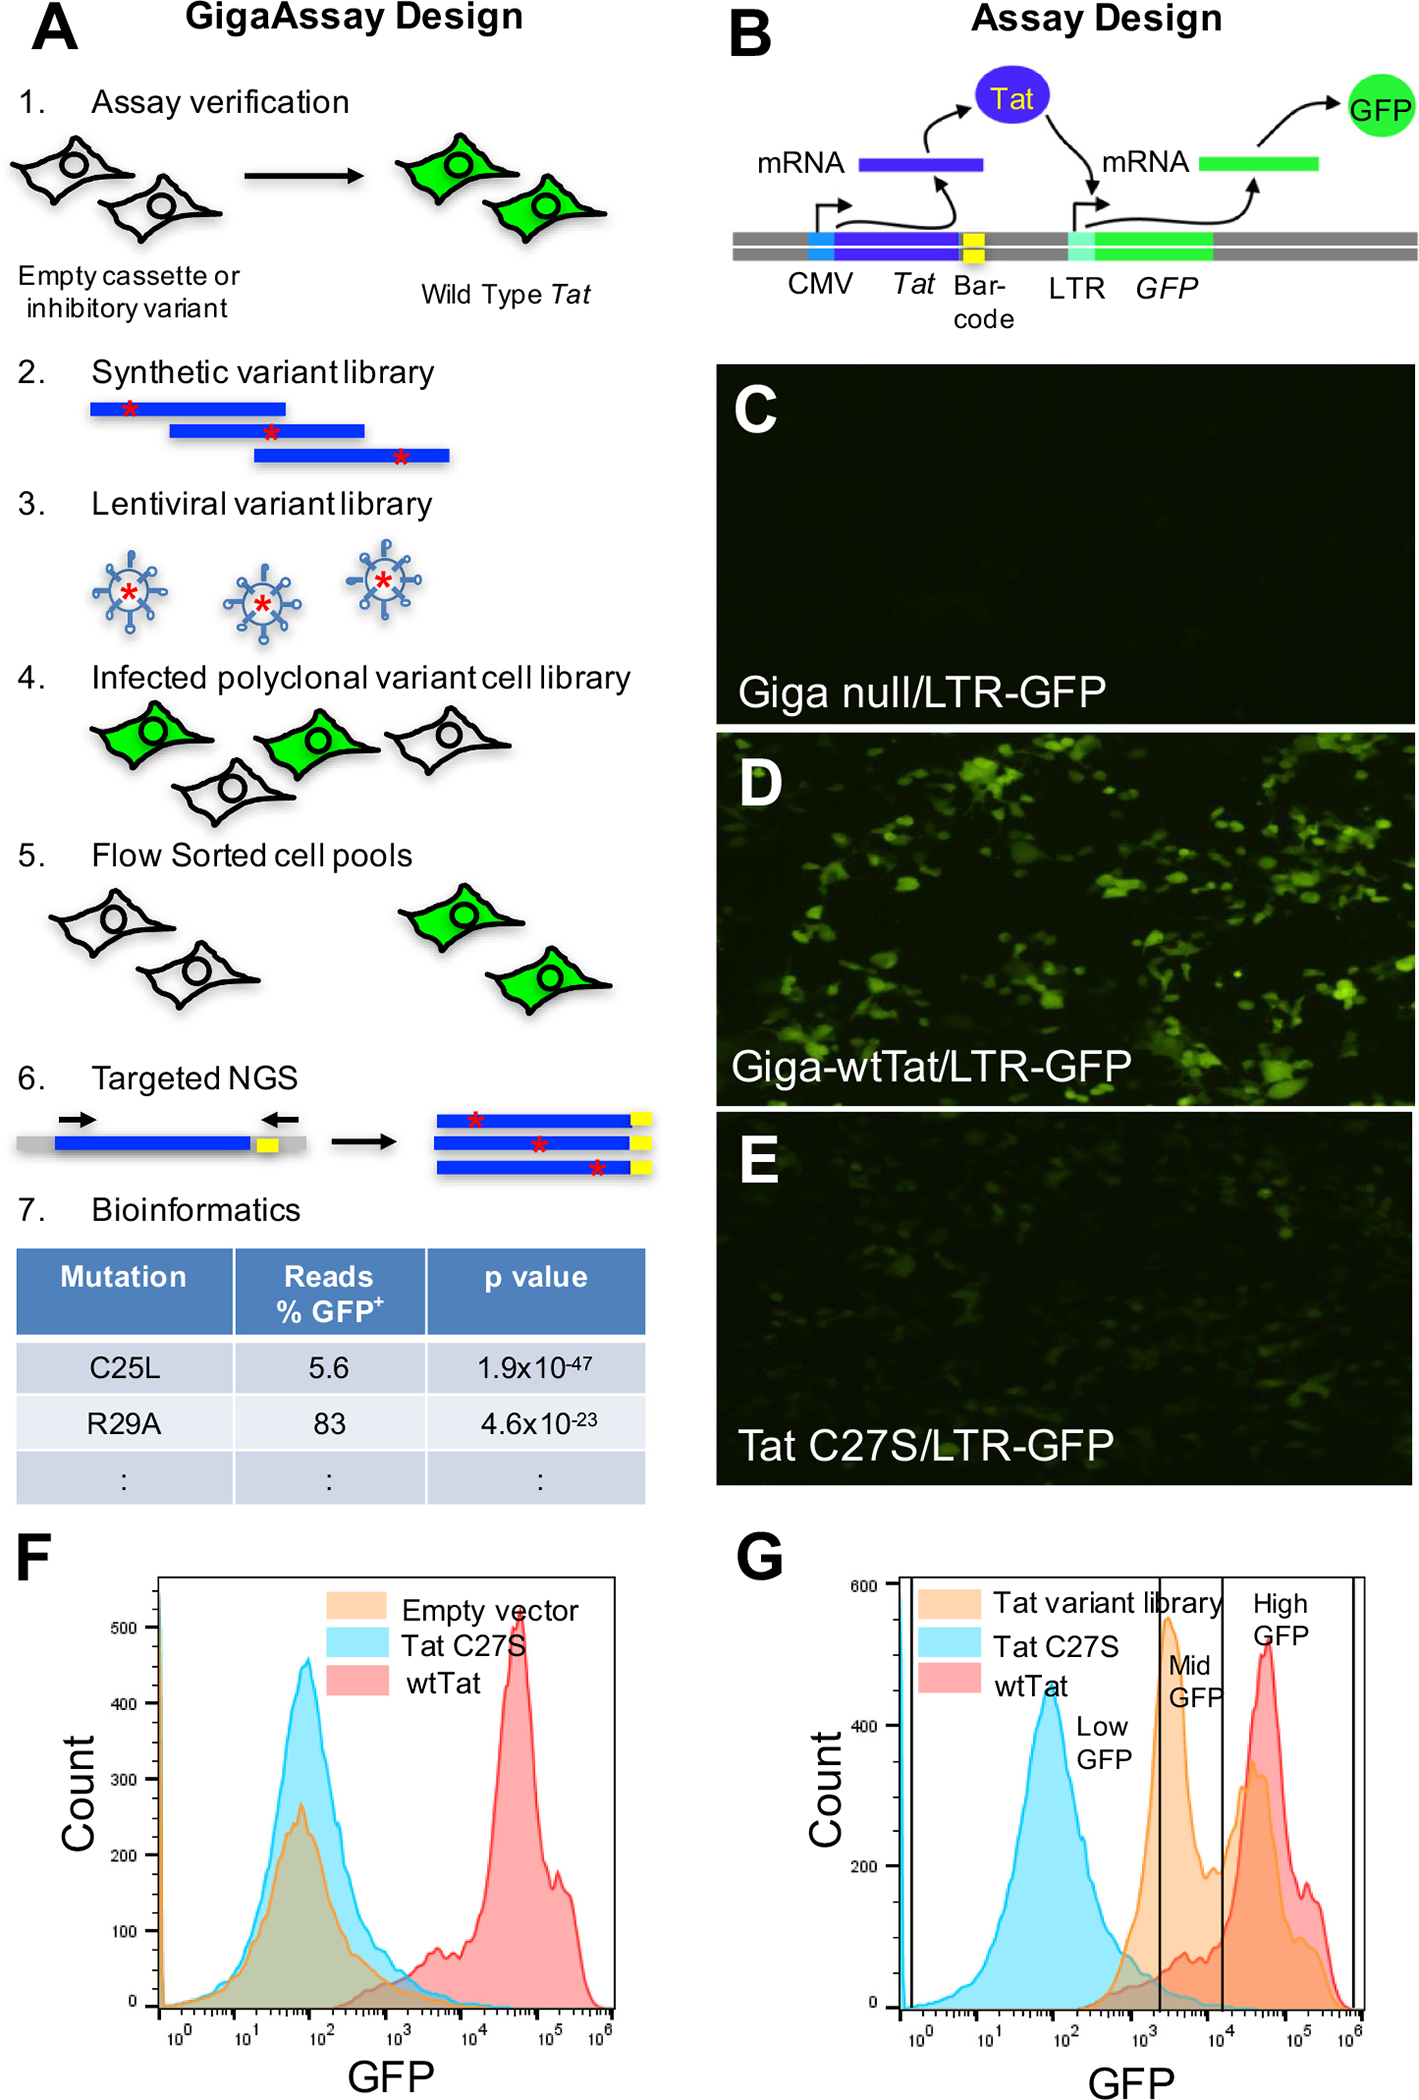
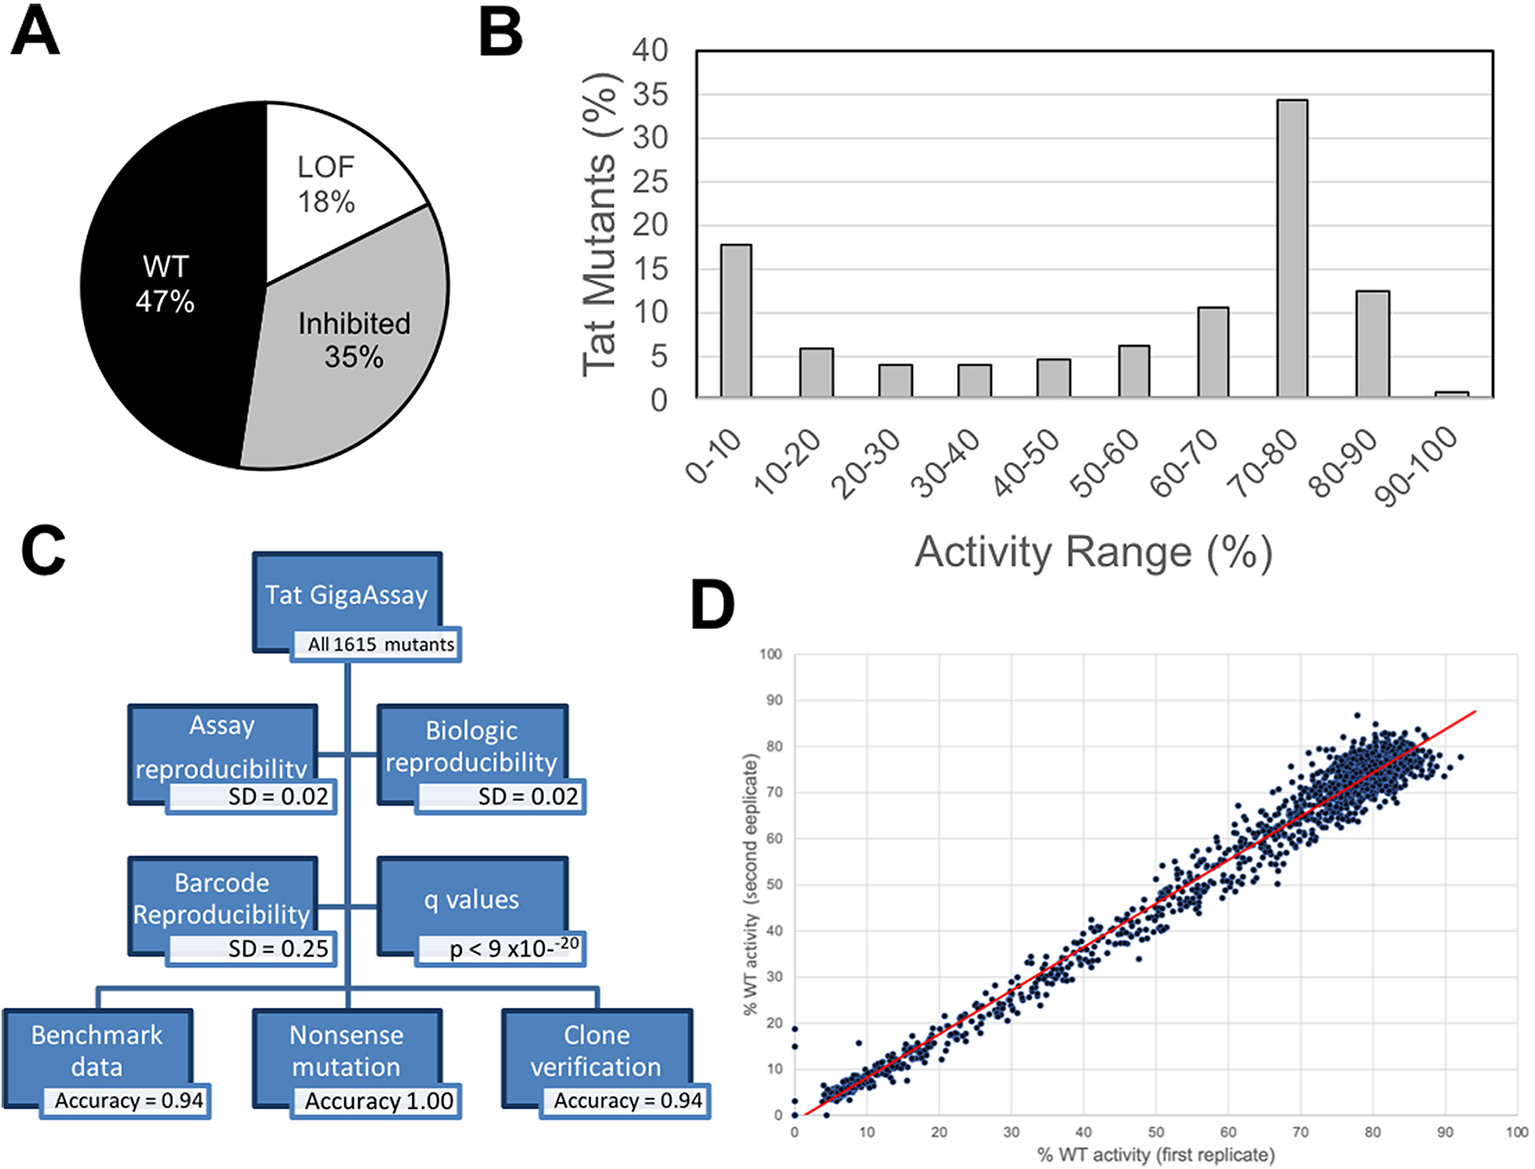
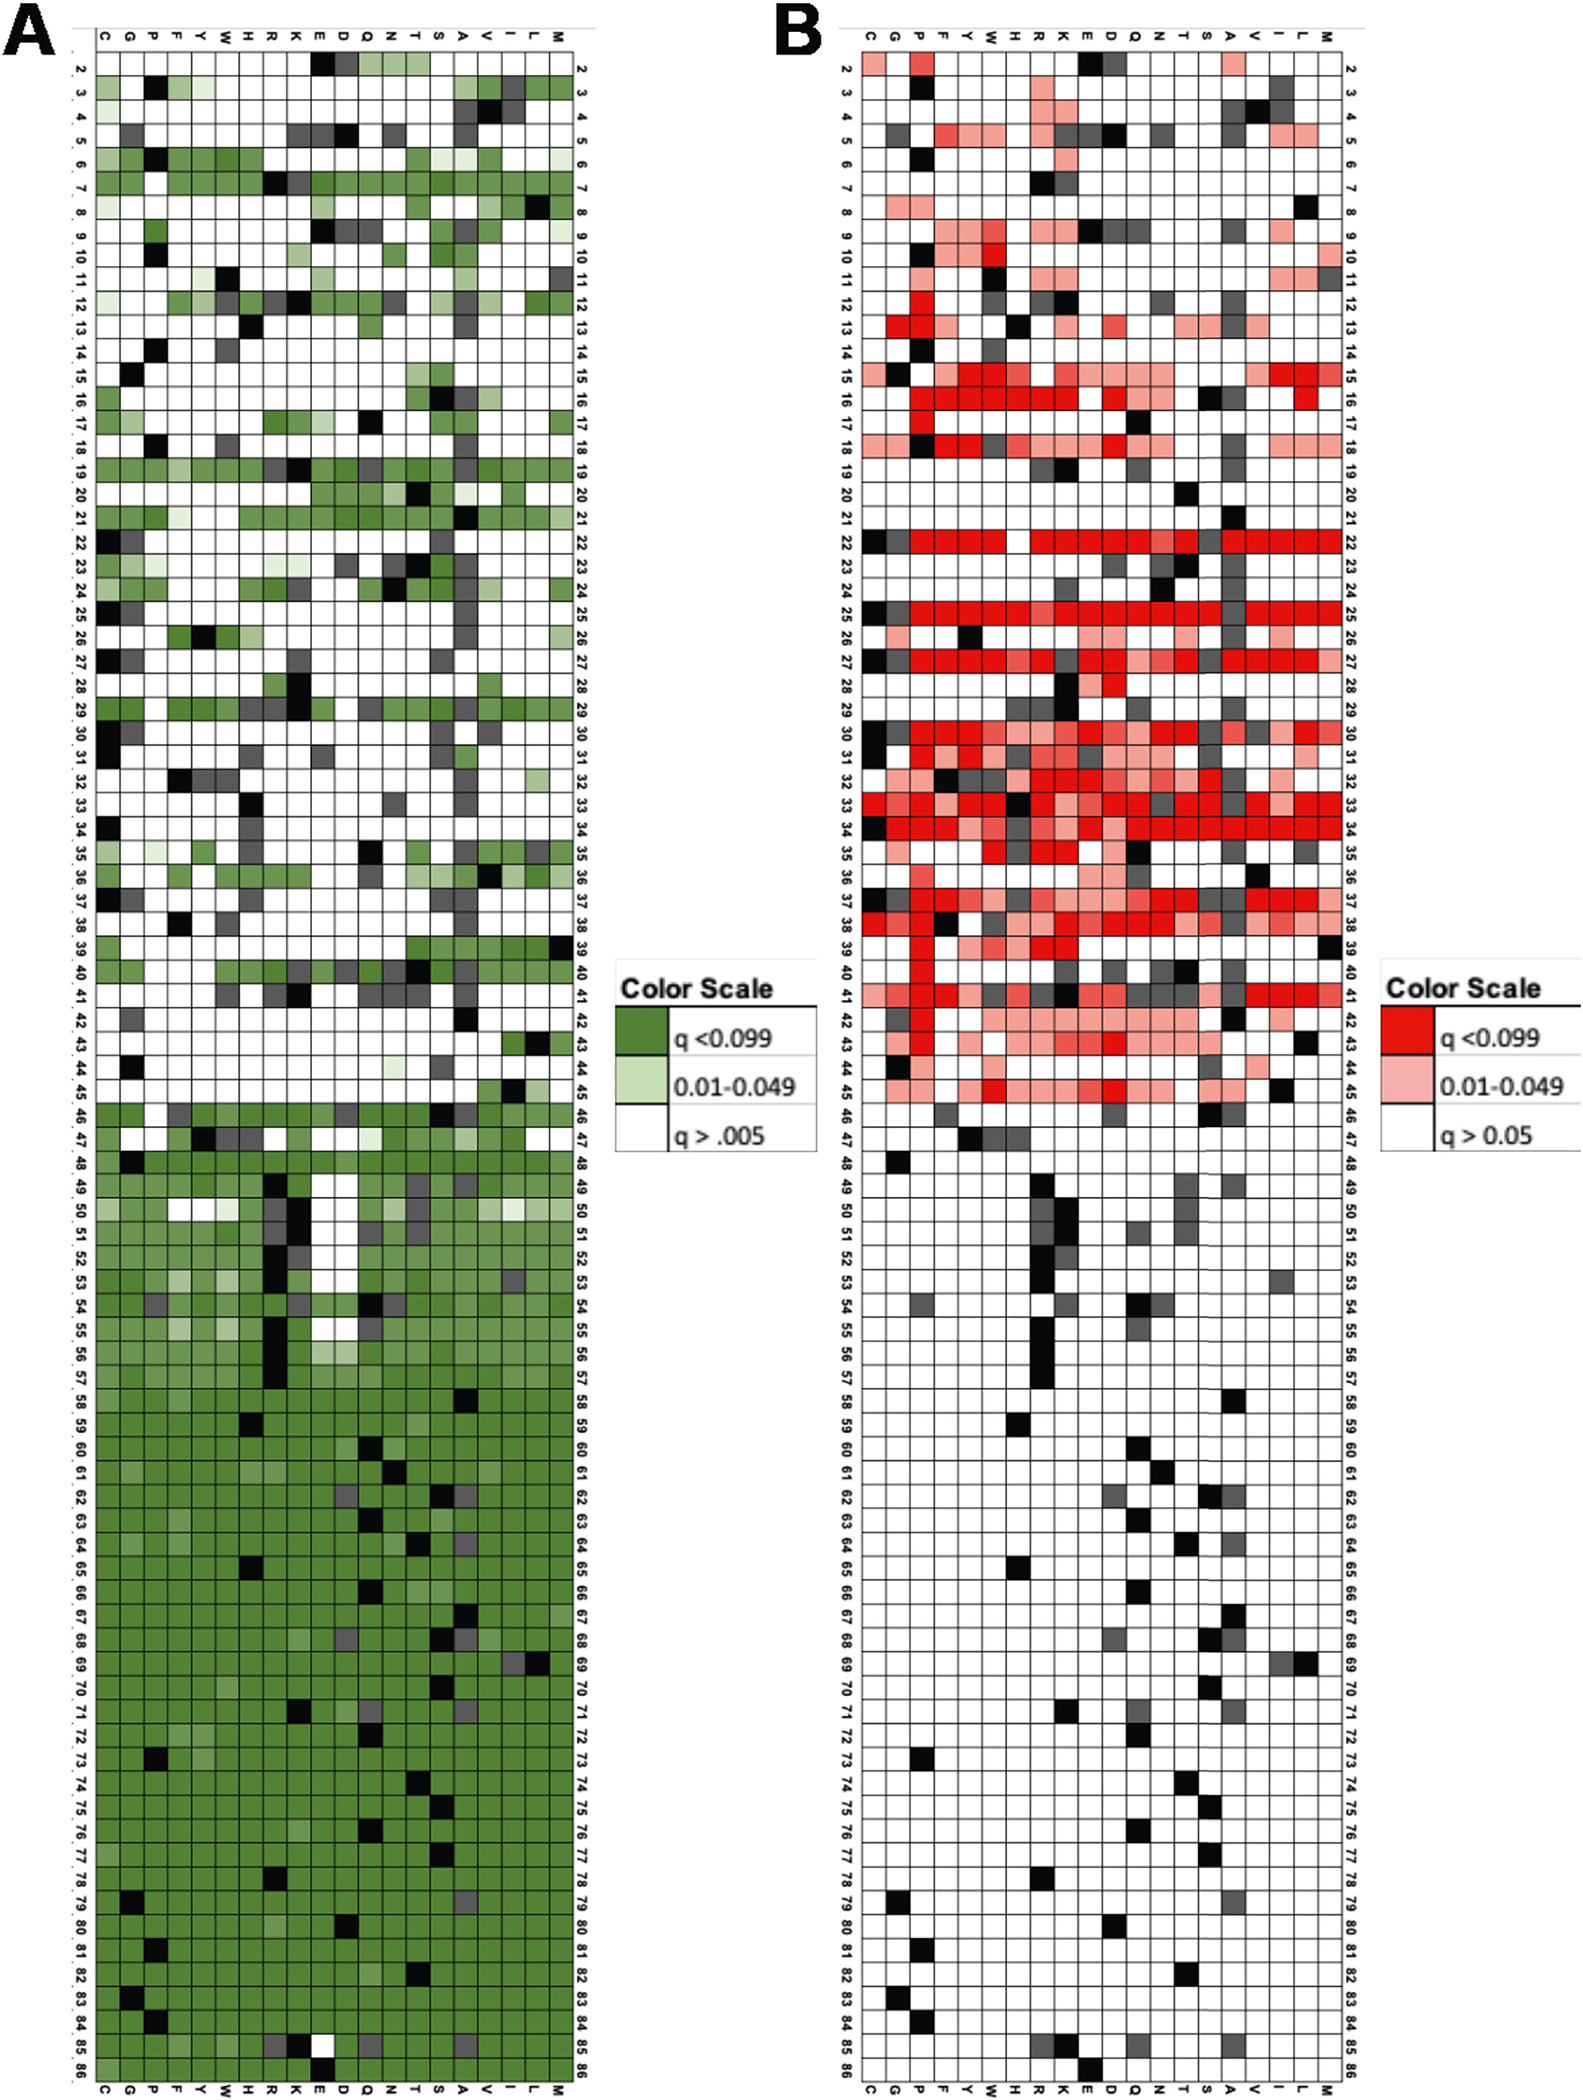
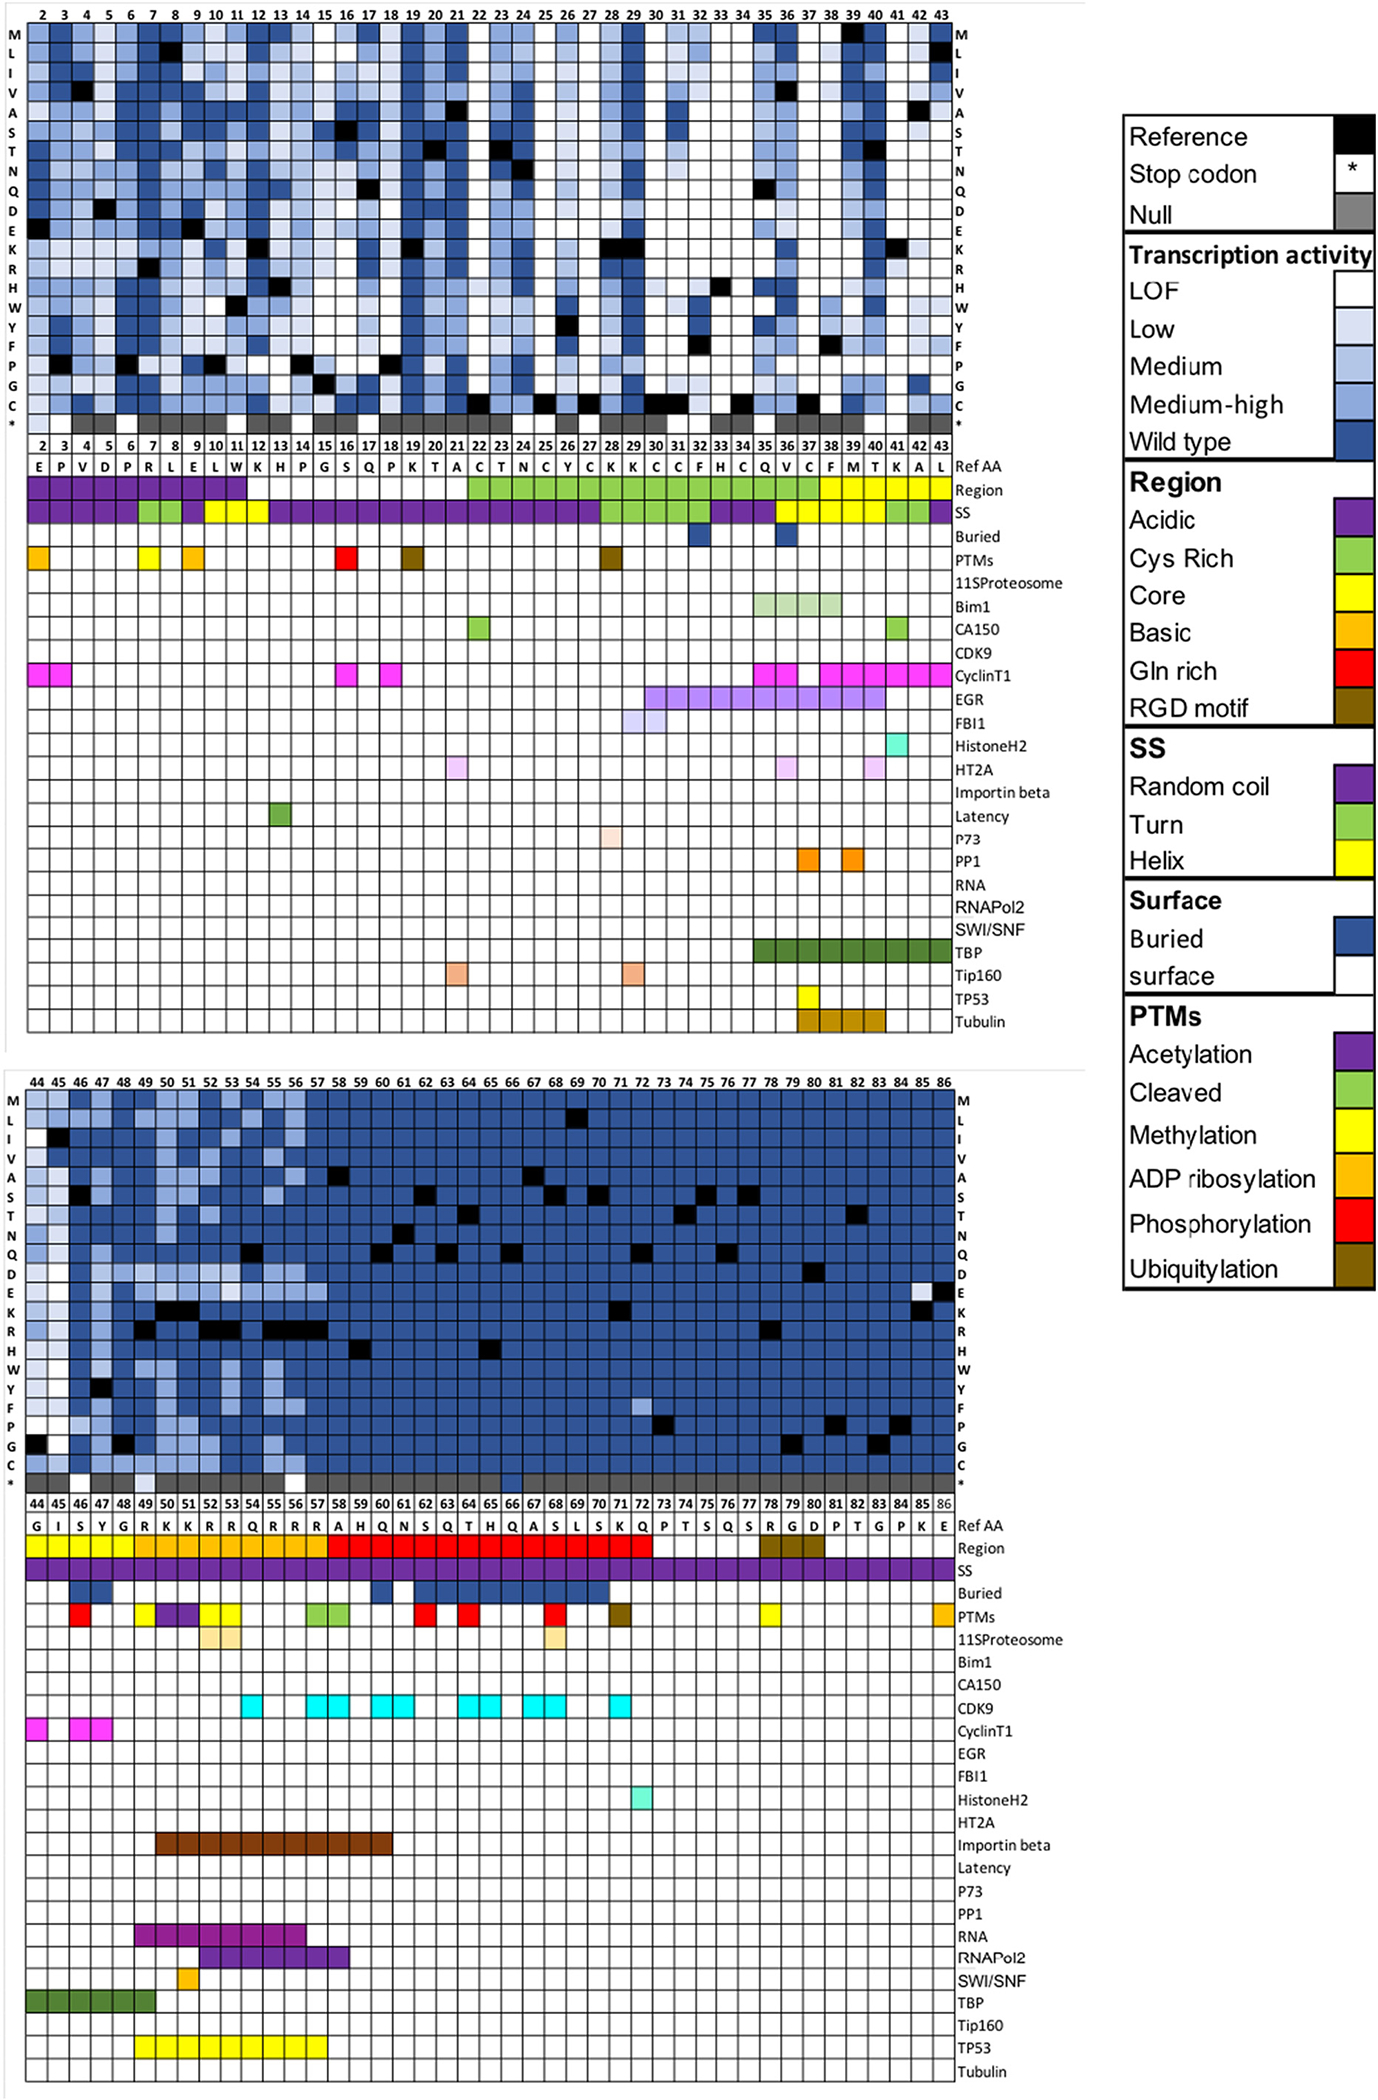
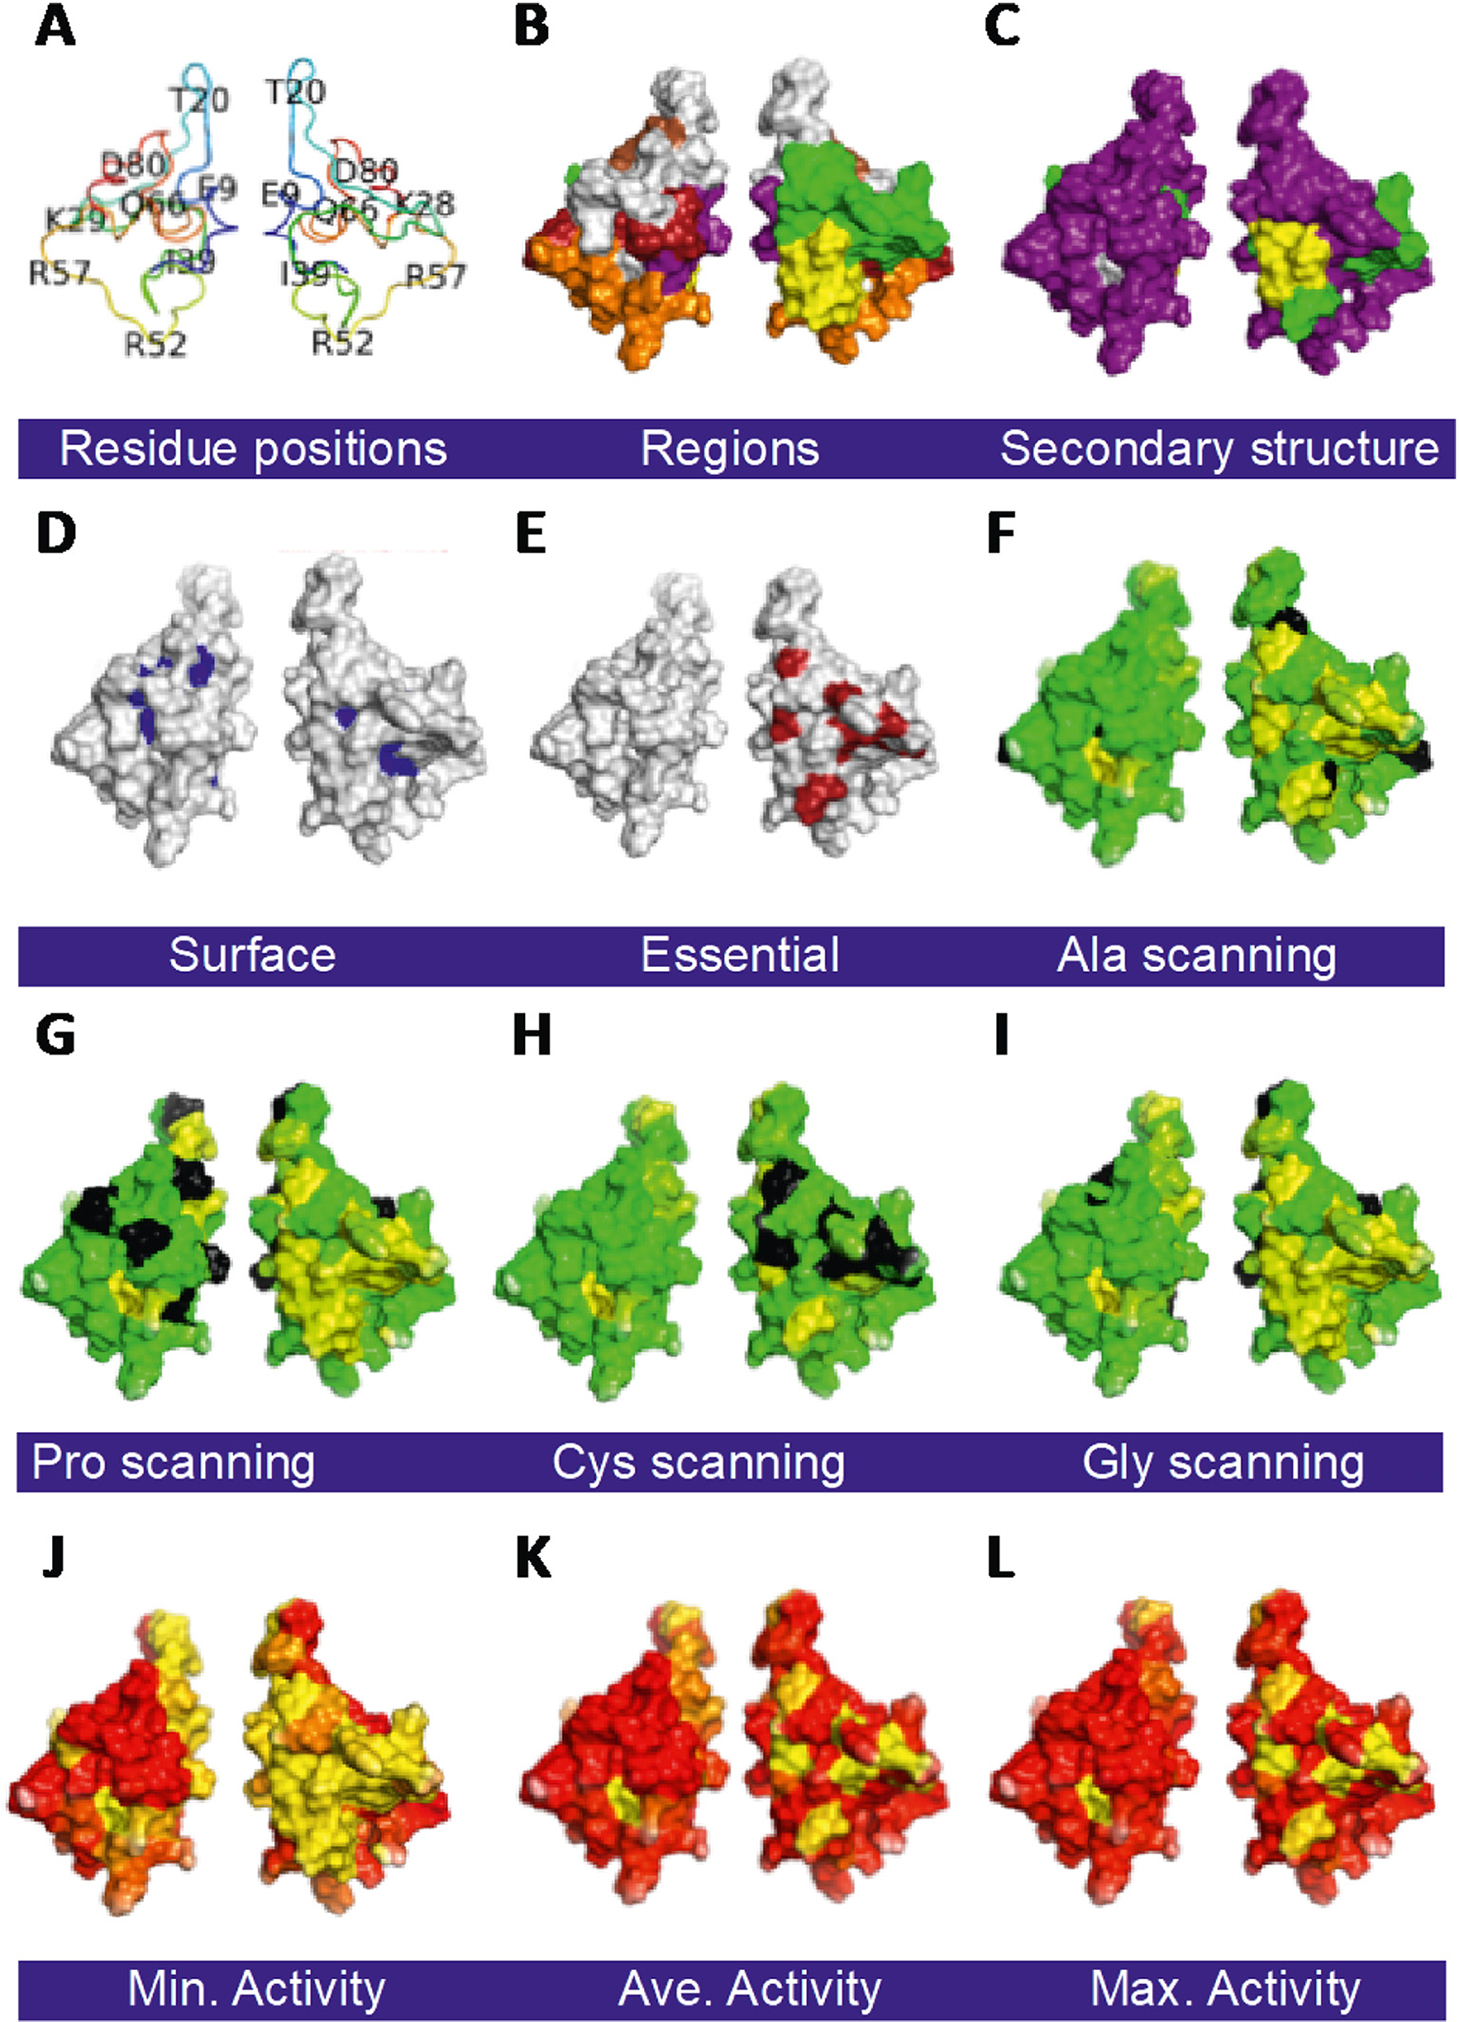
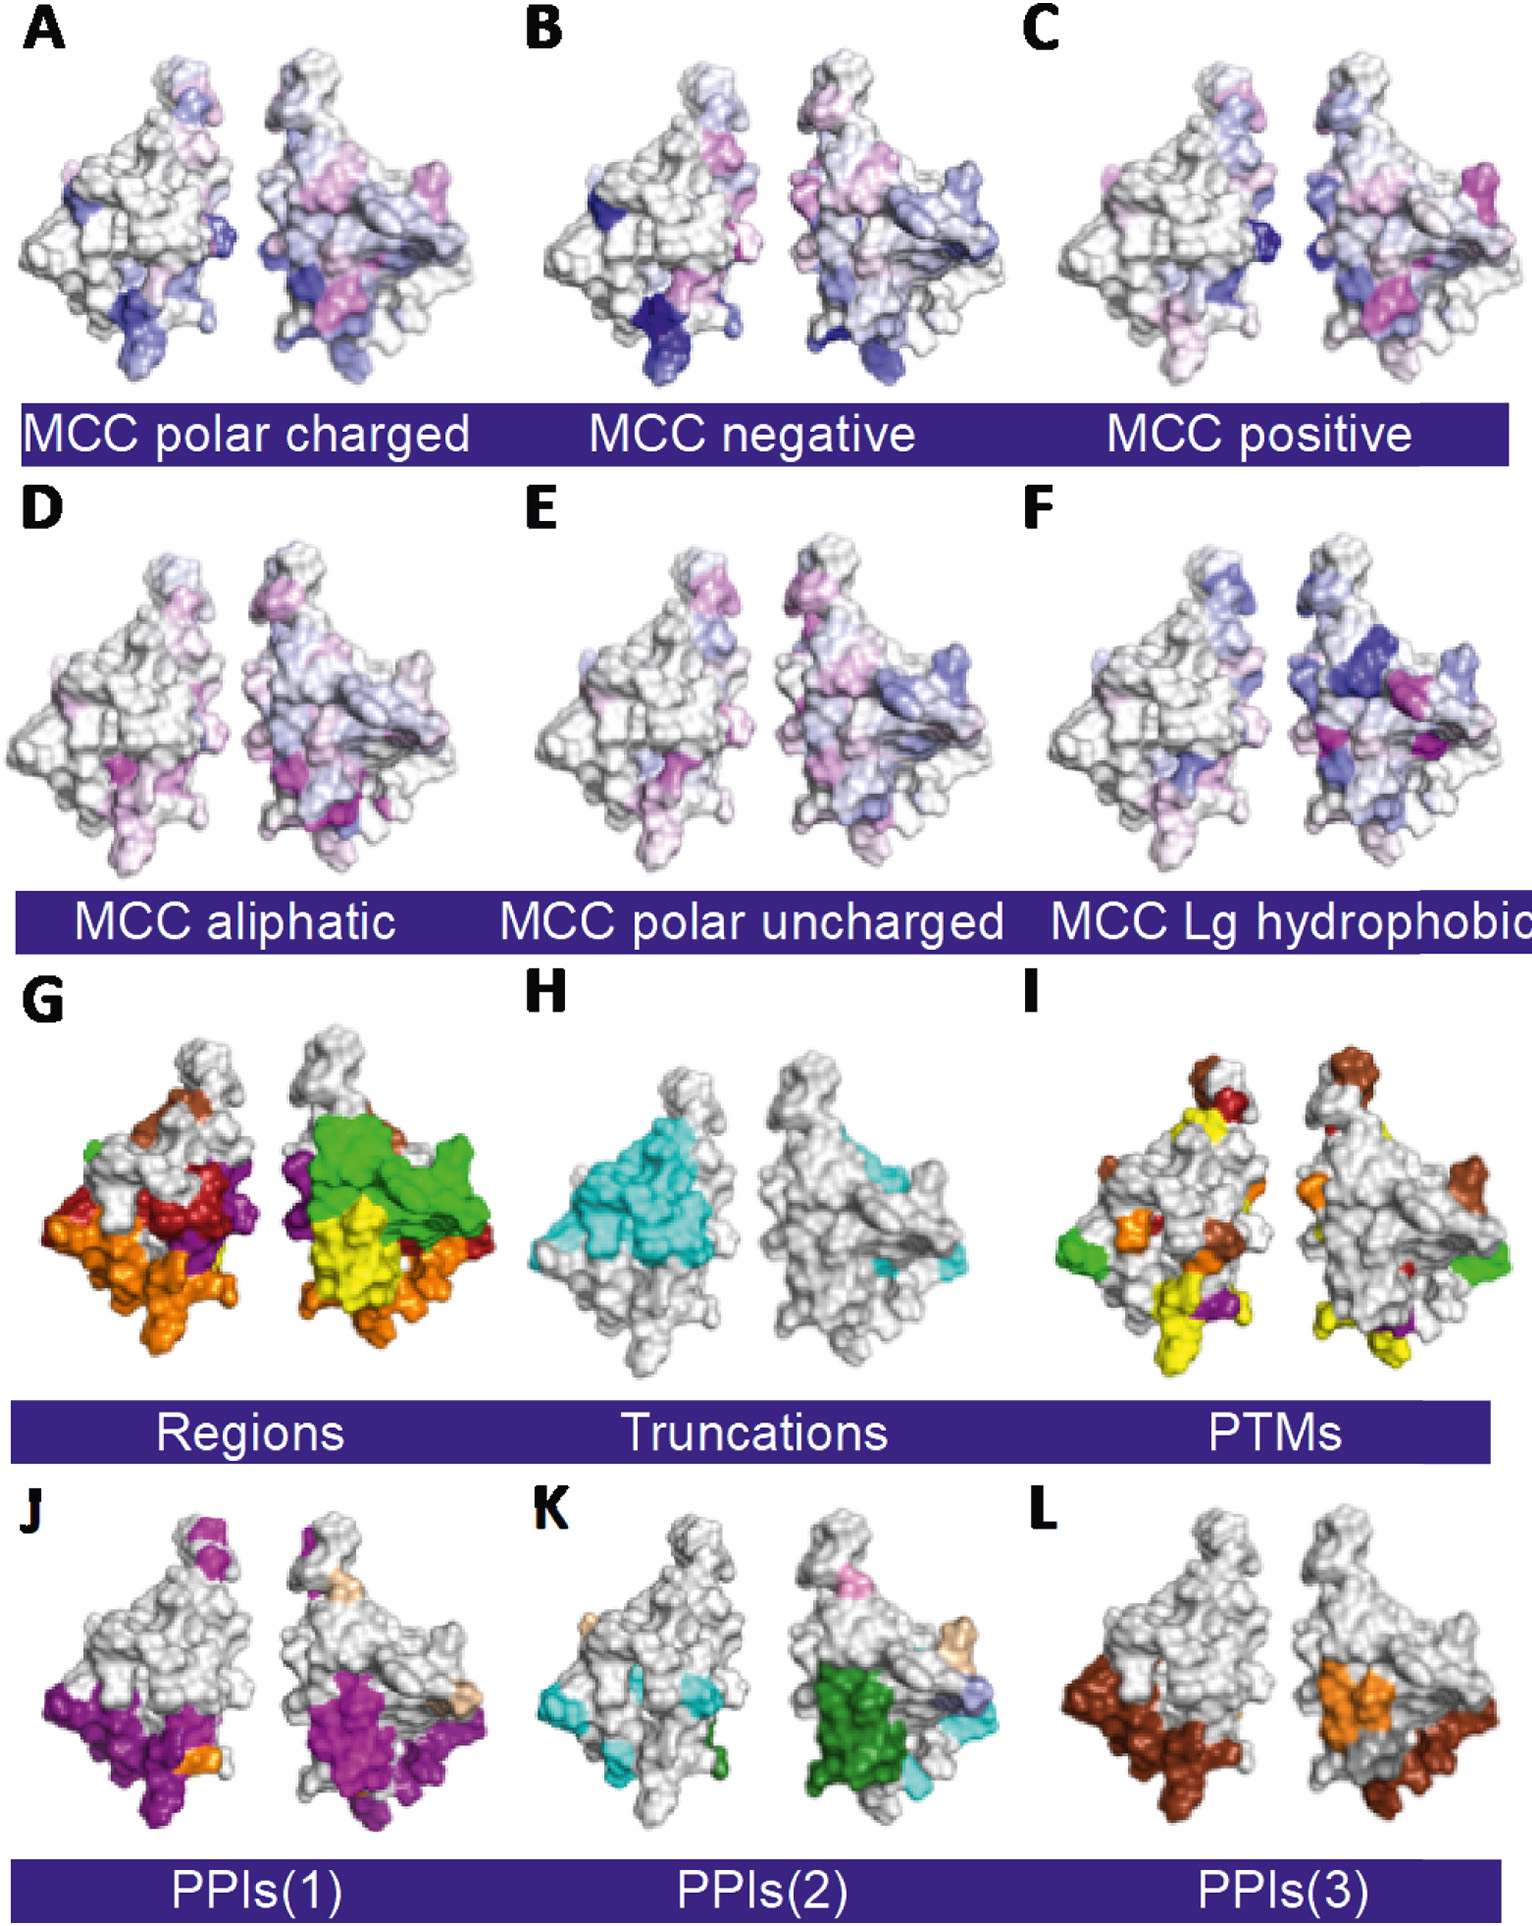
High-throughput assay systems have had a large impact on understanding the mechanisms of basic cell functions. However, high-throughput assays that directly assess molecular functions are limited. Herein, we describe the "GigaAssay", a modular high-throughput one-pot assay system for measuring molecular functions of thousands of genetic variants at once. In this system, each cell was infected with one virus from a library encoding thousands of Tat mutant proteins, with each viral particle encoding a random unique molecular identifier (UMI). We demonstrate proof of concept by measuring transcription of a GFP reporter in an engineered reporter cell line driven by binding of the HIV Tat transcription factor to the HIV long terminal repeat. Infected cells were flow-sorted into 3 bins based on their GFP fluorescence readout. The transcriptional activity of each Tat mutant was calculated from the ratio of signals from each bin. The use of UMIs in the GigaAssay produced a high average accuracy (95%) and positive predictive value (98%) determined by comparison to literature benchmark data, known C-terminal truncations, and blinded independent mutant tests. Including the substitution tolerance with structure/function analysis shows restricted substitution types spatially concentrated in the Cys-rich region. Tat has abundant intragenic epistasis (10%) when single and double mutants are compared.
Keywords: High-throughput assay; Intragenic epistasis; Protein structure; Saturation mutagenesis; Tat; Transcription.
Copyright © 2022. Published by Elsevier Inc.
Conflict of interest statement
Declaration of Competing Interest
Part of this technology is owned by the University of Nevada Las Vegas and is part of a pending patent application with the United States Patent and Trademark Office [Patent No: PCT/US2017/042179 Canadian PCT-CA (0445–02)]. MRS LV, LB, and CJG are employees of Heligenics which has licensed the technology from UNLV and is pursuing commercial interest. UNLV manages a conflict-of-interest management plan for Principal Investigator, MRS. ZW is contracted by Heligenics to build and implement a part of a statistical model for the GigaAssay.
Figures
Similar articles
-
Data supporting a saturation mutagenesis assay for Tat-driven transcription with the GigaAssay.Data Brief. 2022 Sep 28;45:108641. doi: 10.1016/j.dib.2022.108641. eCollection 2022 Dec. Data Brief. 2022. PMID: 36426049 Free PMC article.
-
Accurate Prediction of Transcriptional Activity of Single Missense Variants in HIV Tat with Deep Learning.Int J Mol Sci. 2023 Mar 24;24(7):6138. doi: 10.3390/ijms24076138. Int J Mol Sci. 2023. PMID: 37047108 Free PMC article.
-
Short communication: a single step assay for rapid evaluation of inhibitors targeting HIV type 1 Tat-mediated long terminal repeat transactivation.AIDS Res Hum Retroviruses. 2012 Aug;28(8):902-6. doi: 10.1089/AID.2011.0228. Epub 2011 Oct 18. AIDS Res Hum Retroviruses. 2012. PMID: 21878060
-
Semen Exosomes Promote Transcriptional Silencing of HIV-1 by Disrupting NF-κB/Sp1/Tat Circuitry.J Virol. 2018 Oct 12;92(21):e00731-18. doi: 10.1128/JVI.00731-18. Print 2018 Nov 1. J Virol. 2018. PMID: 30111566 Free PMC article.
-
Genetic variation and function of the HIV-1 Tat protein.Med Microbiol Immunol. 2019 Apr;208(2):131-169. doi: 10.1007/s00430-019-00583-z. Epub 2019 Mar 5. Med Microbiol Immunol. 2019. PMID: 30834965 Free PMC article. Review.
Cited by
-
Data supporting a saturation mutagenesis assay for Tat-driven transcription with the GigaAssay.Data Brief. 2022 Sep 28;45:108641. doi: 10.1016/j.dib.2022.108641. eCollection 2022 Dec. Data Brief. 2022. PMID: 36426049 Free PMC article.
-
Synonymous Variants of Uncertain Silence.Int J Mol Sci. 2023 Jun 23;24(13):10556. doi: 10.3390/ijms241310556. Int J Mol Sci. 2023. PMID: 37445732 Free PMC article.
-
gUMI-BEAR, a modular, unsupervised population barcoding method to track variants and evolution at high resolution.PLoS One. 2023 Jun 7;18(6):e0286696. doi: 10.1371/journal.pone.0286696. eCollection 2023. PLoS One. 2023. PMID: 37285353 Free PMC article.
-
Accurate Prediction of Transcriptional Activity of Single Missense Variants in HIV Tat with Deep Learning.Int J Mol Sci. 2023 Mar 24;24(7):6138. doi: 10.3390/ijms24076138. Int J Mol Sci. 2023. PMID: 37047108 Free PMC article.
-
A fundamental and theoretical framework for mutation interactions and epistasis.Genomics. 2024 Nov;116(6):110963. doi: 10.1016/j.ygeno.2024.110963. Epub 2024 Nov 17. Genomics. 2024. PMID: 39561884 Free PMC article.
References
-
- Zheng GXY, Lau BT, Schnall-Levin M, Jarosz M, Bell JM, Hindson CM, Kyriazopoulou-Panagiotopoulou S, Masquelier DA, Merrill L, Terry JM, Mudivarti P, Wyatt PW, Bharadwaj R, Makarewicz AJ, Li Y, Belgrader P, Price AD, Lowe AJ, Marks P, Vurens GM, Hardenbol P, Montesclaros L, Luo M, Greenfield L, Wong A, Birch DE, Short SW, Bjornson KP, Patel P, Hopmans ES, Wood C, Kaur S, Lockwood GK, Stafford D, Delaney JP, Wu I, Ordonez HS, Grimes SM, Greer S, Lee JY, Belhocine K, Giorda KM, Heaton WH, McDermott GP, Bent ZW, Meschi F, Kondov NO, Wilson R, Bernate JA, Gauby S, Kindwall A, Bermejo C, Fehr AN, Chan A, Saxonov S, Ness KD, Hindson BJ, Ji HP, Haplotyping germline and cancer genomes with high-throughput linked-read sequencing, Nat. Biotechnol. 34 (2016) 303–311, 10.1038/nbt.3432. - DOI - PMC - PubMed
-
- Smith GP, Filamentous fusion phage: novel expression vectors that display cloned antigens on the virion surface, Science. 228 (1985) 1315–1317. - PubMed
Publication types
MeSH terms
Substances
Grants and funding
LinkOut - more resources
Full Text Sources
