. 2022 Aug 19;9(4):ENEURO.0281-21.2022.
doi: 10.1523/ENEURO.0281-21.2022. Print 2022 Jul-Aug.

Detecting Spontaneous Neural Oscillation Events in Primate Auditory Cortex

Affiliations

Detecting Spontaneous Neural Oscillation Events in Primate Auditory Cortex

Samuel A Neymotin et al. eNeuro. .

Abstract

Electrophysiological oscillations in the brain have been shown to occur as multicycle events, with onset and offset dependent on behavioral and cognitive state. To provide a baseline for state-related and task-related events, we quantified oscillation features in resting-state recordings. We developed an open-source wavelet-based tool to detect and characterize such oscillation events (OEvents) and exemplify the use of this tool in both simulations and two invasively-recorded electrophysiology datasets: one from human, and one from nonhuman primate (NHP) auditory system. After removing incidentally occurring event-related potentials (ERPs), we used OEvents to quantify oscillation features. We identified ∼2 million oscillation events, classified within traditional frequency bands: δ, θ, α, β, low γ, γ, and high γ. Oscillation events of 1-44 cycles could be identified in at least one frequency band 90% of the time in human and NHP recordings. Individual oscillation events were characterized by nonconstant frequency and amplitude. This result necessarily contrasts with prior studies which assumed frequency constancy, but is consistent with evidence from event-associated oscillations. We measured oscillation event duration, frequency span, and waveform shape. Oscillations tended to exhibit multiple cycles per event, verifiable by comparing filtered to unfiltered waveforms. In addition to the clear intraevent rhythmicity, there was also evidence of interevent rhythmicity within bands, demonstrated by finding that coefficient of variation of interval distributions and Fano factor (FF) measures differed significantly from a Poisson distribution assumption. Overall, our study provides an easy-to-use tool to study oscillation events at the single-trial level or in ongoing recordings, and demonstrates that rhythmic, multicycle oscillation events dominate auditory cortical dynamics.

Keywords: auditory cortex; current-source density; electrophysiology; local field potential; oscillations; rhythms.


Figures

Figure 1.
Figure 1.
Locations of the iEEG electrodes used for human electrophysiology recordings included in this study, overlayed on a standard average brain. Colors represent different patients.
Figure 2.
Figure 2.
Stereotyped ERPs in NHP A1: supragranular, granular, infragranular layers (left to right; 50-dB clicks in NHP). Top, Average ERP waveforms (click at 0 ms). Middle, Wavelet transform spectrograms (values are in units of Power; note that these spectrograms are not normalized). Bottom, Apparent oscillation peaks (average of spectrogram over time).
Figure 3.
Figure 3.
Validation of event detection algorithm. A, Example of 1-cycle, 11-cycle simulated 10-Hz α signals (green bounding boxes) added to supragranular CSD; amplitude 1.5 mV/mm2. B, 1-cycle signal from A was detected as two cycles. C, 11-cycle detected as 11.6 cycles. B, C, Top, Wavelet transform spectrograms with detected event in boxes; bottom: raw (red), filtered (blue) signal. D, Detected number of cycles as a function of the actual burst duration (dotted black line) for BOSC (blue) and OEvent (red). E, Peak frequency detected was generally close to the frequency of the simulated signal (horizontal gray line) using both methods in most frequency bands but varied across different burst durations (SEM: dashed lines; insets in D, E show the results for low-γ frequency band). F, G, Number of cycles and peak frequency detected in NHP A1 recordings using BOSC (blue) and OEvent (red).
Figure 4.
Figure 4.
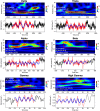
Oscillation events in at least one of the bands occupy the majority of recording time. Example from NHP supragranular A1. Oscillation events (red bounding boxes) occur in one or more frequency bands during this 3-s period. A long δ event is detected from t = 0 to near the end of this 3-s period (red box appears as line across bottom). Red dots show peak frequency; height of box indicates frequency spread. Normalized wavelet transform spectrogram (top) of signal shown at bottom (spectrogram values normalized by median power at a given frequency). This example shows events in δ, θ, α, β, low γ, and γ bands.
Figure 5.
Figure 5.
Examples of oscillation events from NHP A1 supragranular layer. Normalized Morlet wavelet spectrograms demonstrating individual events (red bounding-box) with raw (red) and filtered (blue) waveforms below (black trace: period outside of detected oscillation). Note that x- and y-scales differ for different bands; spectrogram power (color) is in median normalized units. White text in the spectrograms specifies the events’ power relative to the median, the peak frequency of the event (and frequency range), the number of cycles, and the correlation value between the raw and filtered waveforms (filter-match).
Figure 6.
Figure 6.
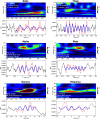
Examples of oscillation events from human STG iEEG. Normalized Morlet wavelet spectrograms demonstrating individual events (red bounding-box) with raw (red) and filtered (blue) waveforms below [x-y-scales differ for different bands; spectrogram power (color) is in median normalized units; iEEG time-series values are in units of Volts]. Time of 0 ms corresponds to the wavelet phase of 0 radians (local maxima) closest to the event’s peak power at threshold detection. White text in the spectrograms specifies the events’ power relative to the median, the peak frequency of the event (and frequency range), the number of cycles, and the correlation value between the raw and filtered waveforms (filter-match).
Figure 7.
Figure 7.
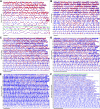
Individual oscillation events from NHP A1. δ (A), θ (B), α (C), β (D), γ (E), high γ (F). In each case, vertical axis arranges waveforms with decreasing numbers of cycles from top to bottom; each row organizes waveforms with decreasing filter-match between raw and filtered signal from left to right. Horizontal scale bars 1 s except: E, 200 ms; F, 100 ms. Examples in green bounding boxes in A, F are described in the text. Note that waveforms are normalized to allow easier visual comparison.
Figure 8.
Figure 8.
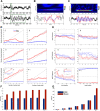
Oscillation event rates and active time varied by frequency band. A, Higher frequency events are more frequent. B, ATR: lower and higher frequency events fill much of the recording duration (HGamma: high-γ bands; mean ± SEM in both A, B; see Extended Data Table 8-1, Table 8-2).
Figure 9.
Figure 9.
Event features. A, Number of cycles. B, Number of local peaks in the time domain of the filtered waveform. C, Intraevent Fspan = log(maxF/minF); 0.7 is freq doubling. D, Filter-match r value (see Extended Data Tables 9-1, 9-2, 9-3, 9-4 for comparisons).
Figure 10.
Figure 10.
Parameters of OEvent. Influence of different parameter combinations on the detected number of cycles for each frequency band. The results are averaged across all recordings and cortical layers. Error bars indicate SEM. Each row corresponds to a different wavelet width (mspecwidth = 5, 7, 9), and each column corresponds to a different threshold for merging overlapping events (overlap = 0.35, 0.5, 0.65). Colored lines indicate different detection thresholds. Higher detection thresholds resulted in lower detected number of cycles for all bands (t test, p < 0.01 for all bands, FDR corrected). No significant differences were observed between different wavelet widths or overlap thresholds within any of the bands.
Figure 11.
Figure 11.
IEIs suggest rhythmic recurrence in all bands. A, CV2 values (mean and SEM) in all bands < 1 (p < 0.05, one-sided Wilcoxon signed-rank test). B, FF (mean and SEM) in all bands except for LGamma < 1 (p < 0.05, one-sided Wilcoxon signed-rank test).
Figure 12.
Figure 12.
Individual oscillation events are categorized by the frequency of maximum amplitude (peak frequency; x-axis) but may spread to lower or higher frequency bands. A, B, % of oscillation events with minimum and maximum frequency in a specific band. C, % of oscillation events that are band-limited, defined as having both minF and maxF in the same band as the event’s peak. In some frequency bands (i.e., δ, γ, and high γ) individual events tend to be more band limited (C), while in other bands (i.e., θ, α, and β) as many as 60−80% of the events spread to adjacent bands (x-axis location indicates categorization of an oscillation event based on its peak frequency; color indicates which frequency band an oscillation event spreads to, e.g., in A, ∼75%, 25% of θ events have a minimum frequency in the θ, δ bands, respectively).
Figure 13.
Figure 13.
Co-occurrence of oscillation events and PAC. A, Oscillation events in the δ-θ range had higher probability of occurring together with γ-high γ events compared with other frequency band combinations. B, PAC between δ (left) or θ (right) events and γ/h-γ events during periods of low-frequency events (blue) and periods without any detected events (red). PAC in all layers increases during periods of low-frequency events. (Note that just as in the analysis shown in Figure 9, here we used a γ band spanning 30–80 Hz, to allow accurate measurement of cross-frequency interactions in a wide enough band.)

References

    1. Abbasi O, Gross J (2020) Beta-band oscillations play an essential role in motor-auditory interactions. Hum Brain Mapp 41:656–665. 10.1002/hbm.24830 - DOI - PMC - PubMed
    1. Ainsworth M, Lee S, Cunningham MO (2011) Dual gamma rhythm generators control interlaminar synchrony in auditory cortex. J Neurosci 31:17040–17051. - PMC - PubMed
    1. Arnal LH, Doelling KB, Poeppel D (2015a) Delta–beta coupled oscillations underlie temporal prediction accuracy. Cereb Cortex 25:3077–3085. 10.1093/cercor/bhu103 - DOI - PMC - PubMed
    1. Arnal LH, Poeppel D, Giraud AL (2015b) Temporal coding in the auditory cortex. Handb Clin Neurol 129:85–98. 10.1016/B978-0-444-62630-1.00005-6 - DOI - PubMed
    1. Bahramisharif A, van Gerven MAJ, Aarnoutse EJ, Mercier MR, Schwartz TH, Foxe JJ, Ramsey NF, Jensen O (2013) Propagating neocortical gamma bursts are coordinated by traveling alpha waves. J Neurosci 33:18849–18854. 10.1523/JNEUROSCI.2455-13.2013 - DOI - PMC - PubMed

Publication types

LinkOut - more resources