. 2022 Aug:82:104141.
doi: 10.1016/j.ebiom.2022.104141. Epub 2022 Jul 26.

Clinical and genomic signatures of SARS-CoV-2 Delta breakthrough infections in New York

Affiliations

Clinical and genomic signatures of SARS-CoV-2 Delta breakthrough infections in New York

Ralf Duerr et al. EBioMedicine. 2022 Aug.

Abstract

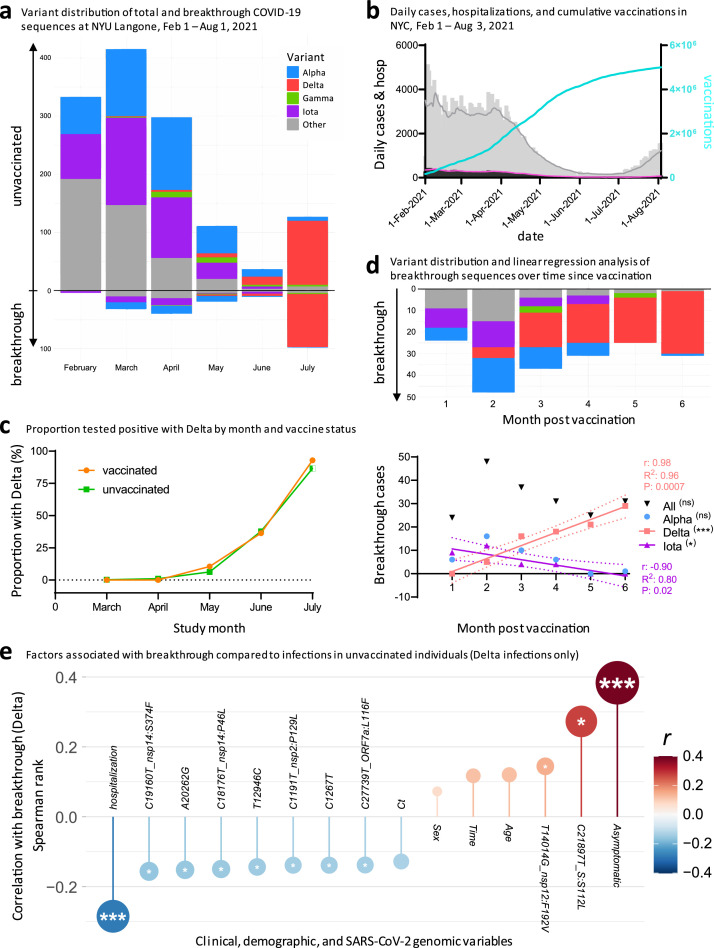
Background: In 2021, Delta became the predominant SARS-CoV-2 variant worldwide. While vaccines have effectively prevented COVID-19 hospitalization and death, vaccine breakthrough infections increasingly occurred. The precise role of clinical and genomic determinants in Delta infections is not known, and whether they contributed to increased rates of breakthrough infections compared to unvaccinated controls.

Methods: We studied SARS-CoV-2 variant distribution, dynamics, and adaptive selection over time in relation to vaccine status, phylogenetic relatedness of viruses, full genome mutation profiles, and associated clinical and demographic parameters.

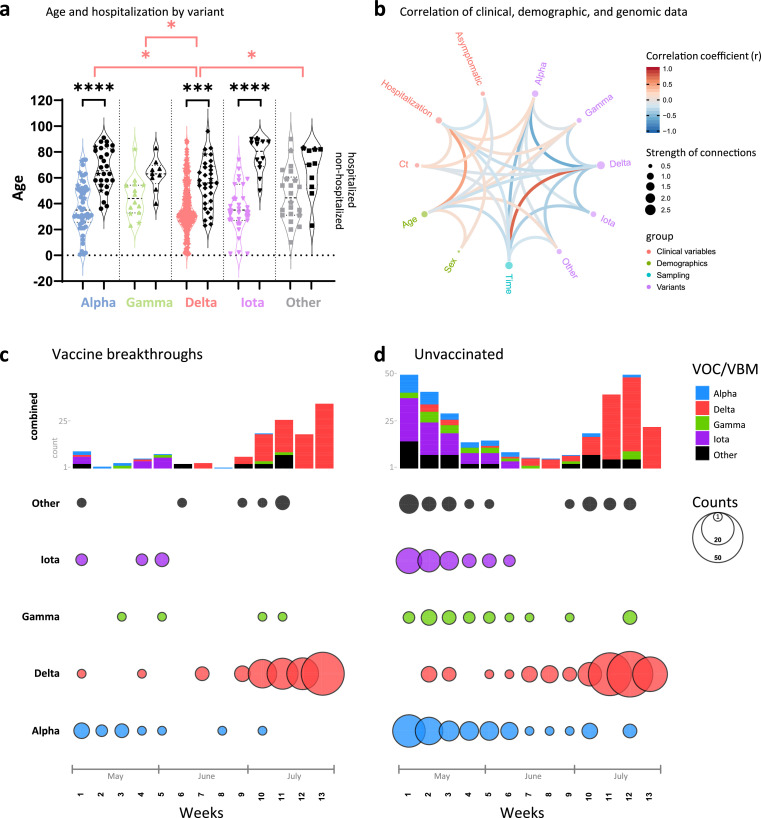
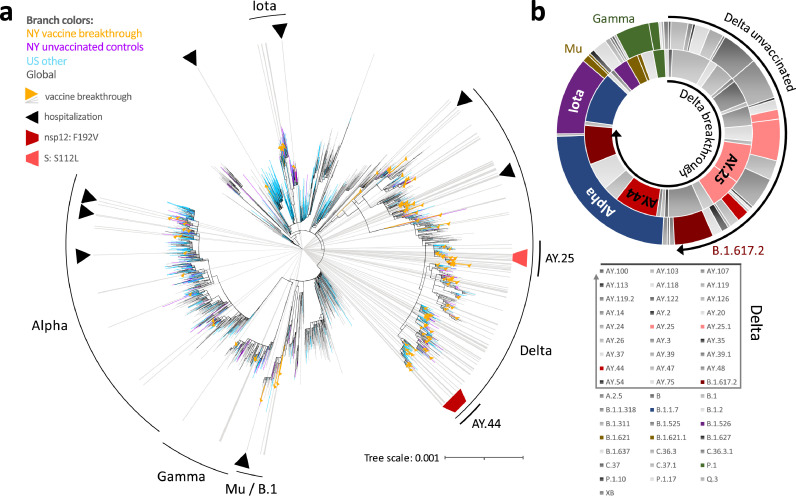
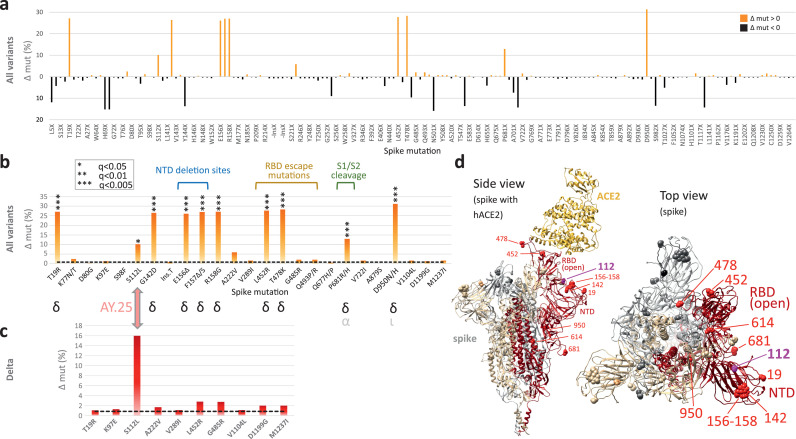
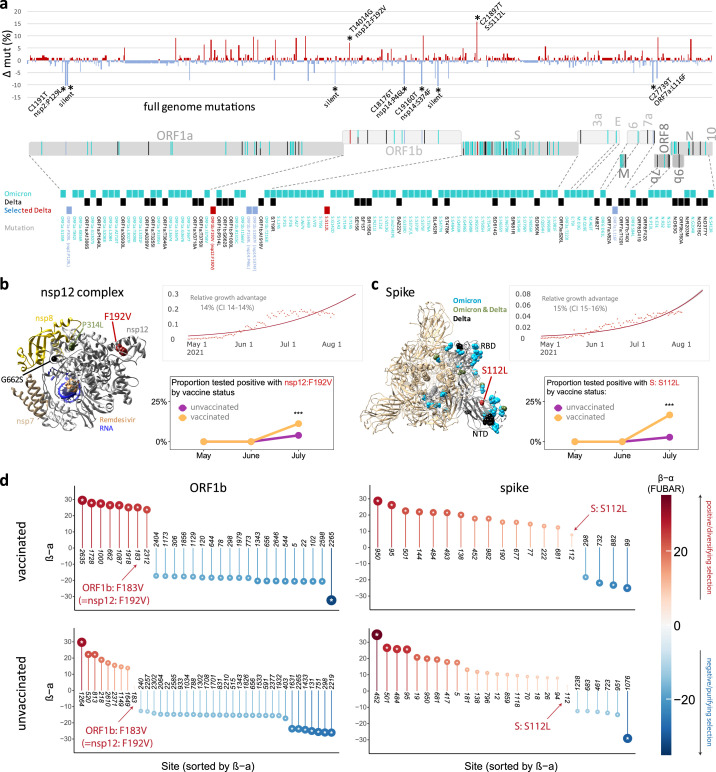
Findings: We show a steep and near-complete replacement of circulating variants with Delta between May and August 2021 in metropolitan New York. We observed an increase of the Delta sublineage AY.25 (14% in vaccinated, 7% in unvaccinated), its spike mutation S112L, and AY.44 (8% in vaccinated, 2% in unvaccinated) with its nsp12 mutation F192V in breakthroughs. Delta infections were associated with younger age and lower hospitalization rates than Alpha. Delta breakthrough infections increased significantly with time since vaccination, and, after adjusting for confounders, they rose at similar rates as in unvaccinated individuals.

Interpretation: We observed a modest adaptation of Delta genomes in breakthrough infections in New York, suggesting an improved genomic framework to support Delta's epidemic growth in times of waning vaccine protection despite limited impact on vaccine escape.

Funding: The study was supported by NYU institutional funds. The NYULH Genome Technology Center is partially supported by the Cancer Center Support Grant P30CA016087 at the Laura and Isaac Perlmutter Cancer Center.

Keywords: Genomic signatures of vaccine breakthrough; Network analysis of clinical variables; SARS-CoV-2 variant of concern (VOC) delta; Selective adaptation; Spike S112L and nsp12 F192V; Time since vaccination.


Conflict of interest statement

Declaration of interests The authors have no conflict of interest to declare.

Figures

Figure 1
Figure 1
Relationship of clinical, demographic, and genomic data. a, Violin plot summarizing the age distribution of the combined data set of 132 vaccinated and 283 unvaccinated SARS-CoV-2-positive individuals by variant. The pairs of coloured and black violins show non-hospitalized versus hospitalized cases per variant. Horizontal lines indicate the median and interquartile ranges of values. Breakthrough cases are shown as stars. Statistical comparisons of age were made using Kruskal-Wallis tests between variants (red brackets) and, for each variant, between non-hospitalized and hospitalized cases (black brackets). All statistically significant results are shown: * P<0.05, ** P<0.01, *** P<0.001, **** P<0.0001. b, Correlation analysis of clinical, demographic, and genomic data of SARS-CoV-2 infected individuals (as in A). Red and blue edges represent positive and negative correlations between connected variables, respectively, according to the scale of r values to the right. Only significant correlations (P<0.05, Spearman rank test) are displayed. Nodes are color-coded based on the grouping of variables. Node size corresponds to the strength of correlations. Ct: Cycle threshold in RT-PCR; sex: male sex; time: date of sampling. c, d, Distribution of variants (top) and absolute variant counts (bottom), coloured and separated into to the most frequently detected variants of concern (VOC) and being monitored (VBM) and all other variants combined (Other). Vaccine breakthrough infections (c) are shown side-by-side with unvaccinated controls (d) on a weekly basis starting May 1st 2021 (all full weeks shown).
Figure 2
Figure 2
Phylogenetic analysis and variant distribution of SARS-CoV-2 vaccine breakthrough and unvaccinated control sequences. a, Maximum likelihood (IQ) tree of 3511 SARS-CoV-2 full genome sequences (base pairs 202-29,666 according to Wuhan-Hu-1 as reference), including 132 vaccine breakthrough (orange) and 283 unvaccinated control SARS-CoV-2 sequences from the NYU Langone Health cohort (greater NYC area) (purple) together with 920 other US (non-NYU; cyan) and 2176 global (non-US; black) reference sequences. The substitution scale of the tree, generated with 1000 bootstrap replicates and Wuhan/WH01/2019-12-26 as root, is indicated at the bottom right. Vaccine breakthrough sequences are highlighted by orange triangles (as branch symbols) and grey rays radiating from the root to the outer rim of the tree. Hospitalizations among vaccine breakthrough infections are indicated by black triangles. The variants responsible for most vaccine breakthrough infections are labelled. The Delta plus spike:S112L (AY.25) and nsp12:F192V (AY.44) sub-lineages are labelled and highlighted with light and carmine red trapezoid symbols, respectively. b, Double-donut plot to compare the variant distribution of breakthrough (inner ring) and unvaccinated control sequences (outer ring). The most abundant variants and Delta subvariants (highlighted by black arrows) are shown in colour and labelled in the plot (outer ring only). All detected variants (Pango lineages) and their colour code in the plot are shown below.
Figure 3
Figure 3
Site-specific spike mutation analysis in SARS-CoV-2 vaccine breakthrough sequences compared to unvaccinated controls. a, Site-specific amino acid mutation (mut) frequencies in spike in 132 vaccine breakthrough sequences compared to 283 unvaccinated controls from the same cohort. The Wuhan-Hu-1 sequence served as reference. The mirror plot displays differences of mutation frequencies per spike residue between vaccinated and unvaccinated groups, shown along the x-axis (n=168); orange (facing up) and black bars (facing down) refer to elevated mutation frequencies in vaccinated or unvaccinated individuals, respectively. b, Enriched spike mutations in vaccine breakthrough sequences compared to unvaccinated controls. Unique occurrences of mutations in breakthrough cases were disregarded. The dashed black line indicates the average mutation frequency across all spike residues in the unvaccinated control data set (n=283) compared to Wuhan-Hu-1. Significantly enriched mutations in Fisher exact tests are indicated by asterisks (* P<0.05, *** P<0.005) and the variants in which these mutations were found are shown below (black: main source, grey: secondary source). Mutations in the spike N-terminal domain (NTD), receptor binding domain (RBD), and near the S1/S2 interface associated with neutralization escape and/or affecting important biological functions are labeled. c, The same analysis as in (b) but focusing on Delta sequences exclusively. 101 Delta vaccine breakthrough sequences were compared to 139 Delta unvaccinated controls. The dashed black line indicates the average mutation frequency across all spike residues in the Delta unvaccinated control data set compared to Wuhan-Hu-1 as reference (n=139). d, Structural analysis of mutation sites on a spike trimer bound to human ACE2 (hACE2) (pdb S_ACE2). Each protomer is coloured differently. The hACE2-bound protomer with the RBD in the “up” position is shown in red. Statistically enriched mutation sites in vaccine breakthroughs (according to b) are shown as spheres, labelled in one protomer in red (Delta) or pink (AY.25).
Figure 4
Figure 4
Full genome mutation analysis, relative growth, and adaptive evolution of SARS-CoV-2 Delta vaccine breakthrough sequences and associated mutations compared to Delta unvaccinated controls. a, Site-specific base pair mutation frequencies in full genomes (bp 202-29666) of 101 Delta vaccine breakthrough sequences compared to 139 Delta unvaccinated controls from the same cohort. The Wuhan-Hu-1 sequence served as reference. The mirror plot displays differences of mutation frequencies per site between vaccinated and unvaccinated groups, shown along the x-axis (n=791); red (facing up) and blue bars (facing down) refer to elevated mutation rates in vaccinated or unvaccinated individuals, respectively. Significantly enriched mutations in Fisher exact tests are indicated by asterisks (* P<0.05) and are labelled. SARS-CoV-2 coding genomic regions are shown below the plot. Non-synonymous mutations in Omicron (cyan; including B.1.1.529, BA.1, and BA.2 mutations), Delta (black), or Delta breakthrough-enriched mutations (red and blue) are shown by colored ticks. The mutation sites/names are indicated below. b, c, Structural analysis of Delta breakthrough-enriched mutations in comparison to Omicron- and Delta-defining mutations (briefly labelled as Omicron, Delta, or Omicron & Delta, the latter common in both variants). Structures are shown for the nsp12 complex (b) with bound nsp7, nsp8, template-primer RNA, and remdesivir triphosphate (pdb: 7bv2) and for spike (c) in the activated state with one RBD in the up position (pdb: S_ACE2; mutations only shown in the grey, activated protomer). Upper right: The estimated daily proportion of SARS-CoV-2 sequences with indicated mutation through time in the USA is shown as light red dots. The dark red line is the logistic fit. The provided relative growth estimate with confidence interval (CI) reflects the advantage compared to co-circulating strains if variants spread pre-dominantly by local transmission across demographic groups. Lower right: Probability of the detection of a mutation by month in vaccinated (n=132) and unvaccinated (n=283) individuals, adjusted for month of test, sex, and age of participants. *** P<0.001 in a chi-squared test. d, Adaptive evolution analysis of individual sites of a coding gene using a fast, unconstrained Bayesian approximation for inferring selection (FUBAR, Datamonkey), done for vaccinated (n=132) and unvaccinated (n=283) cases. Sites of interest (labelled) are studied in comparison to all sites with significant positive (red, facing up) and negative (blue, facing down) selection per gene. Posterior probabilities >0.9 are considered significant and are indicated by an asterisk inside the circles. α: mean posterior synonymous mutation rate at a site; β: mean posterior non-synonymous mutation rate at a site; 3a: ORF3a; 7a: ORF7a; 7b: ORF7b; 9b: ORF9b; 10: ORF10; bp: base pairs; E: envelope; mut: mutation; nsp: non-structural protein; N: nucleocapsid; NTD: N-terminal domain; ORF: open reading frame; RBD: receptor-binding domain; S: spike.
Figure 5
Figure 5
Increasing rates of SARS-CoV-2 breakthrough infections with Delta over six months post vaccination, and clinical and genomic factors associated with Delta breakthrough. a, Variant distribution of SARS-CoV-2 sequences from unvaccinated (facing up) and vaccinated individuals (facing down), obtained at NYU Langone Health between February and July 2021. b, Daily COVID-19 cases (grey bars) and 7-day averages (grey line), daily COVID-19 deaths (black bars) and 7-day averages (pink line), and cumulative vaccination numbers (turquoise line) in New York City between February 1st and August 3rd. Source of data: NYC Open Data and NYC Health, Citywide Immunization Registry (CIR). c, Probability of positive test with Delta by month in vaccinated and unvaccinated individuals, adjusted for month of test, sex, and age of participants. d, Variant distribution among all NYULH breakthrough sequences, displayed according to months post full vaccination (starting at day 14 after the last dose for full vaccination). The chart below shows a linear regression analysis of breakthrough infections per variant against time post vaccination. Significant results are highlighted by asterisks, labelled with the correlation coefficient (r), goodness of fit (R2), and P value (t-test), and the fitted line with 95% confidence intervals shown. * P<0.05, ** P<0.01, *** P<0.005. e, Correlation of clinical, demographic, and SARS-CoV-2 genomic factors with breakthrough by comparing Delta infections in vaccinated (n=101) and unvaccinated individuals (n=139). Spearman rank correlation is displayed on the y-axis and colour-coded. Multiple comparison-corrected P values (q, Benjamini-Hochberg) are indicated by asterisks within the circles (* q<0.05, ** q<0.01, *** q<0.005). Ct: Cycle threshold in RT-PCR; sex: male sex; time: date of sampling.

Update of

References

    1. World Health Organization (WHO) 2021. WHO Coronavirus (COVID-19) Dashboard.https://covid19.who.int/ Accessed 3 October 2021.
    1. Centers for Disease Control and Prevention (CDC) 2021. SARS-CoV-2 Variant Classifications and Definitions.https://www.cdc.gov/coronavirus/2019-ncov/variants/variant-info.html Accessed 3 October 2021.
    1. GISAID . 2021. GISAID Database.https://www.gisaid.org/ Accessed 25 September 2021.
    1. Pulliam JRC, van Schalkwyk C, Govender N, et al. Increased risk of SARS-CoV-2 reinfection associated with emergence of Omicron in South Africa. Science. 2022;376(6593) - PMC - PubMed
    1. Cele S, Jackson L, Khoury DS, et al. Omicron extensively but incompletely escapes Pfizer BNT162b2 neutralization. Nature. 2022;602(7898):654–656. - PMC - PubMed

Supplementary concepts