. 2022 Jul 29;13(1):4418.
doi: 10.1038/s41467-022-31960-7.

Transcription factor network analysis identifies REST/NRSF as an intrinsic regulator of CNS regeneration in mice

Affiliations

Transcription factor network analysis identifies REST/NRSF as an intrinsic regulator of CNS regeneration in mice

Yuyan Cheng et al. Nat Commun. .

Abstract

The inability of neurons to regenerate long axons within the CNS is a major impediment to improving outcome after spinal cord injury, stroke, and other CNS insults. Recent advances have uncovered an intrinsic program that involves coordinate regulation by multiple transcription factors that can be manipulated to enhance growth in the peripheral nervous system. Here, we use a systems genomics approach to characterize regulatory relationships of regeneration-associated transcription factors, identifying RE1-Silencing Transcription Factor (REST; Neuron-Restrictive Silencer Factor, NRSF) as a predicted upstream suppressor of a pro-regenerative gene program associated with axon regeneration in the CNS. We validate our predictions using multiple paradigms, showing that mature mice bearing cell type-specific deletions of REST or expressing dominant-negative mutant REST show improved regeneration of the corticospinal tract and optic nerve after spinal cord injury and optic nerve crush, which is accompanied by upregulation of regeneration-associated genes in cortical motor neurons and retinal ganglion cells, respectively. These analyses identify a role for REST as an upstream suppressor of the intrinsic regenerative program in the CNS and demonstrate the utility of a systems biology approach involving integrative genomics and bio-informatics to prioritize hypotheses relevant to CNS repair.


Conflict of interest statement

Z.H. is a co-founder of Rugen and Myro Therapeutics. The remaining authors declare no competing interests.

Figures
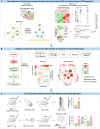
Fig. 1
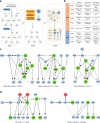
Fig. 1. Schematic diagram summarizing the overall experimental flow integrating iterative bio-informatics and experimental validation.
Multiple independent functional genomics analyses of distinct injury models were analyzed to computationally identify upstream TFs associated with CNS regeneration. In the first set of analysis (a, left), we performed a mutual information-based network analysis using ARACNe to characterize the transcriptional regulatory network formed by regeneration-associated TFs in multiple independent data sets from spinal cord and peripheral nerve injury. The hierarchical structure of the TF regulatory network was further characterized so as to identify potential upstream regulators. This step-wise analysis predicted REST, a transcriptional repressor, as an upstream negative regulator inhibiting the core pro-regenerative TFs to drive the expression of regeneration-associated genes (RAGs). In parallel (a, right), we performed an additional TF screen in another CNS tissue, optic nerve, under pro-growth and native conditions to identify TF regulators of regeneration. Among the ~1000 TF-target gene sets tested via Gene Set Enrichment Analysis, REST was ranked as the top negative regulator of the RGC regeneration state-associated gene set. Multiple independent bio-informatic analyses of external data sets confirmed and converged on our model b, by which REST is activated by CNS injury and acts as a potential upstream negative regulator of the core regenerative TFs. To test this, we performed gene expression analysis in the injured CNS with REST and after REST depletion, showing REST increases following CNS injury, while the core pro-regenerative TFs and genes remain suppressed. Depleting REST activates a core molecular program driven by a tightly controlled TF network similar to the one activated during regeneration. These results predicted that REST depletion would improve regeneration, which we directly tested in two well-established models of regeneration in vivo c, confirming REST’s functional effect as a suppressor of regeneration. In the case of optic nerve injury, REST depletion or inhibition enhanced both RGC regeneration and survival. These analyses identify a role for REST as an upstream suppressor of the intrinsic regenerative program in the CNS and demonstrate the power of a systems biology approach involving integrative genomics analysis to predict key regulators of CNS repair.
Fig. 2
Fig. 2. Characterizing regeneration-associated transcriptional regulatory network.
a Schematic diagram illustrating step-wise approaches employed to infer hierarchical TF regulatory networks from b time-course microarray datasets. Step 1: First, ARACNe was applied to each dataset to find TF-target pairs that display correlated transcriptional responses by measuring mutual information (MI) of their mRNA expression profiles (Methods). The sign (±) of MI scores indicates the predicted mode of action based on the Pearson’s correlation between the TF and its targets. A positive MI suggests activation of this TF on its targets, while a negative MI score suggests repression. All non-significant associations were removed by permutation analysis. Second, ARACNe eliminates indirect interactions, such as two genes connected by intermediate steps, through applying a well-known property of MI called data-processing inequality (DPI). Step 2: To determine the direction of regulation between each TF interactions, ChIP-datasets from ENCODE and previously published ChIP-ChIP and ChIP-seq datasets were integrated to compile a list of all observed physical TF-target binding interactions. Step 3: To identify the hierarchical structure within directed TF networks, we used graph-theoretical algorithms to determine precise topological ordering of directed networks based on the number of connections that start from or end at each TF, indicating whether a TF is more regulating or more regulated. c, d Representative regulatory networks inferred from microarrays following peripheral nerve injury c and CNS injury d. Each node represents one of the 21 regeneration-promoting TFs if a connection exists. The thickness of each line indicates the MI between the TFs it connects. A directional arrow is drawn if there is direct physical evidence of the TF binding its target TF’s promoter.
Fig. 3
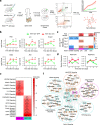
Fig. 3. REST deletion in injured cortical neurons enhances expression of regeneration-associated genes and pathways.
a Overview of RNA-seq of FACS-sorted cortical neurons expressing AAV-Syn-GFP (wild-type) or AAV-Syn-Cre (REST cKO) after a complete crush injury at thoracic spinal cord level 10 (T10). Transcriptional differences in response to SCI and REST depletion were analyzed for differential expression and changes in co-expression networsk. b Expression levels of Jun, Smad1, Sox11, Stat3, Atf3, and Rest. Values are mean log2 Counts ± SEM from RNA-seq data. n = 3 mice in each condition. Asterisks denotes FDR-corrected, two-tail P < 0.1 compared to AAV-Syn-GFP at each time point. Exact P values and “n” used in each condition are included in Supplementary Data 1. c WGCNA modules with significant correlations to treatments (bottom panel) and over-representation of regeneration-associated genes (RAGs) within each module (upper panel). In the correlation heatmap, colors indicate –sign(correlation coefficient)*(log10 p-value). In the enrichment heatmap, numbers shown are odds ratio indicating the possibility of enrichment, with the hypergeometric p-value in parenthesis. d Trajectory of the RESTUP1 and RESTUP3 module eigengenes (MEs) across different time points after SCI in AAV-Syn-GFP (green) and AAV-Syn-CRE expressing (red) neurons. Values are mean MEs ± SEM; Asterisks denote statistical significance assessed by ANOVA model with Tukey’s post-hoc test: *p < 0.05, **p < 0.01 compared to AAV-Syn-GFP. Exact P values are shown in c. e Over-representation (hypergeometric test) of subsets of RAGs in RESTUP1 and RESTUP3. These subsets of RAGs were derived from GO analysis. f Protein–protein interaction (PPI) network represented by genes in the RESTUP1, RESTUP3 and RAG modules. Each node represents a molecule from the RAG module, colored by orange, while edge represents an experiment-supported PPI between two nodes. Molecules that also appear in RESTUP1 are colored in magenta, while molecules appearing in RESTUP3 are colored in turquoise. The core transcription factors are placed in the center.
Fig. 4
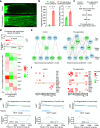
Fig. 4. REST is a transcriptional repressor negatively correlated with CNS regenerative state.
a Longitudinal sections through the mature mouse optic nerve immunostained for GAP43 two weeks after optic nerve crush. Control mice received an intraocular injection of AAV2-shLuciferase.mCherry 2 weeks before crush and saline immediately afterwards, while mice receiving pro-regenerative treatment were injected with AAV2-shPten.mCherry before crush, and oncomodulin (Ocm) and CPT-cAMP (a co-factor of Ocm) immediately after nerve injury. b Quantitation of axon growth (left) and RGC survival (right). Bars represent mean axon growth ± SEM. Asterisk in: nerve injury site. Scale bar in: 120 µm. Statistical significance was assessed with two-tailed t-test. n = 7 mice in the Control group and n = 10 mice in the Pro-regenerative group. (c) Overview of RNA-seq of FACS-purified RGCs receiving control or pro-regenerative treatments. n = 5 replicates in each condition. d Gene set enrichment analysis (GSEA) to screen TFs correlating with RGC regenerative state. Upper panel: schema demonstrating the principle of GSEA, which determines whether a TF’s targets are randomly distributed, primarily found at the genes up-regulated by pro-regenerative treatments (logFC > 0) or at the genes down-regulated (logFC < 0). An enrichment at the bottom suggests that the TF down-regulates genes of interest, and is thus a negative regulator of the regenerative state (ES < 0; TF2 as an example), while an enrichment at the top suggests this TF is a positive regulator of regeneration (ES > 0; TF1 as an example). Bottom panel: A total of 1137 TF targeted gene sets (Methods) were screened and the top 10 negative TF regulators of RGCs’ regeneration state were shown in the heatmap by their normalized enrichment scores (NES). e Transcriptional regulatory networks comparing RGCs in non-regenerating (control) and regenerating state (pro-regenerative). The networks were constructed using the TF-network pipeline described in Fig. 2a. f Mutual information (MI) scores of each TF-pair in the networks e indicating the degree of their correlation. g Distribution of REST-repressed target genes defined by ARACNe throughout the de-regulated genes by pro-regenerative treatments ranked by log2-fold changes (logFC, pro-regenerative vs non-regenerating) at indicated times following optic nerve crush.
Fig. 5
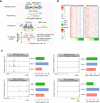
Fig. 5. REST foot-printing in CNS-injured neurons.
a Schematic diagram depicting analysis to identify REST binding sites using DNA footprinting analysis of ATAC-seq data generated from RGCs FACS-purified at 0 (sham) 1, 3 days following optic nerve crush. During ATAC, Tn5 transposase cleaves DNA free of chromatin-bound proteins such as transcription factors (yellow) and inserts sequencing adapters (green). Tn5-tagged DNA fragments are sequenced to yield reads, and then mapped to the genome to create signals of single Tn5 insertion events (black bars), in which TF binding is visible as depletion of signals (defined as footprint). DNA footprints overlapping with REST motifs are defined as direct REST binding sites. REST binding activities can be quantitated by scoring each footprint’s depleted signal and the surrounding chromatin accessibility, correlating with the presence of a TF at its target loci, and the chromatin accessibility of the regions where this TF binds. b Promoter (±2 kb of a gene’s transcription start site) accessibility and expression changes of 801 REST-targeted genes at indicated time points following CNS injury. Normalized ATAC-seq and RNA-seq counts scaled by row are displayed in the heatmaps. c Genome-browser views of REST footprinted sites and barplots of mean REST footprint scores within indicated genomic distances of the regenerative TFs (Atf3, Stat3, Smad1, Sox11). The footprint scores are calculated with TOBIAS as described in a, indicating REST binding activities at these genes. The genomic distance covers the entire gene from 2 kb upstream of a gene’s transcription start site, to 1 kb downstream of the end of the gene. The coding exons of a gene are displayed as yellow boxes connected by horizontal lines representing introns. Arrowheads on the connecting intron lines or the coding exons indicate the direction of transcription.
Fig. 6
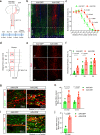
Fig. 6. REST inhibits neurite growth in vitro.
a Tuj1 (βIII tubulin) staining of REST flx/flx;tdTomato DRG neurons cultured on CSPG (5 µg/ml) or laminin only (2 µg/ml) and transduced with AAV-GFP (green) or AAV-CRE (red) at ~100,000 genome copies per cell for 7 days to allow the expression of transgenes. b Quantitation of neurite outgrowth normalized to AAV-GFP infected neurons cultured on laminin. Data are presented as mean neurite outgrowth ± SEM. N = 3 replicate wells in each condition examined over at least 3 independent experiments. c Representative western blot and quantitation of REST levels in DRG cells transduced with AAV-GFP or AAV-CRE. Data are presented as mean ± SEM. N = 3 replicate wells in each condition examined over two independent experiments. d Volcano plot showing the mean neurite outgrowth of re-plated DRG neurons infected with lentiviral constructs expressing either REST (Lv135-REST) or humanized luciferase protein (Lv135-hLuc) as a control driven by the CMV promoter at indicated genome copies per cell for 7 days. Neurite extension was quantified 24 h following re-plating. Data are presented as mean neurite outgrowth ± SEM normalized to control at indicated viral doses. N = 6 replicate wells in each condition examined over at least 3 independent experiments. For bd, statistical significance was assessed by two-tailed t-test for indicated comparisons.
Fig. 7
Fig. 7. REST deletion enhances corticospinal (CST) axon regeneration after anatomically complete spinal cord crush injury.
a Schematic diagram and timeline of inducing REST deletion and SCI lesions. b Confocal images of BDA-labeled CST axons of lesioned spinal cord also stained for astrocytes (glial fibrillary acidic protein, GFAP). Dashed line represents lesion center (marked with *). c Intercepts of CST axons with lines drawn at various distances rostral to the lesion center were counted and expressed as percent of the number of intact axons at 3 mm proximally to control for potential variability in the fluorescence intensity among animals. Each dot represents mean ± SEM; n = 10 mice in AAV-GFP group and n = 12 in AAV-CRE group. Statistical significance was assessed by two-way ANOVA with repeated measures and Bonferroni post-hoc test, comparing AAV-CRE to AAV-GFP at each distance. d Schematic diagram showing regions along the central canal in horizontal sections of lesioned spinal cord used for quantifying branching of CST axons. e Confocal images of CST axons labeled by BDA in Z1, Z2, and Z3, three 0.8 × 0.8 mm2 squares drawn in the gray matter of each spinal cord. f Quantitation of the number of axons per area. gj The number of GAP43- or Synaptophysin- expressing axons co-labeled with BDA were counted at 0.5 mm or 3 mm rostral to the SCI crush, and are expressed as percent of BDA labeled axons at respective distances. Confocal images of CST axons (BDA) co-labeled with g GAP43 or i Synaptophysin (Syn) at 0.5 mm rostral to the lesion center. h Quantitation of CST axons expressing GAP43 at 0.5 and 3 mm rostral to lesion center. j Quantitation of CST axon terminals expressing Syn at 0.5 mm rostral to lesion center. All bars represent mean ± SEM. Statistical test: f two-way ANOVA with Bonferroni post-hoc test, n = 7 mice per condition; h, j two-tailed t-test compared to AAV-GFP in each area. n = 5 mice per condition in h and 3 mice per condition in j.
Fig. 8
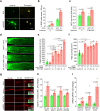
Fig. 8. REST inactivation stimulates axon outgrowth from RGCs, optic nerve regeneration, and RGC neuroprotection.
ac Effect of REST inactivation on adult rat RGCs in culture. Mice received intraocular injections of either AAV2-d/nREST (d/nREST) or AAV2-GFP (GFP) one week prior to retina dissociation. RGC culture was maintained in the presence or absence of forskolin (to elevate cAMP), mannose, and recombinant oncomodulin (F + M + Ocm) for 3 days. a GAP-43 immunostaining of RGCs (identified via retrograde labeling with Fluorogold injected into the superior colliculus 7 days earlier). b Axon outgrowth represented as percentage of RGCs with axons ≥ 30 µm. c RGC survival in culture. df Effects of REST deletion or antagonism on optic nerve regeneration and RGC survival in vivo. REST deletion was obtained by intraocular injection of AAV2-Cre in RESTflx/flx mice. REST antagonism was obtained by intraocular injection of AAV2-d/n-REST (d/n) in wildtype (WT) mice. In addition to inactivating REST, some WT mice received recombinant Ocm plus CPT-cAMP (Ocm + cAMP). Control mice (green bar in E, F) were pooled from RESTflx/flx mice and WT receiving AAV-GFP. d Longitudinal sections of CTB-labeled axons through the optic nerve. Asterisk: nerve injury site. e Quantitation of regenerating axons 500 µm distal to the injury site and f RGC survival. g, h ATF3, SOX11, pSTAT3, and pCREB changes one day after nerve crush in RGC receiving control (Ctr, AAV2-GFP) or AAV2-d/n-REST (d/n). g Representative immunohistochemistry images of RGCs. Inserts show higher magnification. TUJ1: RGCs, green; DAPI: nuclei, blue; target genes: red. h Quantitation of RGCs expressing each REST target genes. i Gap43, Sprr1a and Bdnf mRNA levels seven days after nerve crush in FACS-selected RGCs expressing GFP or d/n REST. All bars represent mean ± SEM. Statistical tests: b, c: two-tailed t-test, n = 4 biological replicates in each condition; e, f: one-way ANOVA with Bonferroni post-hoc test, n = 12 mice for GFP/-, n = 8 mice for GFP/ + , n = 9 mice for d/n/-, n = 6 mice for d/n/+, n = 10 mice for Cre/-, n = 5 mice for sh/-, n = 3 mice for d/n+sh/-; h, i multiple two-tailed t-test, n = 4 mice for Ctr and n = 6 mice for d/n. Scale bar in a: 20 µm, in D: 200 µm, in g: 15 µm.

Similar articles

Cited by

References

    1. Cajal, S. R. Cajal’s degeneration and regeneration of the nervous system. (History of Neuroscience, 1991).
    1. Zheng B, et al. Genetic deletion of the Nogo receptor does not reduce neurite inhibition in vitro or promote corticospinal tract regeneration in vivo. Proc. Natl Acad. Sci. USA. 2005;25:1205–1210. doi: 10.1073/pnas.0409026102. - DOI - PMC - PubMed
    1. Benowitz LI, He Z, Goldberg JL. Reaching the brain: advances in optic nerve regeneration. Exp. Neurol. 2017;287:365–373. doi: 10.1016/j.expneurol.2015.12.015. - DOI - PubMed
    1. Park KK, et al. Promoting axon regeneration in the adult CNS by modulation of the PTEN/mTOR pathway. Science. 2008;322:963–966. doi: 10.1126/science.1161566. - DOI - PMC - PubMed
    1. Kurimoto T, et al. Long-distance axon regeneration in the mature optic nerve: contributions of oncomodulin, cAMP, and pten gene deletion. J. Neurosci. 2010;30:15654–15663. doi: 10.1523/JNEUROSCI.4340-10.2010. - DOI - PMC - PubMed

Publication types

Substances