. 2022 Jul 29;13(7):662.
doi: 10.1038/s41419-022-05121-z.

Hypoxia aggravates ferroptosis in RPE cells by promoting the Fenton reaction

Affiliations

Hypoxia aggravates ferroptosis in RPE cells by promoting the Fenton reaction

Yoshiyuki Henning et al. Cell Death Dis. .

Abstract

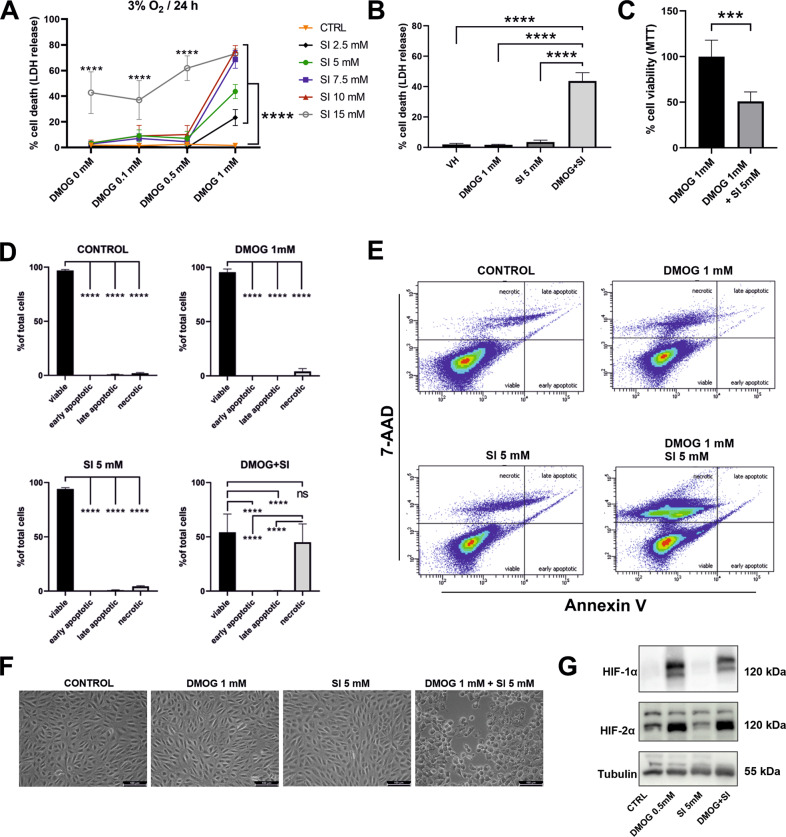
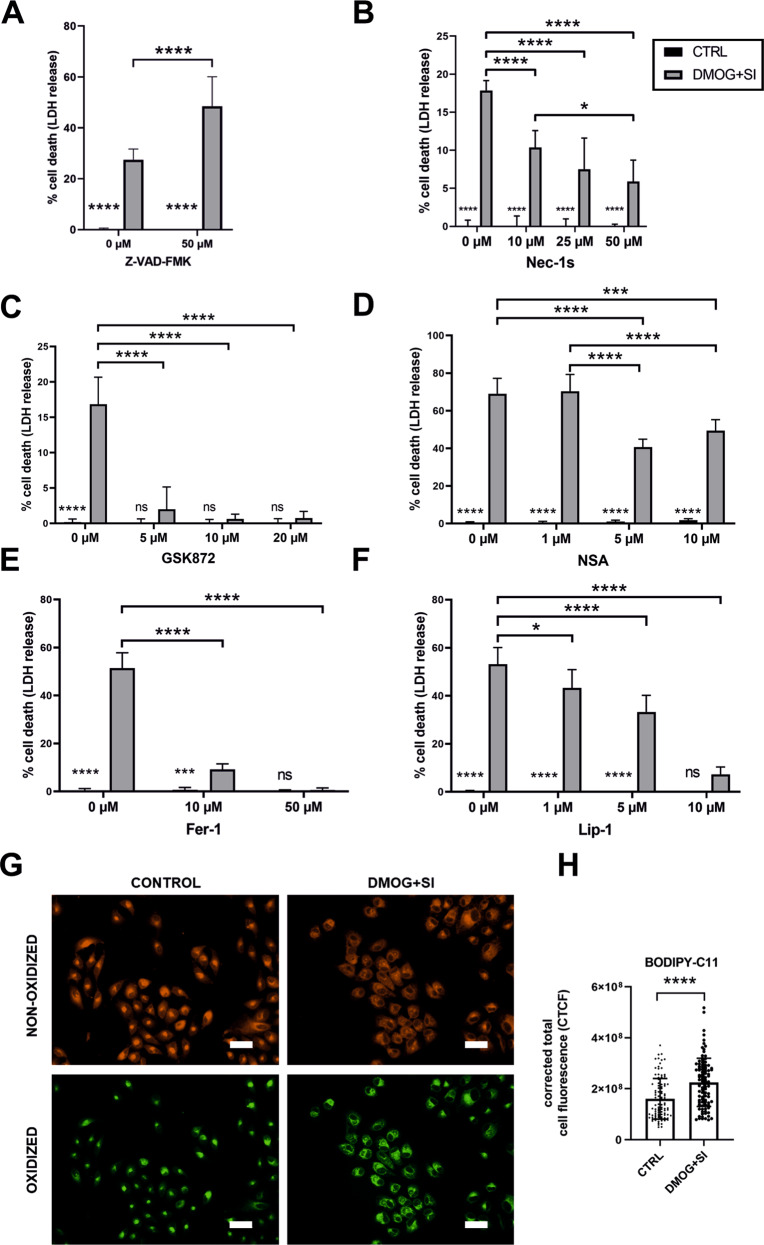
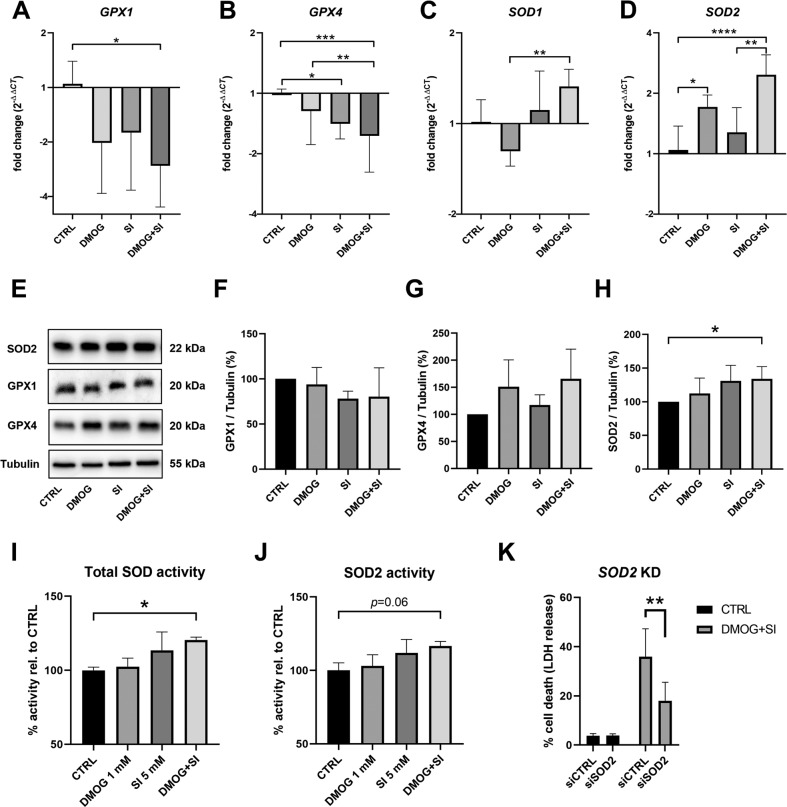
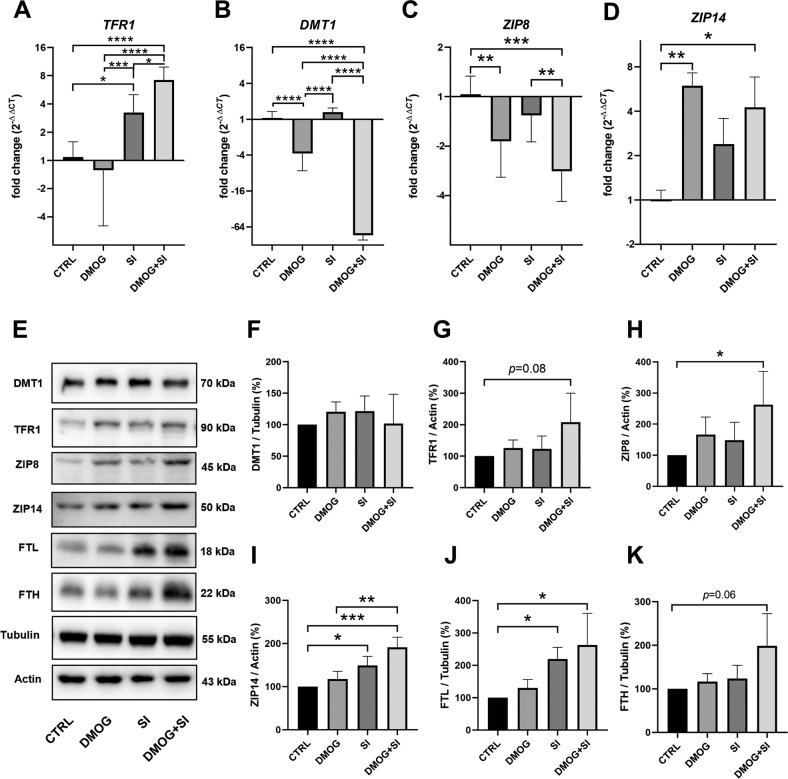
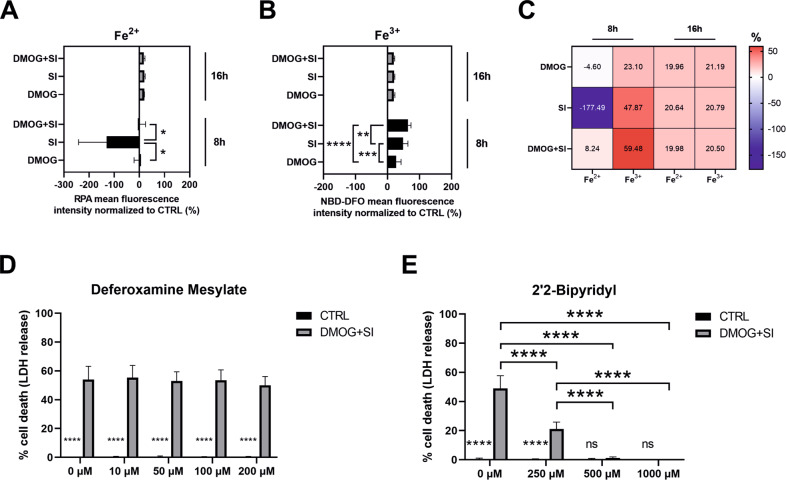
Oxidative stress and hypoxia in the retinal pigment epithelium (RPE) have long been considered major risk factors in the pathophysiology of age-related macular degeneration (AMD), but systematic investigation of the interplay between these two risk factors was lacking. For this purpose, we treated a human RPE cell line (ARPE-19) with sodium iodate (SI), an oxidative stress agent, together with dimethyloxalylglycine (DMOG) which leads to stabilization of hypoxia-inducible factors (HIFs), key regulators of cellular adaptation to hypoxic conditions. We found that HIF stabilization aggravated oxidative stress-induced cell death by SI and iron-dependent ferroptosis was identified as the main cell death mechanism. Ferroptotic cell death depends on the Fenton reaction where H2O2 and iron react to generate hydroxyl radicals which trigger lipid peroxidation. Our findings clearly provide evidence for superoxide dismutase (SOD) driven H2O2 production fostering the Fenton reaction as indicated by triggered SOD activity upon DMOG + SI treatment as well as by reduced cell death levels upon SOD2 knockdown. In addition, iron transporters involved in non-transferrin-bound Fe2+ import as well as intracellular iron levels were also upregulated. Consequently, chelation of Fe2+ by 2'2-Bipyridyl completely rescued cells. Taken together, we show for the first time that HIF stabilization under oxidative stress conditions aggravates ferroptotic cell death in RPE cells. Thus, our study provides a novel link between hypoxia, oxidative stress and iron metabolism in AMD pathophysiology. Since iron accumulation and altered iron metabolism are characteristic features of AMD retinas and RPE cells, our cell culture model is suitable for high-throughput screening of new treatment approaches against AMD.


Conflict of interest statement

The authors declare no competing interests.

Figures

Fig. 1
Fig. 1. HIF stabilization aggravated SI-induced cell death in ARPE-19.
A ARPE-19 cells were treated with different concentrations of SI, DMOG or a combination of both compounds for 24 h under 3% O2 and cell death was assessed by measuring LDH release (N = 5-6). B A subset of LDH data showing cell death in ARPE-19 cells treated with 1 mM DMOG, 5 mM SI, and co-treatment with DMOG and SI where approximately 50% of cells were dead after 24 h (B). Cell death rate was further confirmed by C MTT assay and D FACS Annexin V assay. E Histograms of FACS Annexin V-PE and 7-AAD stained cells treated with DMOG and/or SI. F Microscopic evaluation confirmed advanced cell death by co-treatment with 1 mM DMOG and 5 mM SI. G HIF-1α and -2α protein levels were increased by DMOG treatment as well as co-treatment with SI for 24 h under 3% O2. Data are presented as means + SD. LDH, MTT, and FACS assays (5–6 independent groups) were statistically analyzed with two-way ANOVA, t-test, and one-way ANOVA, respectively. ns = not significant, ***p < 0.001, and ****p < 0.0001. Scale bar = 100 μm.
Fig. 2
Fig. 2. Ferroptosis inhibitors rescued cells from cell death.
ARPE-19 cells were treated with DMOG and SI and co-treated with inhibitors of apoptosis, necroptosis, and ferroptosis. Treatment with A the apoptosis inhibitor Z-VAD increased DMOG + SI-induced cell death. B RIPK1 inhibitor Nec-1s, C RIPK3 inhibitor GSK872, and D MLKL inhibitor necrosulfonamide (NSA) are efficient inhibitors of necroptosis, but only RIPK3 inhibition by GSK872 fully rescued cells from cell death. Both ferroptosis inhibitors E Fer-1 and F Lip-1 fully rescued ARPE-19 cells from DMOG + SI-induced cell death. To further confirm ferroptotic cell death, cells were stained with the lipid peroxidation probe C11-BODIPY581/591 which revealed mainly perinuclear localization of lipid peroxidation-induced green fluorescence (G). H Quantification of cell fluorescence revealed significantly higher corrected total cell fluorescence in DMOG + SI treated cells compared to controls. Data are presented as means + SD. Inhibition assays were conducted with 6 independent groups (except for NSA treatment; N = 4) and statistical significance was calculated with two-way ANOVA. C11-BODIPY581/591 staining was assessed in 3 independent groups (n = 100) and statistical analysis was conducted with t-test. ns not significant, *p < 0.05, ***p < 0.001, and ****p < 0.0001. Scale bar = 50 μm.
Fig. 3
Fig. 3. Analysis of antioxidant mechanisms revealed upregulated SOD activity, which contributed to cell death.
AD GPX1, GPX4, SOD1, SOD2 transcript levels were determined by qRT-PCR in DMOG and/or SI treated ARPE-19 cells. While GPX1 and GPX4 expression levels were mainly decreased by the treatments, especially SOD2 expression was upregulated by DMOG and DMOG + SI co-treatment compared to controls. EH To validate if transcript levels reflected protein levels, GPX1, GPX4, and SOD2 protein levels were analyzed by Western blot. Only SOD2 protein levels were significantly increased by DMOG + SI co-treatment, which was also reflected by higher SOD activities (I, J). K In contradiction to the protective effect of SODs, SOD2 knockdown (SOD2 KD) rescued cells from cell death suggesting that SOD activity contributes to DMOG + SI-induced cells death. Data are presented as means + SD. Western blots (3-4 independent groups) and qRT-PCR (6 independent groups) were statistically analyzed with one-way ANOVA. SOD2 knockdown effects (6 independent groups) were analyzed with two-way ANOVA. *p < 0.05, **p < 0.01, ***p < 0.001, and ****p < 0.0001.
Fig. 4
Fig. 4. Iron transporters involved in non-transferrin-bound Fe2+ import were upregulated in DMOG + SI co-treated ARPE-19 cells.
Transcript levels of A TFR1 were significantly upregulated and B DMT1 were significantly downregulated compared to all treatments. Gene expression of non-transferrin-bound iron importers C ZIP8 was significantly downregulated and D ZIP14 was upregulated by DMOG + SI co-treatment compared to controls. EI Analysis of iron importers on protein level revealed that only ZIP8 and ZIP14 were significantly upregulated by DMOG + SI co-treatment. J The ferritin subunit FTL was significantly upregulated in SI- and DMOG + SI co-treated cells, while the other subunit FTH showed a trend towards upregulation in DMOG + SI co-treated cells (K). Data are presented as means + SD. Western blots (3 independent groups) and qRT-PCR (6 independent groups) were statistically analyzed with one-way ANOVA. *p < 0.05, **p < 0.01, ***p < 0.001, and ****p < 0.0001.
Fig. 5
Fig. 5. DMOG + SI co-treatment is likely to promote the Fenton reaction in DMOG + SI co-treated ARPE-19 cells.
AC The Fe2+-specific fluorescence sensor RPA revealed significantly lower Fe2+ levels in SI-treated cells compared to controls after 8 h at 3% O2 while no difference between controls and DMOG + SI co-treated cells were detected. In contrast, Fe3+ levels were significantly increased by DMOG + SI co-treatment compared to the other treatment groups after 8 h, which was assessed with the Fe3+-specific fluorescence sensor NBD-DFO. After 16 h, iron levels were similar in all treatment groups. While chelation of Fe3+ by Deferoxamine Mesylate (D) did not improve cell viability, Fe2+ chelation by 2’2-Bipyridyl E resulted in full rescue of cells suggesting that Fe2+ plays a detrimental role in DMOG + SI-induced ferroptosis. Data are presented as means + SD. RPA and NBD-DFO assays (3 independent groups) were statistically analyzed with one-way ANOVA and LDH assays were analyzed with two-way ANOVA. SOD2 knockdown (6 independent groups) were analyzed with two-way ANOVA. ns not significant, *p < 0.05, **p < 0.01, ***p < 0.001, and ****p < 0.0001.

Similar articles

Cited by

References

    1. Fernandes AR, Zielińska A, Sanchez-Lopez E, dos Santos T, Garcia ML, Silva AM, et al. Exudative versus nonexudative age-related macular degeneration: Physiopathology and treatment options. Int J Mol Sci. 2022;23. 10.3390/ijms23052592. - PMC - PubMed
    1. Wong WL, Su X, Li X, Cheung CMG, Klein R, Cheng CY, et al. Global prevalence of age-related macular degeneration and disease burden projection for 2020 and 2040: A systematic review and meta-analysis. Lancet Glob Health. 2014;2:e106–e116. doi: 10.1016/S2214-109X(13)70145-1. - DOI - PubMed
    1. Arjamaa O, Nikinmaa M, Salminen A, Kaarniranta K. Regulatory role of HIF-1alpha in the pathogenesis of age-related macular degeneration (AMD) Ageing Res Rev. 2009;8:349–58. doi: 10.1016/j.arr.2009.06.002. - DOI - PubMed
    1. Kurihara T, Westenskow PD, Gantner ML, Usui Y, Schultz A, Bravo S, et al. Hypoxia-induced metabolic stress in retinal pigment epithelial cells is sufficient to induce photoreceptor degeneration. eLife. 2016;5. 10.7554/eLife.14319. - PMC - PubMed
    1. Soundara Pandi SP, Ratnayaka JA, Lotery AJ, Teeling JL. Progress in developing rodent models of age-related macular degeneration (AMD). Exp Eye Res. 2021;203. 10.1016/j.exer.2020.108404. - PubMed

Publication types