. 2022 Jul 29;12(1):302.
doi: 10.1038/s41398-022-02078-7.

TOB is an effector of the hippocampus-mediated acute stress response

Affiliations

TOB is an effector of the hippocampus-mediated acute stress response

Mohieldin M M Youssef et al. Transl Psychiatry. .

Abstract

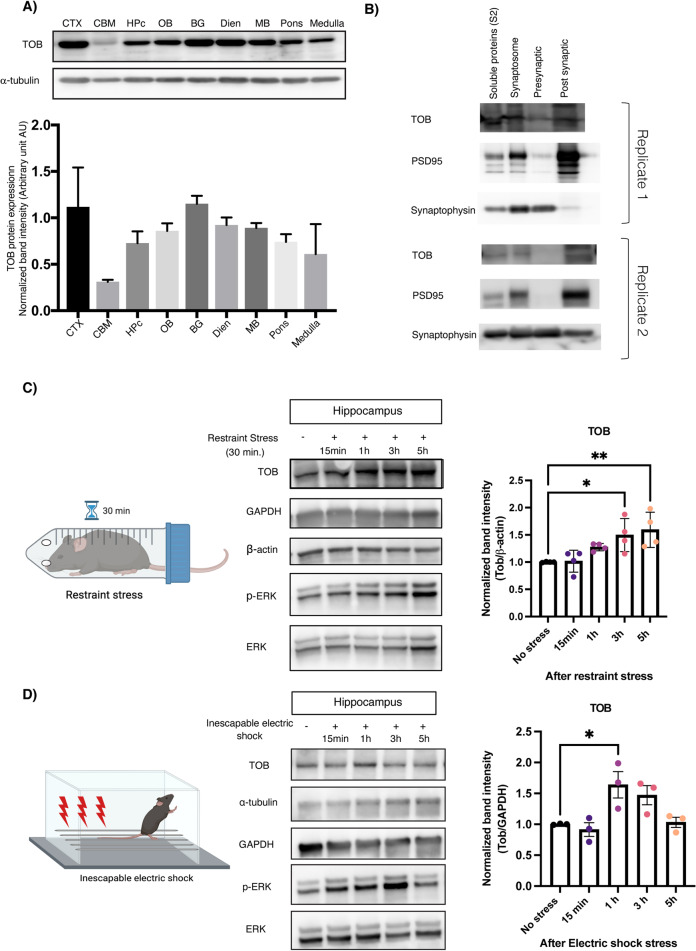
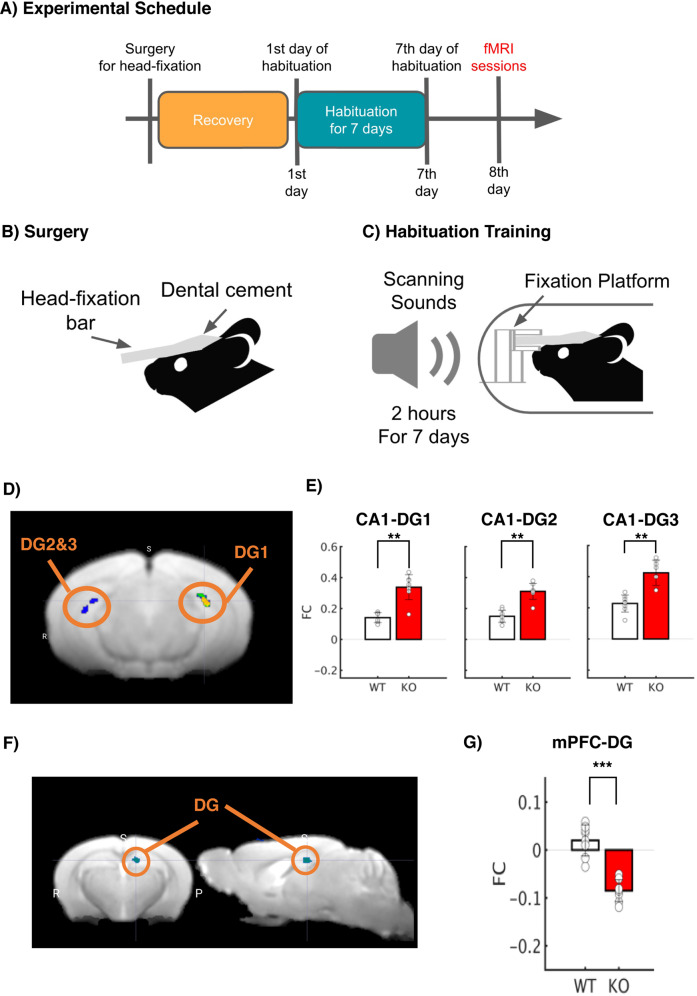
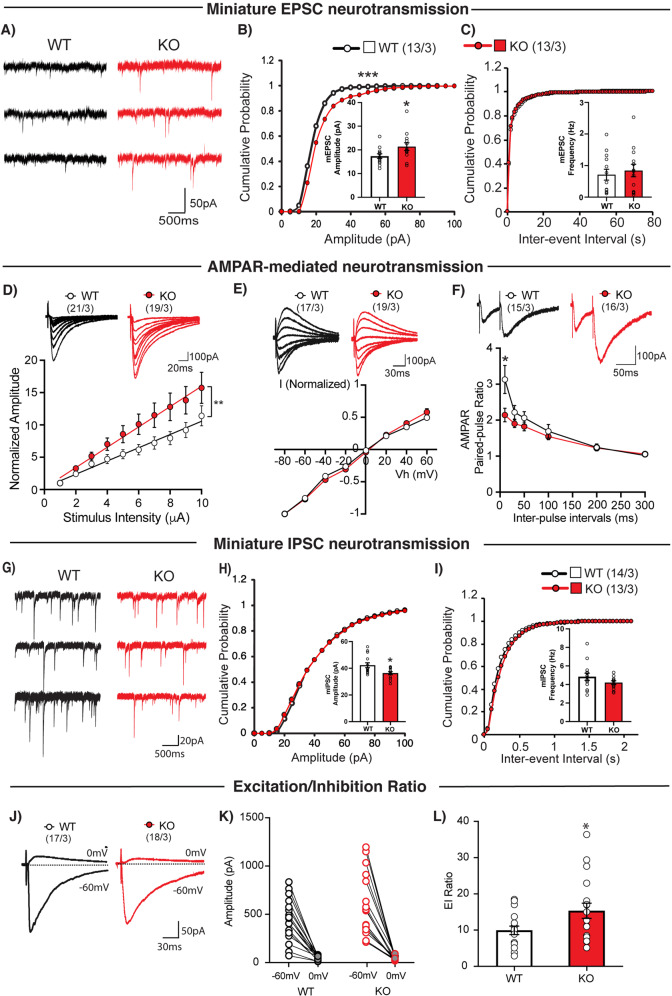
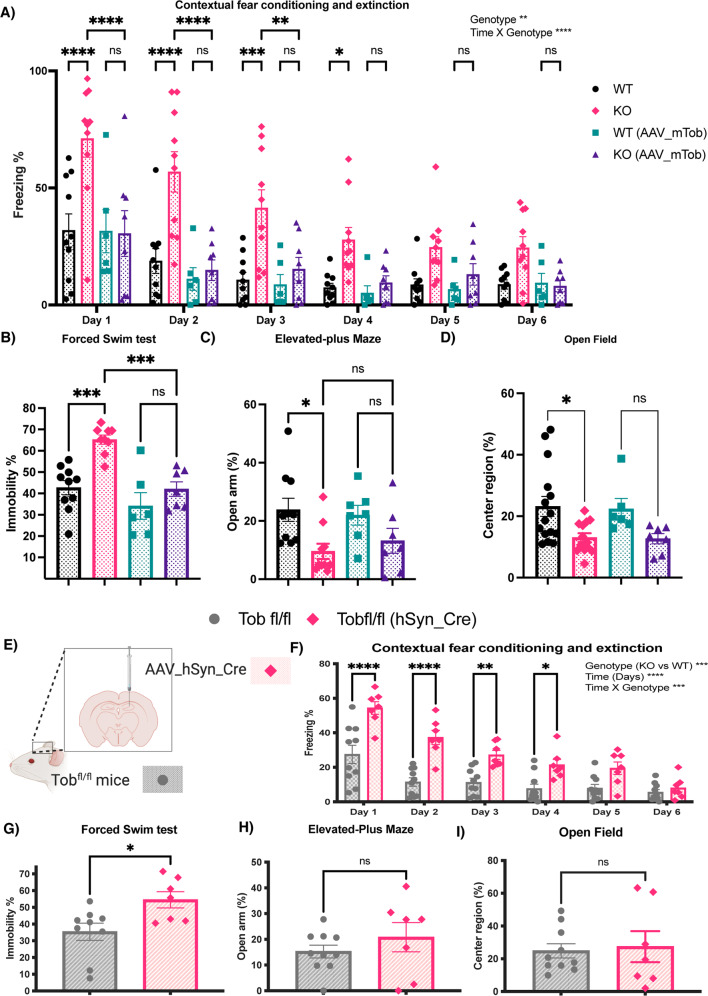
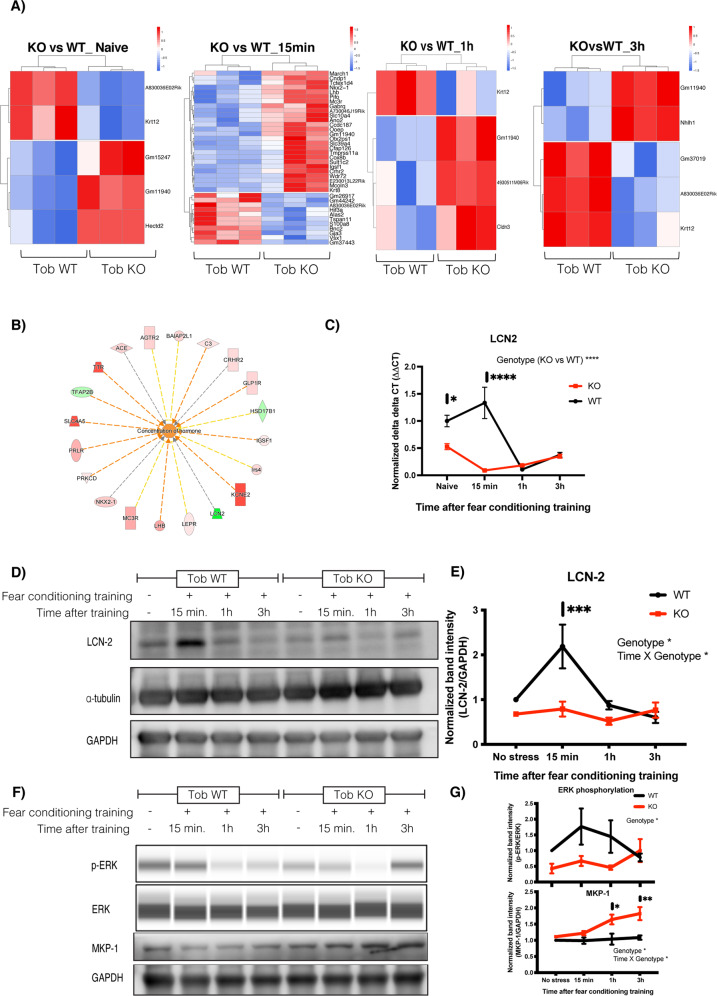
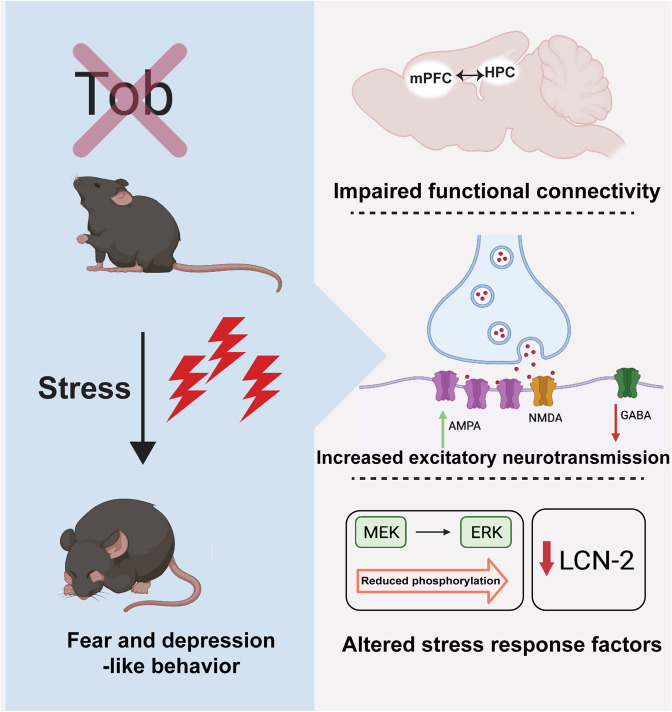
Stress affects behavior and involves critical dynamic changes at multiple levels ranging from molecular pathways to neural circuits and behavior. Abnormalities at any of these levels lead to decreased stress resilience and pathological behavior. However, temporal modulation of molecular pathways underlying stress response remains poorly understood. Transducer of ErbB2.1, known as TOB, is involved in different physiological functions, including cellular stress and immediate response to stimulation. In this study, we investigated the role of TOB in psychological stress machinery at molecular, neural circuit, and behavioral levels. Interestingly, TOB protein levels increased after mice were exposed to acute stress. At the neural circuit level, functional magnetic resonance imaging (fMRI) suggested that intra-hippocampal and hippocampal-prefrontal connectivity were dysregulated in Tob knockout (Tob-KO) mice. Electrophysiological recordings in hippocampal slices showed increased postsynaptic AMPAR-mediated neurotransmission, accompanied by decreased GABA neurotransmission and subsequently altered Excitatory/Inhibitory balance after Tob deletion. At the behavioral level, Tob-KO mice show abnormal, hippocampus-dependent, contextual fear conditioning and extinction, and depression-like behaviors. On the other hand, increased anxiety observed in Tob-KO mice is hippocampus-independent. At the molecular level, we observed changes in factors involved in stress response like decreased stress-induced LCN2 expression and ERK phosphorylation, as well as increased MKP-1 expression. This study introduces TOB as an important modulator in the hippocampal stress signaling machinery. In summary, we reveal a molecular pathway and neural circuit mechanism by which Tob deletion contributes to expression of pathological stress-related behavior.


Conflict of interest statement

The authors declare no competing interests.

Figures

Fig. 1
Fig. 1. TOB protein expression levels increase in response to stress.
A Expression patterns of TOB in lysates of different mouse brain regions (n = 3). B Immunoblotting of TOB, synaptophysin, and PSD-95 in hippocampal fractionated lysates: soluble fraction S2, synaptoneurosomes, pre-synaptic, and post-synaptic fractions. C Western blotting of TOB expression levels in hippocampal lysates without stress and after 30 min of restraint stress at different times: 15 min, 1 h, 3 h, 5 h after stress exposure (n = 4). D Western blotting of TOB expression levels in hippocampal lysates without stress and after inescapable electric shock for different durations: 15 min, 1 h, 3 h, 5 h post-exposure to stress (n = 3). One-way analysis of variance (ANOVA) followed by Dunnett’s post-hoc correction for multiple comparisons: statistical significance *p < 0.05 **p < 0.01 when compared to control (No stress). Data are presented as means ± SEMs.
Fig. 2
Fig. 2. Deletion of Tob alters brain functional connectivity.
A Experimental Schedule. After surgery to introduce a head-fixation bar on the skull, mice were allowed to recovery. After recovery periods, mice underwent habituation training 2 h for 7 days prior to fMRI sessions. B Surgery. A plastic head-fixation bar was mounted on the skull with dental cement. C Habituation Training. In order to reduce scanning stress, mice were fixated with a fixation platform, and their bodies were constrained in a plastic tube. They were exposed to scanning sounds for 2 h for 7 days in order to reduce stress responses. D Statistical functional map with the seed region, CA1. Average BOLD signals were extracted from bilateral CA1. Seed-based functional connectivity was performed, and a statistical map was visualized (p < 0.05 after cluster correction; Fig. S1). E Functional connectivity with the bilateral CA1 seed. Seed-based FC analysis revealed statistically significant FC in CA1-DG1-3 in the Tob KO group with Mann–Whitney U test (**p < 0.01 with Bonferroni Correction). F Statistical functional map with the seed region, mPFC. Average BOLD signals were extracted from the mPFC. Seed-based functional connectivity was performed, and a statistical map was visualized (p < 0.05 after cluster correction; Fig. S1). G Functional connectivity with the mPFC seed. Seed-based FC analysis revealed statistically significant FC in mPFC-DG in the Tob KO group (***p < 0.001 with Bonferroni Correction).
Fig. 3
Fig. 3. Altered excitatory/inhibitory balance in Tob-KO hippocampal slices.
A Representative traces of mEPSCs recorded from hippocampal pyramidal neurons of wild-type (WT, left traces) and Tob knockout (KO, right traces) at Vh of -70 mV in the presence of 1 μM tetrodotoxin and 100 μM PTX. Scale bars, 50 pA and 500 ms. B Cumulative distribution plots and summary bar graphs for mEPSC amplitude (inset shows the average mEPSC amplitude) in CA1 hippocampal pyramidal neurons of wild-type (white column) and Tob-KO (gray column) mice. ***p < 0.0001 by Kolmogorov-Smirnov test in the cumulative distribution plot and *p = 0.0453 by unpaired Student’s t test in the bar graph. C Cumulative distribution plots and summary bar graphs for the mEPSC inter-event interval (inset shows the average of mEPSC frequency) in CA1 hippocampal pyramidal neurons of wild-type (white column) and Tob-KO (gray column) mice. p = 0.4611 by Kolmogorov-Smirnov test in the cumulative distribution plot and p = 0.6164 by unpaired Student’s t test in the bar graph. D Sample traces (upper panel) and summary plots for the input-output relationship of AMPA receptor-mediated responses recorded from wild-type (open circles) and Tob-KO (gray circles) mice. Scale bars, 100 pA and 20 ms. **p = 0.0039 by Mann-Whitney U test. E Sample traces (upper panel) and summary plots for the IV curve of AMPA receptor-mediated responses recorded from wild-type (open circles) and Tob-KO (gray circles) mice. Scale bars, 100 pA and 30 ms. F Sample traces with 50-ms inter-pulse interval (upper panel) and summary plots for paired-pulse ratio of AMPA receptor-mediated responses at 10, 30, 50, 100, 200, and 300 ms inter-pulse intervals recorded from wild-type (open circles) and Tob-KO (gray circles) mice. Scale bars, 100 pA and 50 ms. *p = 0.0139 by by Mann-Whitney U test; ***p < 0.0011 by Two-way ANOVA with Sidak’s multiple comparisons test. G Representative traces of mIPSCs recorded from hippocampal pyramidal neurons of wild-type (WT, left traces) and Tob-KO (KO, right traces) at Vh of -70 mV in the presence of 1 μM tetrodotoxin and 100 μM PTX. Scale bars, 20 pA and 500 ms. H Cumulative distribution plots and summary bar graphs for mIPSC amplitude (inset shows the average of mIPSC amplitude) in CA1 hippocampal pyramidal neurons of wild-type (white column) and Tob-KO (gray column) mice. *p = 0.0120 by unpaired Student’s t test in the bar graph. I Cumulative distribution plots and summary bar graphs for the mIPSC inter-event interval (inset shows the average of mIPSC frequency) in CA1 hippocampal pyramidal neurons of wild-type (white column) and Tob-KO (gray column) mice. p = 0.9311 by Kolmogorov-Smirnov test in the cumulative distribution plot and p = 0.1633 by unpaired Student’s t test in the bar graph. J Representative traces of evoked EPSCs at Vh = -60 mV and evoked IPSCs at Vh = 0 mV in wild-type (left) and Tob-KO (right) mice. Scale bars, 50 pA and 30 ms. K Amplitudes of evoked EPSCs at Vh of -60 mV and evoked IPSCs at Vh of 0 mV at each of individual recorded WT and Tob-KO hippocampal pyramidal neurons. L Average excitation/inhibition ratio from WT (open column) and Tob-KO (gray column). *p = 0.0343 by unpaired Student’s t test. Data are expressed as means ± SEMs. Total numbers of cells recorded/total numbers of mice used are indicated in parentheses.
Fig. 4
Fig. 4. Tob-KO mice show hippocampal-mediated abnormal stress-related behavior.
Behavioral analyses in Tob-WT and KO mice and after overexpression of mouse TOB using AAV (hSyn-mTob) AD. A Contextual fear conditioning and extinction expressed as percentage of time spent freezing. Two-way ANOVA followed by Bonferoni’s post-hoc test for multiple comparisons. B The forced swim test presented as a percentage of immobile time. One-way ANOVA followed by Bonferoni’s post-hoc test for multiple comparisons. C Elevated-plus maze showing the percentage of time spent in open arm. One-way ANOVA followed by Bonferoni’s post-hoc test for multiple comparisons. D Open field test showing the percentage of time spent in center region. One-way ANOVA followed by Bonferoni’s post-hoc test for multiple comparisons. Behavioral analyses in hippocampal-specific Tob-KO mice (E-I). E Schematic diagram showing the method for generation of hippocampal-specific Tob-KO (hsTobKO) mice through injection of adeno-associated virus expressing Cre recombinase under the hSyn promoter (AAV_hSyn_Cre) in mice having LoxP sequences flanking both sides of the Tob gene (Tobfl/fl). F Contextual fear conditioning and extinction in hsTobKO presented as percentage of time showing freezing. Two-way ANOVA followed by Bonferoni’s post-hoc test for multiple comparisons. G The forced swim test is presented as percentage of time spent immobile. H The elevated-plus maze showed as the time spent in the open arm. I Open field test showing the percentage of time spent in the center region. Unpaired t-test. All values represent means ± SEMs. ns non-significant, *p < 0.05, **p < 0.01, ***p < 0.001, ****p < 0.0001.
Fig. 5
Fig. 5. Abnormal transient transcriptional profile in hippocampus of Tob-KO mice and suppressed stress-induced LCN2 expression induced after fear conditioning training.
A Heatmaps for differentially expressed genes in hippocampi of Tob-KO compared to Tob-WT mice using RNA sequencing without fear conditioning training (naive) and 15 min, 1 h, 3 h after fear conditioning training (represented as z-scores of log raw counts, FCupregulated > 2 FCdownregulated < 0.5, p < 0.05, FDR < 0.05). B Pathway analysis for RNA sequencing candidates using IPA software showing activation of hormonal concentration in hippocampus of Tob KO mice at 15 min post-conditioning. C Real-time PCR for lipocalin-2 (Lcn2) mRNA in hippocampus of Tob-WT and KO naive mice and 15 min, 1 h and 3 h after fear conditioning. Two-way ANOVA followed by Bonferoni’s post-hoc test for multiple comparisons. D Western blotting showing protein expression of LCN-2 in hippocampi of naive Tob-KO mice and at 15 min, 1 h, and 3 h after fear conditioning training. E Normalized band intensity for LCN2 protein immunoblots. Two-way ANOVA followed by Bonferoni’s post-hoc test for multiple comparisons. F Western blotting showing abnormal protein expression in hippocampi of mice lacking Tob before and after fear conditioning training at 15 min, 1 h and 3 h. G Western blot band intensity quantification plots at different time points post-training compared to naive Tob-WT (p-ERK n = 4, MKP-1 n = 3). All values represent means ± SEMs. ns non-significant, *p < 0.05, **p < 0.01, ***p < 0.001, ****p < 0.0001.
Fig. 6
Fig. 6. Summary showing the role of TOB in hippocampus-mediated stress response.
Tob deletion in mice induces hippocampal-dependent pathological behaviors of increased fear and depression-like behaviors. This can be explained by the altered functional connectivity between stress-related regions like hippocampus (HPC) and medial prefrontal cortex (mPFC). Tob-deficient hippocampal neurons showed increased excitatory and decreased inhibitory neurotransmission. Stress-induced ERK phosphorylation and LCN-2 expression were lower in the hippocampus of Tob-KO mice.

Similar articles

Cited by

References

    1. Kessler RC. The effects of stressful life events on depression. Annu Rev Psychol. 1997;48:191–214. doi: 10.1146/annurev.psych.48.1.191. - DOI - PubMed
    1. Cohen S, Janicki-Deverts D, Miller GE. Psychological stress and disease. JAMA. 2007;298:1685–7. doi: 10.1001/jama.298.14.1685. - DOI - PubMed
    1. McEwen BS. The neurobiology of stress: from serendipity to clinical relevance. Brain Res. 2000;886:172–89. doi: 10.1016/S0006-8993(00)02950-4. - DOI - PubMed
    1. Sapolsky RM. Stress and the brain: individual variability and the inverted-U. Nat Neurosci. 2015;18:1344–6. doi: 10.1038/nn.4109. - DOI - PubMed
    1. Chattarji S, Tomar A, Suvrathan A, Ghosh S, Rahman MM. Neighborhood matters: divergent patterns of stress-induced plasticity across the brain. Nat Neurosci. 2015;18:1364–75. doi: 10.1038/nn.4115. - DOI - PubMed

Publication types