. 2022 Jul 29;13(1):4396.
doi: 10.1038/s41467-022-31945-6.

Cross-validation of distance measurements in proteins by PELDOR/DEER and single-molecule FRET

Affiliations

Cross-validation of distance measurements in proteins by PELDOR/DEER and single-molecule FRET

Martin F Peter et al. Nat Commun. .

Abstract

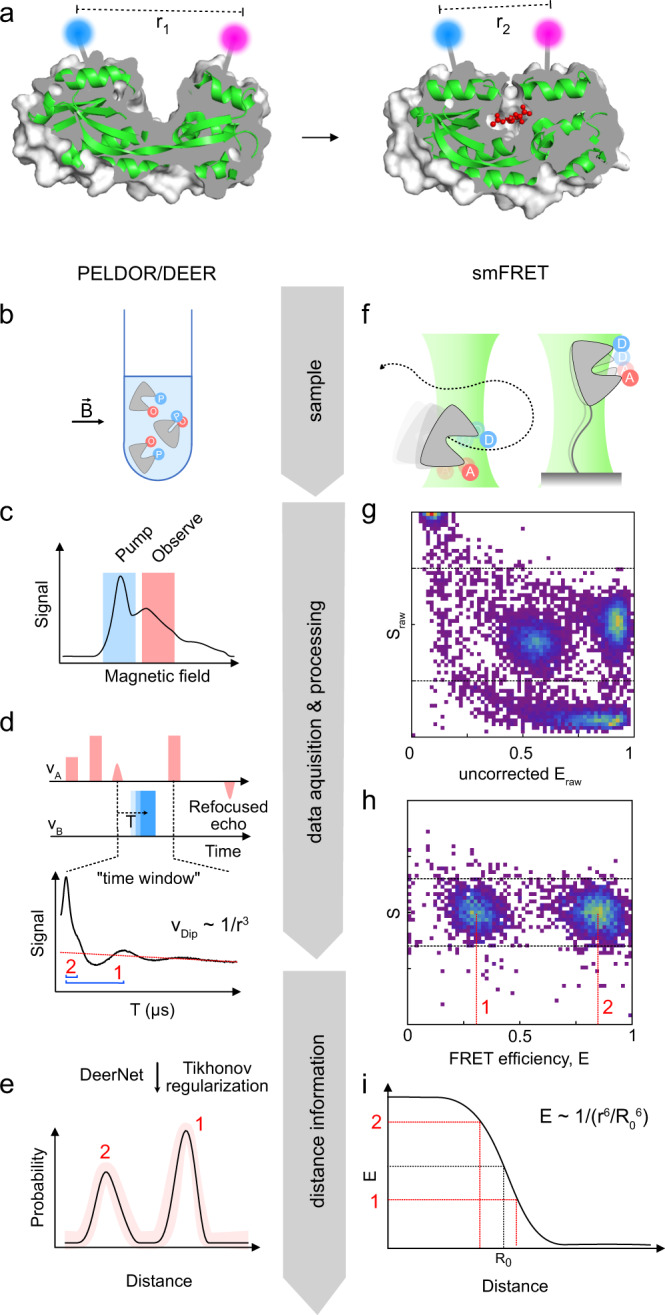
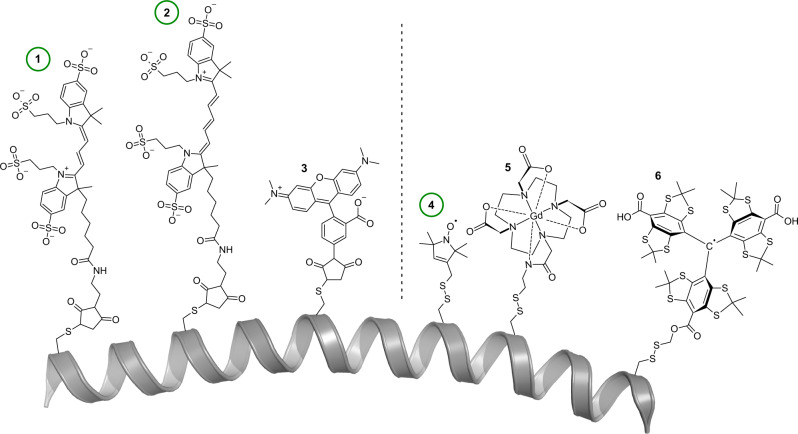
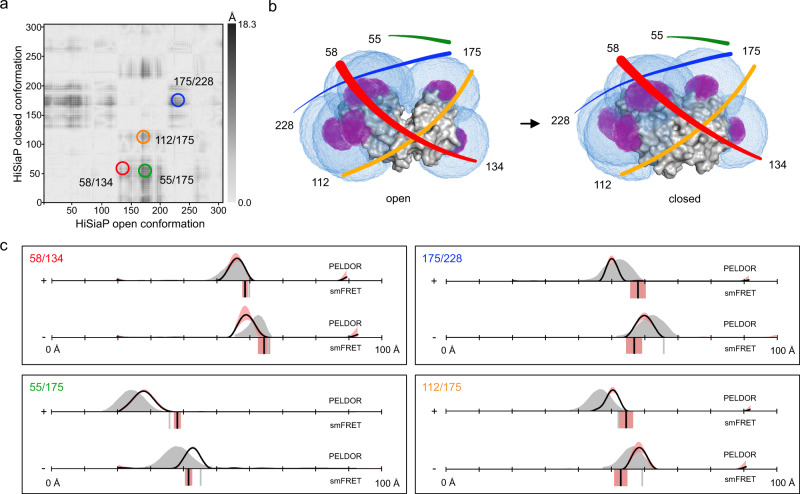
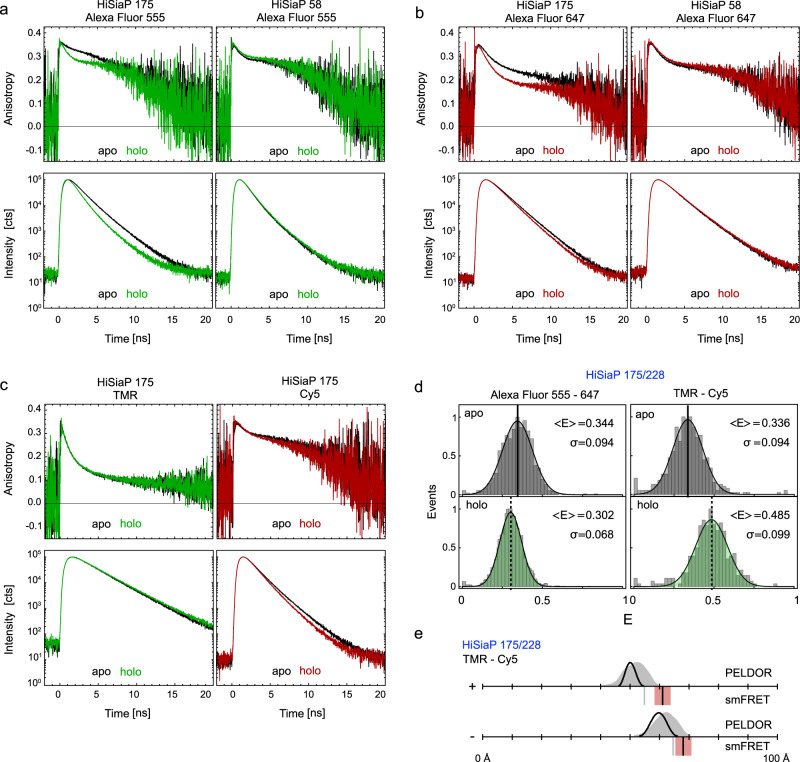
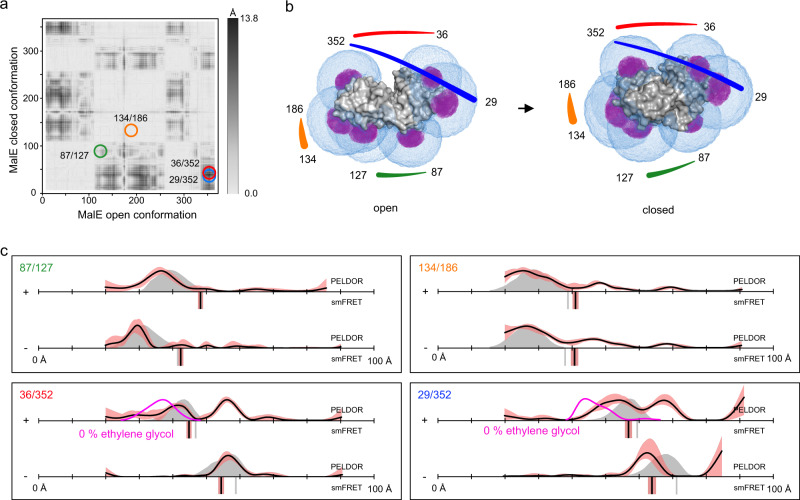
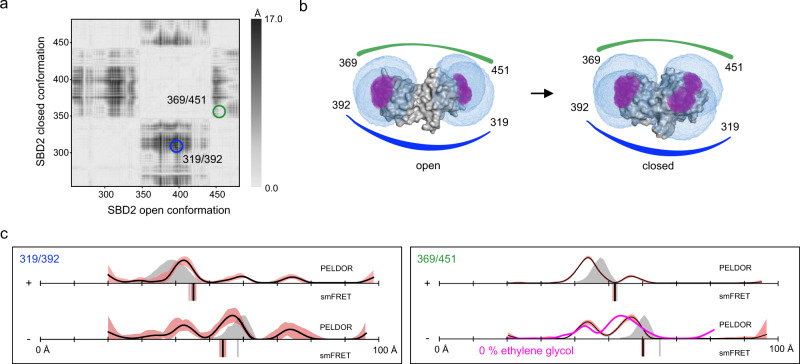
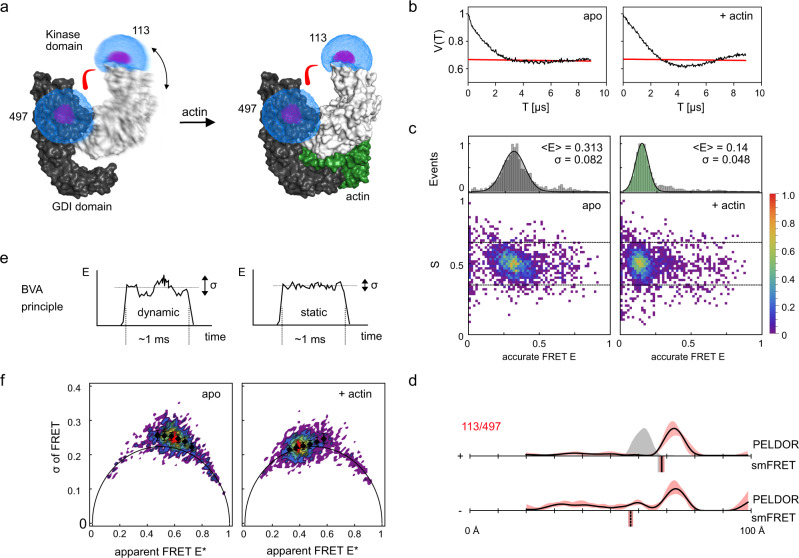
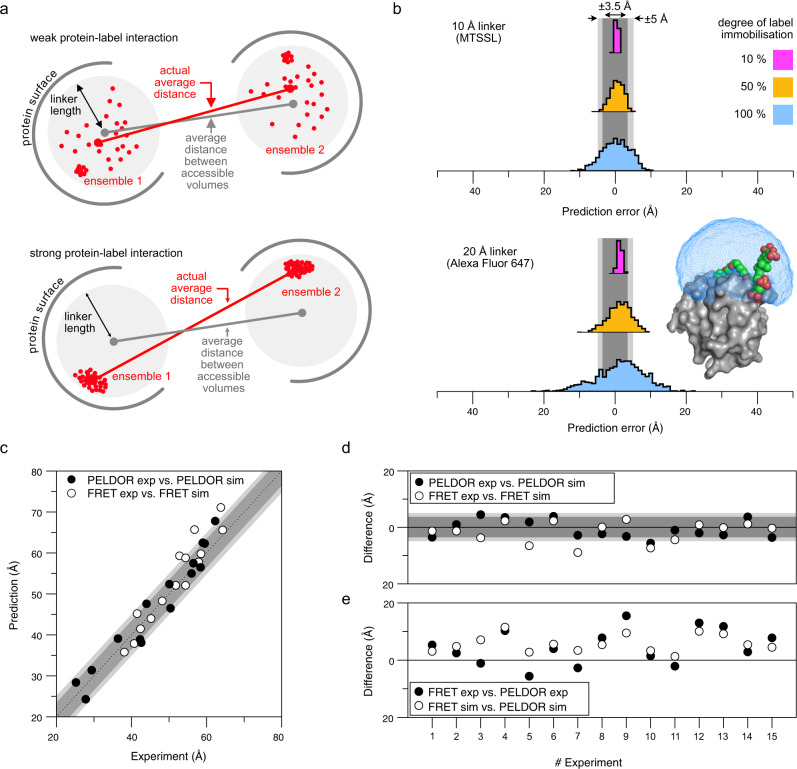
Pulsed electron-electron double resonance spectroscopy (PELDOR/DEER) and single-molecule Förster resonance energy transfer spectroscopy (smFRET) are frequently used to determine conformational changes, structural heterogeneity, and inter probe distances in biological macromolecules. They provide qualitative information that facilitates mechanistic understanding of biochemical processes and quantitative data for structural modelling. To provide a comprehensive comparison of the accuracy of PELDOR/DEER and smFRET, we use a library of double cysteine variants of four proteins that undergo large-scale conformational changes upon ligand binding. With either method, we use established standard experimental protocols and data analysis routines to determine inter-probe distances in the presence and absence of ligands. The results are compared to distance predictions from structural models. Despite an overall satisfying and similar distance accuracy, some inconsistencies are identified, which we attribute to the use of cryoprotectants for PELDOR/DEER and label-protein interactions for smFRET. This large-scale cross-validation of PELDOR/DEER and smFRET highlights the strengths, weaknesses, and synergies of these two important and complementary tools in integrative structural biology.


Conflict of interest statement

The authors declare no competing interests.

Figures

Fig. 1
Fig. 1. Following conformational changes of proteins via PELDOR/DEER or smFRET.
a Two conformations (apo, left and holo, right) of HiSiaP (green cartoon), a substrate binding protein that binds sialic acid (red balls and sticks) (PDB-IDs: 3B50 and 2CEY). A cutaway of the protein surface (grey) is shown to visualize the conformational change of the substrate binding cleft. The position of two labels is indicated by the blue and magenta spheres. be Workflow of a PELDOR/DEER experiment. fi Workflow of smFRET experiments. The individual steps (bi) are described in detail in the main text.
Fig. 2
Fig. 2. Chemical structures of labels commonly used for smFRET (left) and PELDOR/DEER (right).
Green circles identify the commonly used probes for the two methods. (1) Maleimide-thiol adducts of Alexa Fluor 555 (2) Alexa Fluor 647 were used in the present study. (3) TMR (tetramethylrhodamin-5-maleimide) and (4) The MTSSL-, (5) DOTA-Gd-, and (6) trityl- spin labels, attached to a cysteine residue via a disulfide bridge. The polypeptide chain is represented as a grey cartoon. Note that many other labels with differing coupling chemistries ranging from click-chemistry to unnatural amino acids have been developed, as well as labels that are specific for nucleic acids.
Fig. 3
Fig. 3. Distance measurements on HiSiaP.
a Difference distance map of HiSiaP in the open (PDB-ID: 2CEY) and closed (PDB-ID: 3B50) conformation. The dark spots mark protein regions that undergo large conformational changes relative to each other. The double variants for distance measurements are highlighted with circles. b Surface presentation of HiSiaP (grey) in the open (left) and closed (right) conformation. The accessible volumes of the spin label at six different labelling positions were calculated with mtsslWizard and are represented by magenta meshes. Accessible volumes of FRET label maleimide-Alexa Fluor 647 were calculated with FPS, and are shown as blue meshes. The double variants that were used for experiments are identified with coloured lines, corresponding to the circles in (a). c Distance measurements with four different double variants of HiSiaP without (−) and with (+) substrate. The PELDOR/DEER results are shown above (grey curves for simulation, black curves for experiment) and the FRET distances below the x-axis (grey bars for simulation, black bars are the mean of n = 3 independent experiments). Raw data for all experiments are provided in the Supplementary Information. The red shade around the PELDOR/DEER data is the error margin calculated using the validation tool of DeerAnalysis. The underlying principle of the validation tool is explained in the discussion section below. The red shades around the experimental smFRET distances are error bars based on the standard deviation of n = 3 independent experiments. Source data are provided as a Source Data file.
Fig. 4
Fig. 4. Time resolved fluorescence anisotropy and lifetime measurements on HiSiaP.
a Anisotropy decay curves of Alexa Fluor 555 (top row) at residue 175 (left) and 58 (right) and lifetime decay curves (bottom row) under magic angle conditions for apo (black) and holo state (green). b Same measurements as in (a) with Alexa Fluor 647 in apo (black) and holo state (red). c Anisotropy decay curves of TMR (top left) and Cy5 (top right) at residue 175 and lifetime decay curves of TMR (bottom left) and Cy5 (bottom right) under magic angle conditions for apo (black) and holo state (coloured). d FRET efficiency distributions (centre & bottom) of HiSiaP variant 175/228 for Alexa Fluor 555 – Alexa Fluor 647 (left) and TMR – Cy5 (right) in apo (grey) and holo state (green). e Converted distances from the mean FRET efficiencies are shown as black bars (mean of n = 3 independent experiments) in comparison to simulation (grey bar) and PELDOR/DEER results from Fig. 3. The red shade around the experimental smFRET distance are error bars based on the standard deviation of n = 3 independent experiments. Source data are provided as a Source Data File.
Fig. 5
Fig. 5. Distance measurements on MalE.
a Difference distance map of MalE in the open (PDB-ID: 1OMP) and closed (PDB-ID: 1ANF) conformation. Protein regions with high conformational changes are indicated as dark spots. The double variants for distance measurements are marked with circles. b Surface presentation of MalE (grey) in the open (left) and closed (right) conformation. The accessible volume of the spin label on seven different labelling positions, calculated with mtsslWizard, is represented by magenta meshes. The accessible volume of FRET label maleimide-Alexa Fluor 647, calculated with FPS is shown as blue meshes. The double variants that were used for experiments are identified with coloured lines, corresponding to the circles in (a). c Distance measurements with four different double variants of MalE without (−) and with (+) substrate. The PELDOR/DEER results are shown above (grey curves for simulation, black curves for experiment) and the FRET distance below the axis (grey bars for simulation, black bars are the mean of n = 3 independent experiments). PELDOR/DEER results without cryoprotectant are shown as magenta curves. The red shade around the PELDOR/DEER data is the error margin calculated using the validation tool of DeerAnalysis. The underlying principle of the validation tool is explained in the discussion section below. The red shades around the experimental smFRET distances are error bars based on the standard deviation of n = 3 independent experiments. Source data are provided as a Source Data file.
Fig. 6
Fig. 6. Distance measurements on SBD2.
a Difference distance map of SBD2 in the open (PDB-ID: 4KR5) and closed (PDB-ID: 4KQP) conformation. The dark spots mark protein regions that undergo large conformational changes relative to each other. The double variants for distance measurements are marked with circles. b Surface presentation of SBD2 (grey) in the open (left) and closed (right) conformation. The accessible volume of the spin label at four different labelling positions, calculated with mtsslWizard, are represented by magenta meshes and the accessible volume of FRET label maleimide-Alexa Fluor 647, calculated with FPS is shown as blue meshes. The double variants that were used for experiments are identified with coloured lines, corresponding to the circles in (a). c Distance measurements with two different double variants of SBD2 without (−) and with (+ = 1 mM) substrate. The PELDOR/DEER results are shown above (grey curves for simulation, black curves for experiment) and the FRET distance below the axis (grey bars for simulation, black bars are the mean of n = 3 independent experiments). PELDOR/DEER results without cryoprotectant are shown as magenta curves. The red shade around the DEER data is the error margin calculated using the validation tool of DeerAnalysis. The underlying principle of the validation tool is explained in the discussion section below. The red shade around the experimental smFRET distance are error bars based on the standard deviation of n = 3 independent experiments. Source data are provided as a Source Data file.
Fig. 7
Fig. 7. Distance measurements on dynamic system YopO.
a Model of the stabilization of YopO (kinase domain in grey, GDI domain in black) by binding of actin (green) (PDB-ID: 4CI6). The accessible volume of the spin label at two different labelling positions, calculated with mtsslWizard, are represented by magenta meshes and the accessible volume of FRET label maleimide-Alexa Fluor 647, calculated with FPS is shown as blue meshes. b PELDOR time traces of spin labelled variant YopO89-729 113R1/497R1 without and with actin from our previously published study. The red line indicates the background correction from DeerAnalysis c smFRET data for Alexa Fluor 555 – Alexa Fluor 647 YopO89-729 113/497 in the presence and absence of actin. d Previously published distance measurements with the YopO double variant without (−) and with (+) actin. The PELDOR/DEER results are shown above (grey curves for simulation, black curves for experiment) and the FRET distance below the axis (grey bars for simulation, black bars for experiment). Simulations for the apo state of YopO are not given, since no structural model for the apo state is available. The red shade around the DEER data is the error margin calculated using the validation tool of DeerAnalysis (Reprinted from Structure, 27/9, ref. with permission from Elsevier.). The underlying principle of the validation tool is explained in the discussion section below. The red shade around the experimental smFRET distance are error bars based on the standard deviation of n = 3 independent experiments. e Simplified schematic explaining the principle of the burst variance analysis (BVA): Dynamic systems show an increased variance in FRET efficiency during the measurement period (left) compared to the purely shot-noise limited variance of a static sample (right); please note that exchange of conformational states on timescales much faster than 100 µs can also give rise to an apparent static behaviour of the burst in BVA. f Burst variance analysis of the YopO measurement in (c) reveals a dynamic FRET state in the absence of actin (left) and a stabilized state in the presence of actin (right). The error bars represent the mean of n = 3 independent measurements and their standard deviation. Source data are provided as a Source Data file.
Fig. 8
Fig. 8. Comparison of PELDOR/DEER and smFRET measurements and the influence of linker length on the correlation between experimental and predicted distances.
a Multiple ensembles of spin- and fluorescence labels were simulated with mtsslWizard using the open form of HiSiaP (PDB-ID: 2CEY) and the labelling sites 55, 58, 112, 134, 175, and 225. In the schematic, the radius of the sphere represents the length of the linker that connects the fluorophore or spin centre to the C-alpha atom of the labelled residue. Interactions with the protein surface (grey arcs) are indicated and lead to a clustering of labels at that position. Depending on the degree of interaction between protein and label, the accessible volume approach becomes less accurate. b Histograms of 1000 simulations described in (a) with a 10 Å linker (upper plot) and 20 Å linker (lower plot) and varying degree of protein label interaction. The percentage indicates how many percent of the 1000 dummy atoms are localized at the interaction site. As an example for a long (20 Å) and immobilized linker, the protein structure of MMP-12 (matrix metalloproteinases, PDB-ID: 5L79) in conjugation with a Cy5.5 fluorophore (K241, coloured spheres) was selected. The surface of the protein is shown in grey and the accessible volume of the fluorophore, calculated with FPS is shown as a blue mesh. The dark- and light-grey shades represent the error margins of ±3.5 and ±5.0 Å that are often given for PELDOR/DEER and smFRET experiments, respectively. c Predicted vs experimental smFRET or PELDOR/DEER distances of datasets that were measured with both methods in this study. d As (c) but the differences are plotted against the experiment number in Supplementary Table 2. e Comparison of the distances determined by PELDOR/DEER or smFRET and the simulation for the same experiment. Source data are provided as a Source Data file.

Similar articles

Cited by

References

    1. Locher KP. Structure and mechanism of ATP-binding cassette transporters. Philos. Trans. R. Soc. B: Biol. Sci. 2009;364:239–245. doi: 10.1098/rstb.2008.0125. - DOI - PMC - PubMed
    1. Thomas C, Tampé R. Structural and mechanistic principles of ABC transporters. Annu. Rev. Biochem. 2020;89:605–636. doi: 10.1146/annurev-biochem-011520-105201. - DOI - PubMed
    1. Huse M, Kuriyan J. The conformational plasticity of protein kinases. Cell. 2002;109:275–282. doi: 10.1016/S0092-8674(02)00741-9. - DOI - PubMed
    1. Loveridge EJ, Behiry EM, Guo J, Allemann RK. Evidence that a ‘dynamic knockout’in Escherichia coli dihydrofolate reductase does not affect the chemical step of catalysis. Nat. Chem. 2012;4:292–297. doi: 10.1038/nchem.1296. - DOI - PubMed
    1. Jumper J, et al. Highly accurate protein structure prediction with AlphaFold. Nature. 2021;596:583–589. doi: 10.1038/s41586-021-03819-2. - DOI - PMC - PubMed

Publication types