. 2022 Jul 29;13(1):4403.
doi: 10.1038/s41467-022-32115-4.

Functional neuronal circuitry and oscillatory dynamics in human brain organoids

Affiliations

Functional neuronal circuitry and oscillatory dynamics in human brain organoids

Tal Sharf et al. Nat Commun. .

Abstract

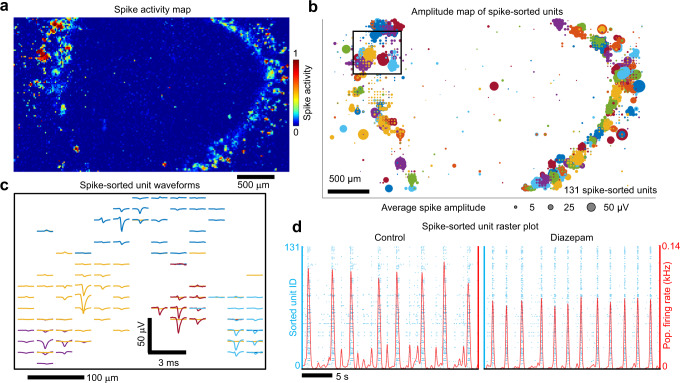
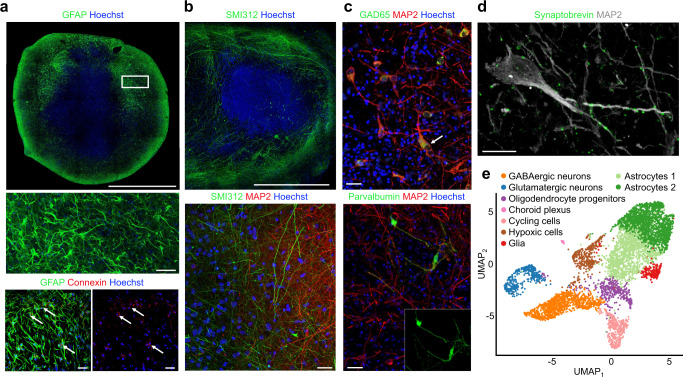
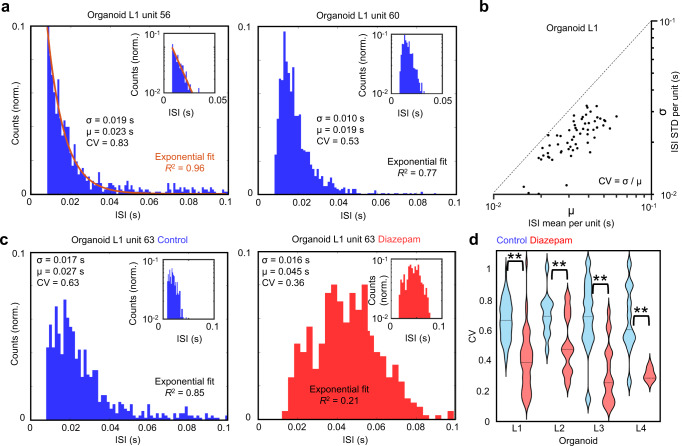
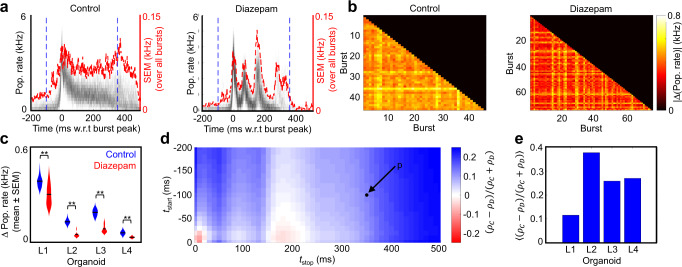
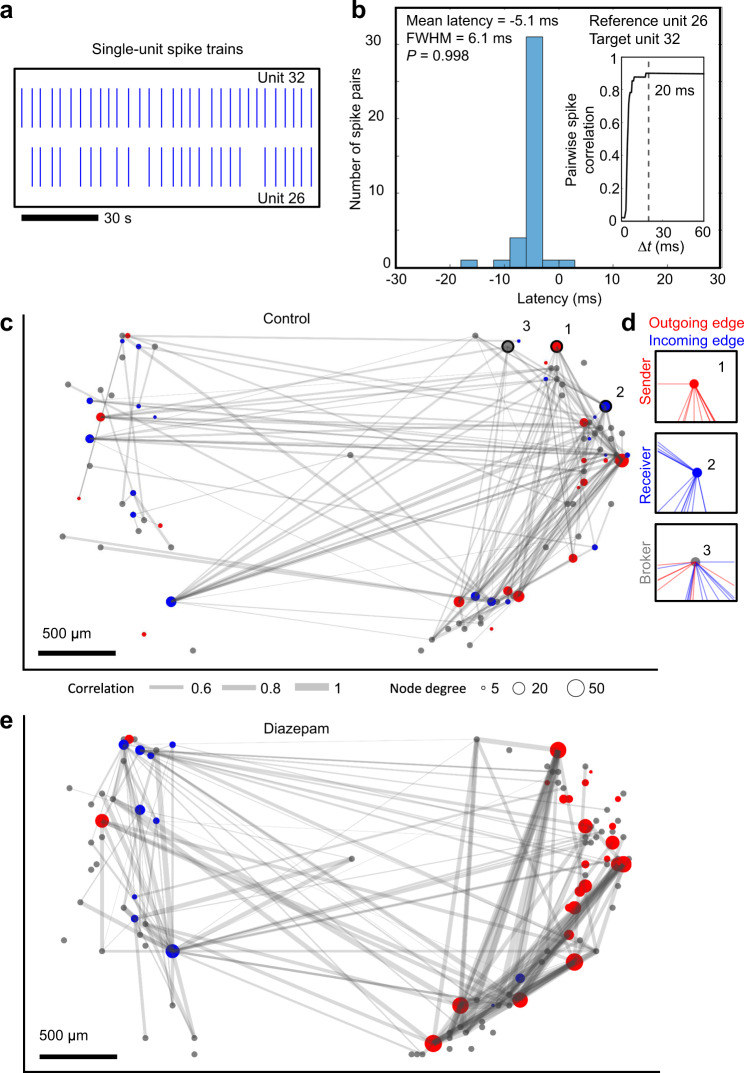
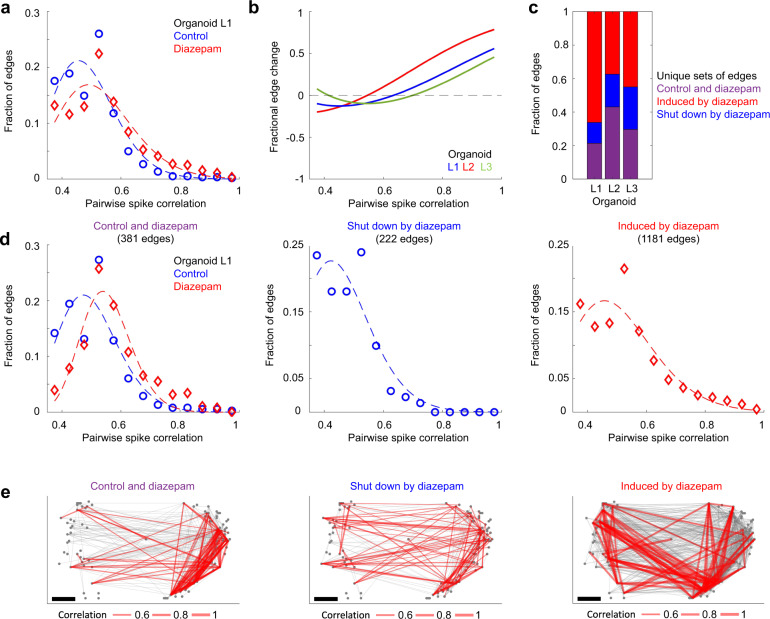
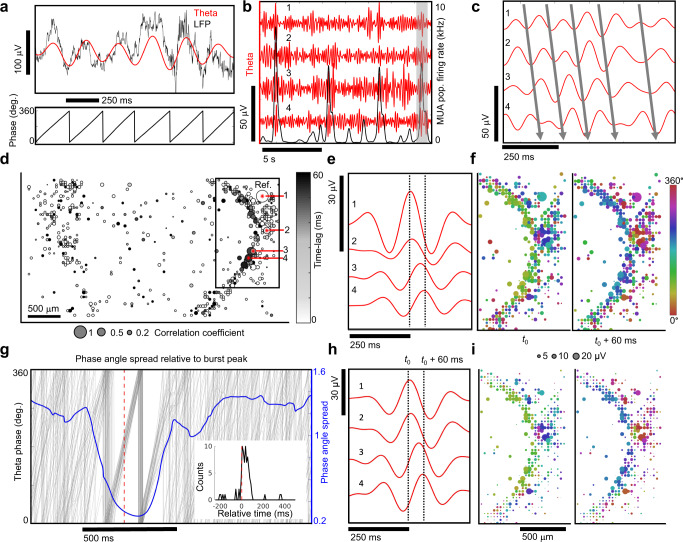
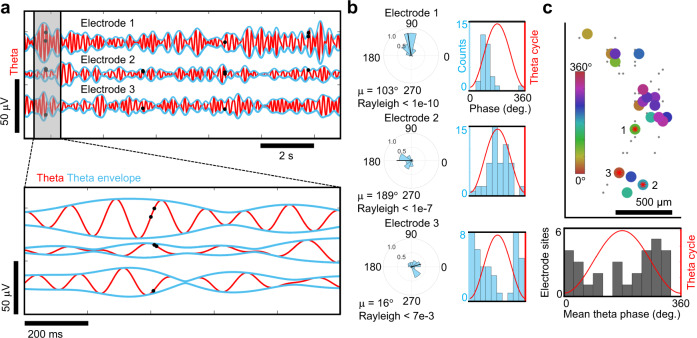
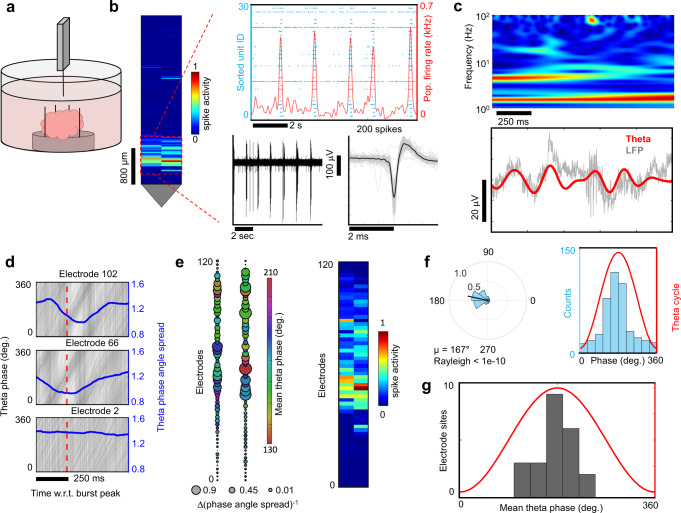
Human brain organoids replicate much of the cellular diversity and developmental anatomy of the human brain. However, the physiology of neuronal circuits within organoids remains under-explored. With high-density CMOS microelectrode arrays and shank electrodes, we captured spontaneous extracellular activity from brain organoids derived from human induced pluripotent stem cells. We inferred functional connectivity from spike timing, revealing a large number of weak connections within a skeleton of significantly fewer strong connections. A benzodiazepine increased the uniformity of firing patterns and decreased the relative fraction of weakly connected edges. Our analysis of the local field potential demonstrate that brain organoids contain neuronal assemblies of sufficient size and functional connectivity to co-activate and generate field potentials from their collective transmembrane currents that phase-lock to spiking activity. These results point to the potential of brain organoids for the study of neuropsychiatric diseases, drug action, and the effects of external stimuli upon neuronal networks.


Conflict of interest statement

K.S.K. is on the SAB of Herophilus. All other authors declare no competing interests.

Figures

Fig. 1
Fig. 1. High-resolution maps of extracellular action potentials across a human brain organoid slice.
a Spatial map of extracellular action potential activity recorded from a 500 µm thick human brain organoid slice positioned on a high-density CMOS microelectrode array with 26,400 recording electrodes to survey electrical activity across the entire organoid. The color scale indicates the normalized number of detected spikes (above 5x-rms noise) registered at each electrode site measured over a 30 s interval. Scale bar 500 µm. b Spatial map of the mean extracellular action potential spike amplitude (bubble size) from single-unit activity measured simultaneously across the CMOS array from the top 1020 electrode sites based on activity. A total of 131 spike-sorted units were determined by Kilosort2. Single-unit electrode clusters are plotted using the same color (the same colors are repeated for different units). c Extracellular spike waveform traces from four individual units (from the region highlighted by the black square in b) are plotted with respect to the electrode positions on the array. The sorted unit colors are the same as b. Waveform scale bars are 50 µV and 3 ms; spatial scale bar is 100 µm. d Left, raster plot of endogenous spiking activity (blue dots) measured from the 131 spike-sorted units. Red line is the average number of spikes detected across the organoid (averaged over a 100 ms Gaussian kernel). Right, same organoid after 50 µM diazepam treatment. Source data are provided as a Source Data File.
Fig. 2
Fig. 2. Human brain organoids form a scaffolding capable of supporting neuronal microcircuitry.
a Top, high-resolution, whole-section of an 8-month organoid immunostained with anti-GFAP (green), and counterstained with Hoechst (cell nuclei, blue), scale bar 1 mm. Middle, a high magnification of (top box) showing stellate appearance characteristic of astrocytes. Bottom left, Anti-GFAP-positive astrocytes (green) in an 8-month organoid co-labeled with anti-connexin 43 demonstrating gap junctions (red). Bottom right, connexin 43 gap junction (red; arrows). Middle and bottom scale bars are 40 µm. b Top, long neuronal processes labeled with anti-SMI312 (green) in an 8-month organoid, scale bar 500 µm. Bottom, anti-SMI312 (green) axons neighboring MAP2-positive (red) neurons near the margin of 8-month organoid, scale bar 20 µm. c Top, anti-GAD65 positive neurons (green) co-labeled with anti-MAP2. Bottom, Anti-Parvalbumin-positive neurons (green) in an 8-month organoid co-labeled with anti-MAP2 (red). Scale bars 40 µm. d The presynaptic marker synaptobrevin label MAP2-positive processes as puncta, scale bar 20 µm. Data from ad were repeated independently on n = 3 organoids. e Single-cell RNA sequencing (drop-seq) shows the presence of glutamatergic neurons, GABAergic neurons and astrocyte populations. Single-cell transcriptomes (5680 cells collected from three 7-month-old organoids) are visualized as a Uniform Manifold Approximation and Projection (UMAP). Source data are provided as a Source Data File.
Fig. 3
Fig. 3. Neuron interspike interval distributions from a human brain organoid slice.
a Histogram plots of interspike intervals (ISIs) from endogenous single-unit spiking activity are shown from organoid L1. The left plot shows an exponentially distributed ISI fit well by an exponential function (red line, R2 = 0.96) with a coefficient of variation (CV), defined as the ratio of ISI standard deviation (σ) to its mean (µ), close to one. The inset shows the vertical axis on a log scale. The right plot highlights a single-unit ISI with a right-skewed distribution, not as accurately captured by an exponential (R2 = 0.77), with a comparatively smaller CV. b σ is plotted as a function of µ across all units with a minimum of 30 spikes measured over a 3-min duration for organoid L1. The dotted line indicates CV = σ/µ = 1. c Single-unit ISIs shift toward lower values with smaller CV for diazepam (50 µM) treatment relative to control. The distribution of all ISI intervals across all units is shown in Supplementary Fig. 8 for multiple organoids (n = 4). d The ISI CV distributions do not vary significantly between organoids in control conditions (p > 0.4). However, there is a significant reduction in the CV when treated with diazepam (50 µM) as determined by a two-sample Kolmogorov–Smirnov (KS) test (p < 1e−4, p = 4.5e−2, p < 1e−4, p = 1.4e−2 for organoids L1, L2, L3 and L4 respectively).
Fig. 4
Fig. 4. Diazepam-induced changes in population-level dynamics in a human brain organoid slice.
a The population averaged firing rate (pop. rate) for the control and diazepam recordings (organoid L1 here) calculated from single-unit activity averaged over a 5 ms window. The population rate for each burst is plotted individually, centered by the peak in multi-unit activity (MUA). The standard error of the mean (SEM) calculated over all bursts is plotted in red. b Population rate average differences are shown across all individual burst pairs for the control and diazepam (50 μM) recordings from the same organoid. The average population rate difference is computed over a time window of −100 ms to +350 ms relative to the MUA peak (blue dotted line in a). The color bar scale is the same for control and diazepam. See Supplementary Fig. 10 for visualization from a separate organoid. c Average population vector differences taken over all individual burst pairs per recording for control and diazepam (50 µM) conditions. The population vector difference is computed over a time window of −100 ms to +350 ms relative to the MUA peak (blue dotted line in a). Significance between control and diazepam was determined by a two-sample KS test (p < 1e−4 for organoid L1, L2, L3 and L4). The number of pairwise burst comparison for each distribution for control and diazepam (50 µM) conditions, respectively, are (1035, 2701); (5460, 10,153); (3570, 7875); (1275, 861) for organoids L1, L2, L3 and L4 respectively. d Fractional change between population rate for control and diazepam (ρC − ρD)/(ρC + ρD), averaged over a range of different time windows for L1. Here, ρC and ρC are the average population rate differences for control and diazepam, respectively. Blue tiles indicate a higher average population vector difference for control. The black dot (p = (−100, 350 ms)) indicates the time window used in b and c. e Average score of the matrix in d for each organoid.
Fig. 5
Fig. 5. Mapping information flow through a human brain organoid slice.
a Extracellular action potential spike events are shown from two correlated spike-sorted units. b The spike time latency distribution is shown between the two spike-sorted units shown in a. The latency distribution between pairwise spike events is unimodal (Hartigans’ dip test for multimodality, p = 0.998), with a mean latency of 5.1 ms and a FWHM of 6.1 ms. The inset shows the pairwise spike correlation was calculated using the spike time tile coefficient (STTC) as a function of correlation time window (Δt) for the two correlated spike-sorted units shown in a. Choosing a correlation time window Δt = 20 ms captures all pairwise spike interactions between the two units. c Functional connectivity map showing the pairwise correlation strength (edge thickness in gray) between spike trains. Sorted by directionality, the in-degree and out-degree were computed per unit, defined as predominately incoming or outgoing edges respectively and designated “receiver” (blue) nodes, “sender” (red) nodes. All other nodes were labeled “brokers” (gray with a fixed size not indicative of node degree). For visual clarity, only the top 90 outgoing and the top 90 incoming edges are shown for “sender” and “receiver” nodes, respectively. d Examples of single “sender” (1), “receiver” (2) and “broker” (3) nodes showing all incoming (blue) and outgoing (red) edges for the spatial sites identified on c. The relative fraction of sender, receiver and broker edges remained similar across multiple organoids (n = 4, Supplementary Fig. 12a, b). e Functional connectivity map of the same organoid after treatment with 50 µM diazepam.
Fig. 6
Fig. 6. Diazepam selectively modulates the skeleton network of strong edges.
a Pairwise spike correlation (edge) distributions are shown from the spatial maps of Fig. 5c, e. The edge strengths (of the largest component of interconnected nodes) were binned using a bin size = 0.05 over a connectivity range from 0.35 to 1. A gamma distribution fit illustrates “a skeleton of stronger connections immersed in a sea of weaker ones”. Diazepam (50 µM) increased the minority population of stronger edge strengths, while decreasing the strength of the more abundant weaker edges with respect to control conditions. b The fractional difference in edge strengths, (fd − fc)/(fd + fc), is shown, where fc and fd are the gamma distribution fits highlighted in a for control and diazepam (50 µM) conditions, respectively. A higher proportion of strong edges are present in diazepam (50 µM) conditions relative to control conditions for n = 3 organoids. c The relative fractions of unique sets of edges are shown. Purple bars represent edges present during both control and diazepam conditions. Blue bars represent the fraction of edges shut down by diazepam and the red bars represent the fraction of edges induced by diazepam. d Edge strength distributions highlighted in c are plotted for organoid L1, while the spatial graph is shown in e. The top 90 edges (by weight) are shown in red, while the remaining edges are plotted in gray.
Fig. 7
Fig. 7. Spatial and temporal coherence of theta oscillations with neuronal population bursts.
a The raw local field potential (<500 Hz, black line) and the 4–8 Hz theta filtered band (red) (top). The phase of the theta oscillation (bottom). b Theta band oscillations (red) from four different recording sites and the multi-unit activity (MUA) population averaged firing rate (black) averaged over a 100 ms window. c Zoomed in view of highlighted black rectangle in b. The solid lines indicate the relative phase offsets of theta oscillations across spatial sites of the organoid. Within a narrow time window these oscillations showed consistent phase offsets. d Spatial correlation map of theta oscillations. The correlation coefficient (bubble size) is shown with respect to the seed reference site (1) and the relative phase-lag with respect to the reference electrode shown in grayscale reveals spatial alignment of theta oscillations. e Signal averaged theta oscillations using peaks from electrode (1) as a reference. The numbers 1–4 in ce, h all refer to the same set of electrodes. f Spatial map of signal averaged theta oscillation phase and amplitude relative to reference electrode number 1. Two time points are shown, one at the center of the reference electrode t0 and another 60 ms later. g Phase angle spread in radians (blue line) is plotted relative to the burst peak. Individual theta phase traces (gray line) are plotted for electrode 1 relative to population burst events determined from MUA averaged over a 5 ms window. The phase angle spread is minimized after the burst peak (red dotted line). The time of the theta peak amplitude relative to bursts where the angular spread is minimized across multiple electrode sites (inset). h The same theta oscillations from e are signal averaged with respect to population burst peak times (t0). i Spatial map of signal averaged theta oscillations using population burst peak times reveal a temporal alignment of theta oscillations with neuronal population bursts. f, i share the same scales.
Fig. 8
Fig. 8. Phase-locking of spikes to theta oscillations.
a Top, theta oscillations (red line) from three representative electrode sites and the single-unit spikes that occurred at each of those electrodes (black dots). Bottom, zoomed in view from the gray box on the top. b Left, circular distribution of theta phase angles occurring during single-unit spike events measured from the electrodes in a. Direction of the mean spike angle (µ) relative to the theta phase and magnitude (mean resultant length) are shown in the polar plots. The Rayleigh test for non-uniformity was used to determine if spikes were distributed non-uniformly over the theta cycle (0°, 360°). Right, distributions of theta-spike angles shown relative to the theta cycle are visualized as histogram plots. c Top, a cluster of phase-locked units to theta oscillations are shown within the coherent pocket highlighted by the box in Fig. 7d. The color indicates the mean phase-locked angle to theta (µ) that satisfy the Rayleigh test for non-uniformity (p < 0.05). A subset of the total electrode sites with no preferred theta phase (n = 102, p > 0.05) are shown by gray dots. Bottom, histogram of the mean phased-locked angle to theta for all electrode sites across the array that satisfy the Rayleigh criteria (n = 29, p < 0.05) which account for 22% of the 131 total active units detected. We observe an average of 28% ± 14% of single units exhibiting phase-locking to theta oscillations based on the Rayleigh criteria defined above (n = 4 organoids at 8 months).
Fig. 9
Fig. 9. Neuropixels CMOS shanks resolves spiking and LFP in the z-plane of a whole brain organoid.
a A Neuropixels high-density CMOS shank was attached to a custom-made mount and controlled by a micromanipulator in order to lower the shank into an immobilized brain organoid kept at 37 °C in BrainPhys media. b Left, spikes (above a 5-rms threshold) were detected in a subset of electrodes near the tip of the shank. Spike activity is normalized relative to the electrode with the most detected spikes. Top right, raster-plot visualization of single-unit spiking activity (Kilosort2) as shown by the blue dots for each sorted unit. Stereotyped population bursts are visualized as peaks in the population averaged firing rate (red line). Bottom right shows the extracellular field potentials (0.3–4 kHz) generated by a spiking neuron within the organoid as measured by the shank. c Top, spectrogram plot of local field potential (LFP) from an electrode illustrates dominant oscillation power in the theta and delta bands. Bottom, raw LFP (gray line) from the same electrode overlaid with the theta-filtered band (red line). d Theta phase traces (gray lines) are shown relative to population burst peak events (red dotted line) reveal phase coherence as illustrated by a drop in the phase angle spread plotted in radians (blue line). The bottom plot shows an electrode site displaying no phase coherence relative to population burst events. e Left, spatial map of the change in theta phase angle spread is shown relative to burst peak time across the shank. The bubble size indicates the inverse of the phase angle spread relative to the burst peak for each electrode. Notice the overlap with phase coherent sites and the spatial region registering spiking activity on the right. f Left, circular distribution of theta-spike phase angles measured from a single electrode site. The direction of the mean spike angle (µ) relative to the theta phase and magnitude (mean resultant length) are shown as polar plots. The Rayleigh criteria for non-uniformity was used to determine if spikes were distributed non-uniformly over the theta cycle (0°, 360°). Right, distributions of theta-spike angles shown relative to the theta cycle. g Mean theta phase angle of spike phase-locked electrodes across the Neuropixels probe satisfying the Rayleigh test for non-uniformity (p < 0.05).

Similar articles

Cited by

References

    1. Del Dosso A, Urenda JP, Nguyen T, Quadrato G. Upgrading the physiological relevance of human brain organoids. Neuron. 2020;107:1014–1028. doi: 10.1016/j.neuron.2020.08.029. - DOI - PMC - PubMed
    1. Mariani J, et al. FOXG1-dependent dysregulation of GABA/glutamate neuron differentiation in autism spectrum disorders. Cell. 2015;162:375–390. doi: 10.1016/j.cell.2015.06.034. - DOI - PMC - PubMed
    1. Muguruma K, Nishiyama A, Kawakami H, Hashimoto K, Sasai Y. Self-organization of polarized cerebellar tissue in 3D culture of human pluripotent stem cells. Cell Rep. 2015;10:537–550. doi: 10.1016/j.celrep.2014.12.051. - DOI - PubMed
    1. Pasca AM, et al. Functional cortical neurons and astrocytes from human pluripotent stem cells in 3D culture. Nat. Methods. 2015;12:671–678. doi: 10.1038/nmeth.3415. - DOI - PMC - PubMed
    1. Quadrato G, et al. Cell diversity and network dynamics in photosensitive human brain organoids. Nature. 2017;545:48–53. doi: 10.1038/nature22047. - DOI - PMC - PubMed

Publication types