. 2022 Jul 29;7(1):45.
doi: 10.1038/s41525-022-00316-x.

Assessing clinical utility of preconception expanded carrier screening regarding residual risk for neurodevelopmental disorders

Affiliations

Assessing clinical utility of preconception expanded carrier screening regarding residual risk for neurodevelopmental disorders

Paranchai Boonsawat et al. NPJ Genom Med. .

Abstract

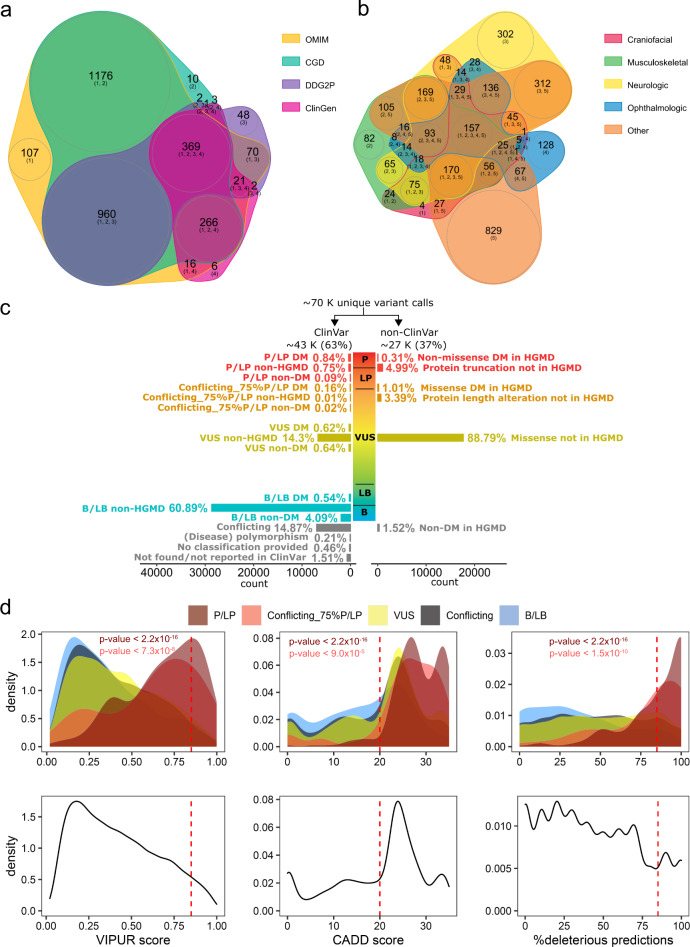
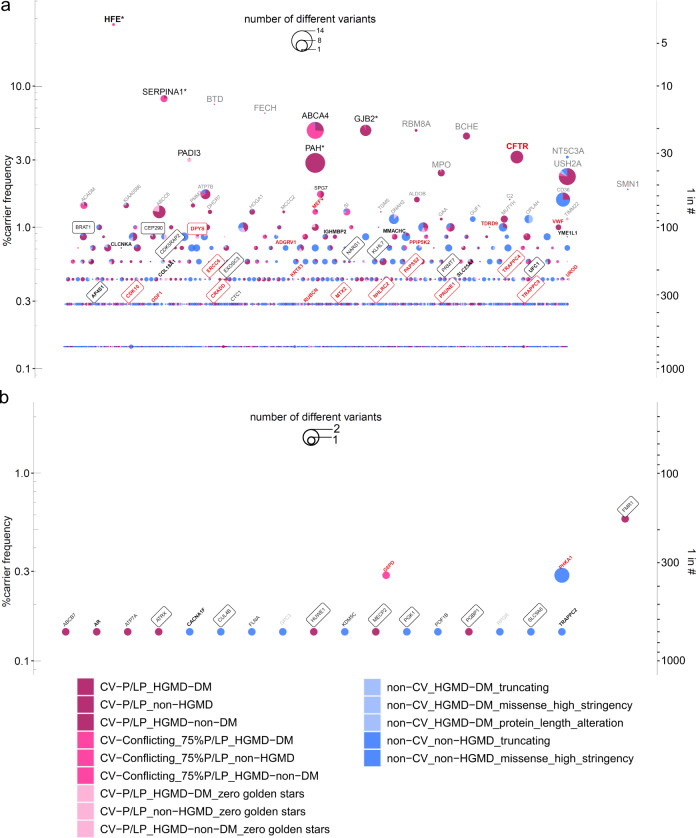
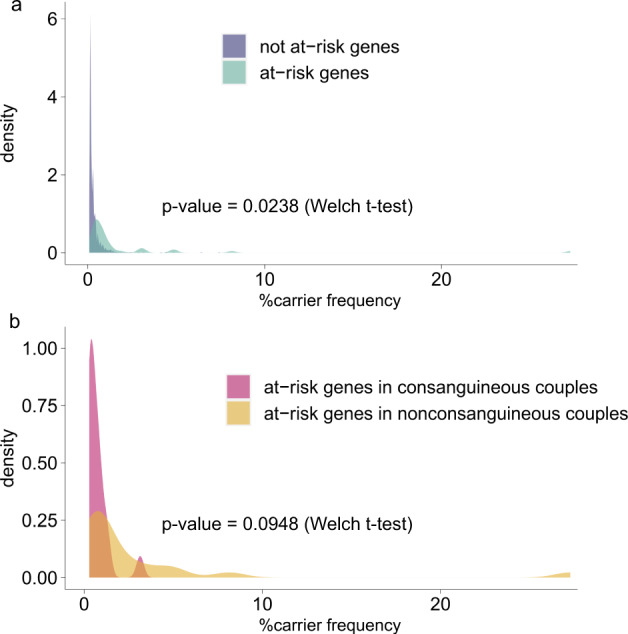
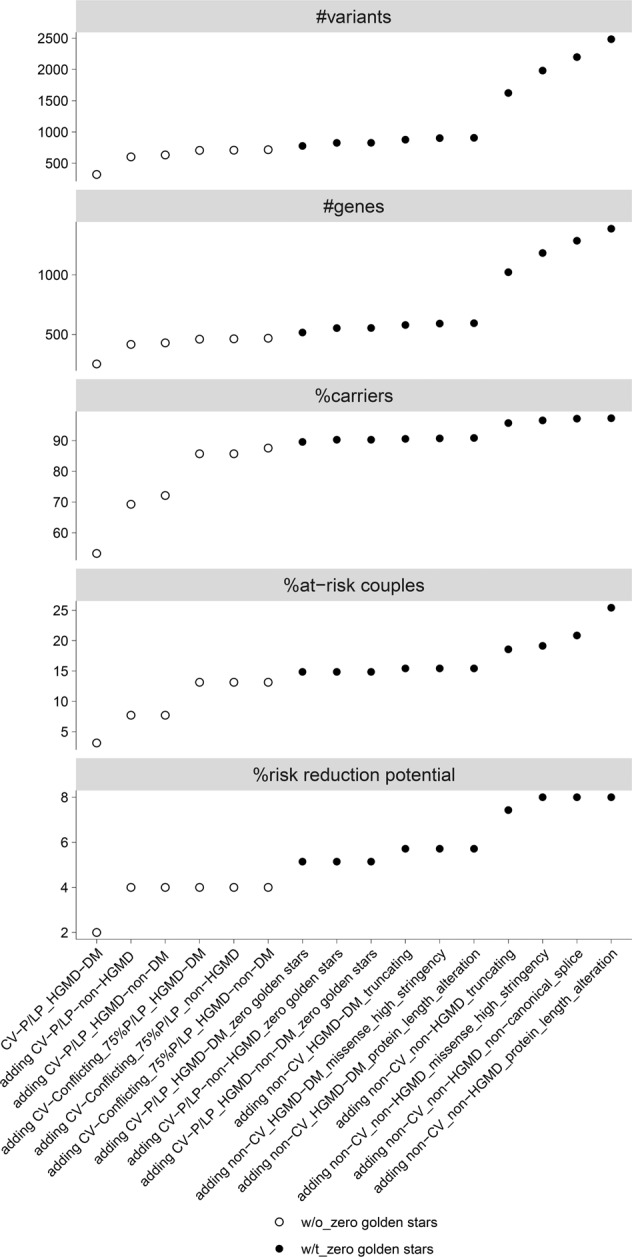
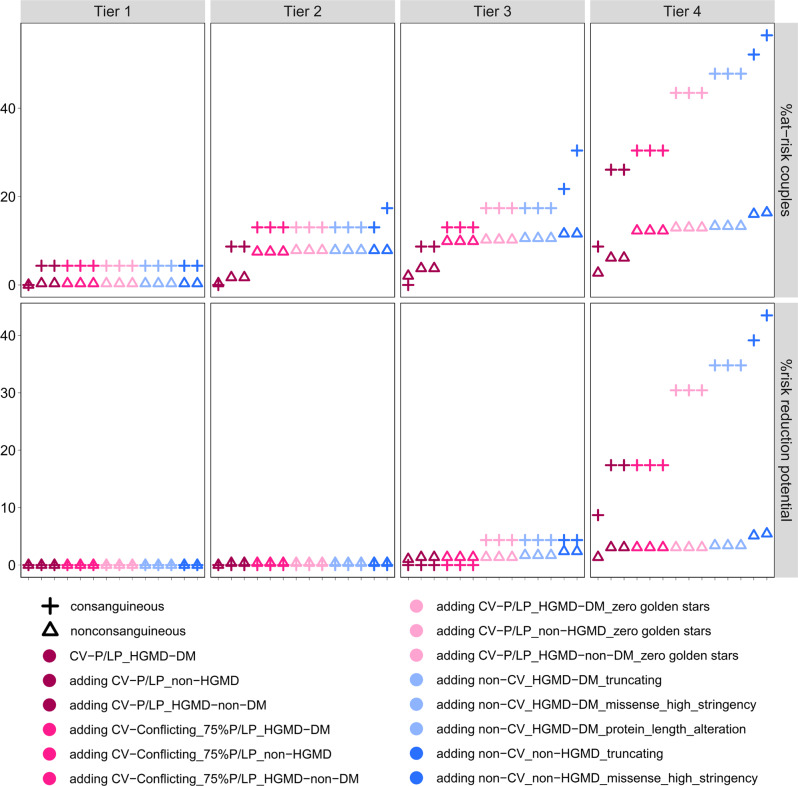
The magnitude of clinical utility of preconception expanded carrier screening (ECS) concerning its potential to reduce the risk of affected offspring is unknown. Since neurodevelopmental disorders (NDDs) in their offspring is a major concern of parents-to-be, we addressed the question of residual risk by assessing the risk-reduction potential for NDDs in a retrospective study investigating ECS with different criteria for gene selection and definition of pathogenicity. We used exome sequencing data from 700 parents of children with NDDs and blindly screened for carrier-alleles in up to 3046 recessive/X-linked genes. Depending on variant pathogenicity thresholds and gene content, NDD-risk-reduction potential was up to 43.5% in consanguineous, and 5.1% in nonconsanguineous couples. The risk-reduction-potential was compromised by underestimation of pathogenicity of missense variants (false-negative-rate 4.6%), inherited copy-number variants and compound heterozygosity of one inherited and one de novo variant (0.9% each). Adherence to the ACMG recommendations of restricting ECS to high-frequency genes in nonconsanguineous couples would more than halve the detectable inherited NDD-risk. Thus, for optimized clinical utility of ECS, screening in recessive/X-linked genes regardless of their frequency (ACMG Tier-4) and sensible pathogenicity thresholds should be considered for all couples seeking ECS.


Conflict of interest statement

The authors declare no competing interests.

Figures

Fig. 1
Fig. 1. Genes and variant distributions.
a Venn plot shows numbers of 3,058 AR/XL genes common or distinct in four databases, including the Online Mendelian Inheritance in Man (OMIM), the Clinical Genomic Database (CGD), the Development Disorder Genotype - Phenotype Database (DDG2P), and the Clinical Genome Resource (ClinGen). b Venn plot shows numbers of 3058 AR/XL genes in different manifestation categories according to the CGD manifestation category definition. c Bar plot shows distributions of the percentages of the filtered variants with (ClinVar) and without ClinVar annotation (non-ClinVar) according to their approximate levels of pathogenicity scale. P/LP: pathogenic/likely pathogenic; VUS: variant of uncertain significance; B/LB: benign/likely benign. d Density plots depict distributions of the filtered ClinVar pathogenic/likely pathogenic (P/LP, dark red), ClinVar conflicting with 75%P/LP entries (Conflicting_75%P/LP, red), ClinVar variants of uncertain significance (VUS, yellow), and ClinVar benign/likely benign (B/LB, light blue) missense variants according to VIPUR score (left), CADD score (middle), and the percentage of deleterious predictions of eight conventional in silico prediction tools, including SIFT, PolyPhen2, LRT, MutationTaster, MutationAccessor, FATHMM, PROVEAN, and M.CAP (right). P-values by Welch t-test show the significant difference of the distribution between P/LP and VUS/Conflicting/B/LB (dark red letters) and between Conflicting_75%P/LP and VUS/Conflicting/B/LB (red letters). Red dashed lines indicate cut-offs (VIPUR ≥ 0.85, CADD score ≥ 20, %deleterious predictions ≥ 85%) for “high stringency” missense variants (upper panel). Likewise, density plots depict distributions of the filtered non-ClinVar missense variants (lower panel).
Fig. 2
Fig. 2. Carrier frequencies of recessive and X-linked genes observed in the 700 parental samples with indication of at-risk and transmitted at-risk genes and respective variant classification group distributions.
Carrier frequencies of recessive (a) and X-linked genes (b). Carrier frequency was calculated as the percentage of the number of individuals carrying variants of different pathogenicity groups in each gene; on the right y-axis, a descriptive proportion was given. From top to bottom, the genes were sorted according to their carrier frequencies, as well as alphabetically wherever equal. Black letters indicate genes with at least one at-risk parental couple, red for genes with at least one at-risk consanguineous parental couple, bold for genes with at least one at-risk homozygous variant, and boxed for genes with at least one couple having transmitted both at-risk genotypes. Grey letters depict genes with > 1% carrier frequencies that were not found in an at-risk constellation. Stars indicate genes with more than one variant identified in at least one individual. Pie size correlates with the number of different variants in individual genes. The carrier frequencies were calculated among the 700 healthy individuals (350 parental couples) for 3046 recessive genes. The detected variants were shown for 14 variant classification groups according to their levels of pathogenicity, which include ClinVar pathogenic/likely pathogenic (P/LP) (CV-P/LP, in dark pink), ClinVar conflicting with 75% P/LP entries (CV-conflicting_75%P/LP, in pink), both stratified according to disease-causing mutation (DM) classification in the Human Gene Mutation Database (DM, non-HGMD, or HGMD-non-DM). The next groups include ClinVar variants with zero golden stars (in light pink), non-ClinVar with disease-causing mutation classification in the Human Gene Mutation Database (non-CV_HGMD-DM, in light blue) sub-categorized into variant functional classes including truncating, high stringency missense, or protein-length alteration, Non-CV_non-HGMD (blue) variants were sub-categorized according to variant functional classes including truncating, or high stringency missense.
Fig. 3
Fig. 3. Effects of at-risk and consanguinity status on gene carrier frequencies.
Considering variant classification groups 1–14, a Density plots show a significant difference between the mean of carrier frequency of genes that were at-risk and that of genes that were not at-risk according to their gene carrier frequencies. b Among the genes found in at-risk constellation, the mean of carrier frequency showed a trend towards lower frequencies in the consanguineous as compared to the nonconsanguineous group.
Fig. 4
Fig. 4. Summary of carrier testing.
Results of carrier testing were summarized for number of detected variants, number of affected genes, and frequency of heterozygous carriers, at-risk couples, and risk-reduction potential according to the various pathogenicity thresholds, where a less conservative variant classification group is added stepwise as described for groups 1–14 in the legend of Fig. 2. It also includes the classification groups 15 (non-ClinVar_non-HGMD_non-canonical_splice) and 16 (non-ClinVar_non-HGMD_protein_length_alteration) which were not considered for further assessment. Overall, the carrier, and at-risk-couple frequencies showed the steepest increase upon inclusion of CV-P/LP_non-HGMD variants and the HGMD-DM, ClinVar conflicting variants with a high proportion of P/LP entries, as well as upon inclusion of previously unreported truncating variants. The risk-reduction potential showed a sharp increase upon inclusion of CV-P/LP_non-HGMD, CV-P/LP_HGMD-DM with zero golden stars, and non-CV_non-HGMD truncating variants.
Fig. 5
Fig. 5. Magnitude of clinical utility of ACMG-based 4-Tier carrier screening.
Frequency of at-risk couples and risk-reduction potential for NDDs according to a stepwise addition of the variant classification groups (1–14) are shown for nonconsanguineous and consanguineous couples for carrier screening for each of the 4-tiers recommended by the American College of Medical Genetics and Genomics (ACMG). In this carrier screening, Tier-1 includes screening of CFTR, SMN1 and medically and family-based risk genes, Tier-2 includes Tier-1 plus genes with carrier frequency ≥ 1/100, Tier-3 includes Tier-2 plus genes with carrier frequency ≥ 1/200 as well as X-linked conditions, and Tier-4 includes Tier-3 plus genes with carrier frequency < 1/200.

Similar articles

Cited by

References

    1. Kaback, M. M. Population-based genetic screening for reproductive counseling: The Tay-Sachs disease model. in European Journal of Pediatrics, Supplement159, (Springer Verlag, 2000). - PubMed
    1. Scotet V, L’Hostis C, Férec C. The changing epidemiology of cystic fibrosis: Incidence, survival and impact of the CFTR gene discovery. Genes (Basel) 2020;11:589. doi: 10.3390/genes11060589. - DOI - PMC - PubMed
    1. Cao A, Kan YW. The prevention of thalassemia. Cold Spring Harb. Perspect. Med. 2013;3:a011775. doi: 10.1101/cshperspect.a011775. - DOI - PMC - PubMed
    1. Beauchamp KA, Johansen Taber KA, Muzzey D. Clinical impact and cost-effectiveness of a 176-condition expanded carrier screen. Genet. Med. 2019;21:1948–1957. doi: 10.1038/s41436-019-0455-8. - DOI - PMC - PubMed
    1. Bell CJ, et al. Carrier testing for severe childhood recessive diseases by next-generation sequencing. Sci. Transl. Med. 2011;3:65ra4. doi: 10.1126/scitranslmed.3001756. - DOI - PMC - PubMed