. 2022 Jul 29;13(1):4398.
doi: 10.1038/s41467-022-32171-w.

Mouse fetal growth restriction through parental and fetal immune gene variation and intercellular communications cascade

Affiliations

Mouse fetal growth restriction through parental and fetal immune gene variation and intercellular communications cascade

Gurman Kaur et al. Nat Commun. .

Abstract

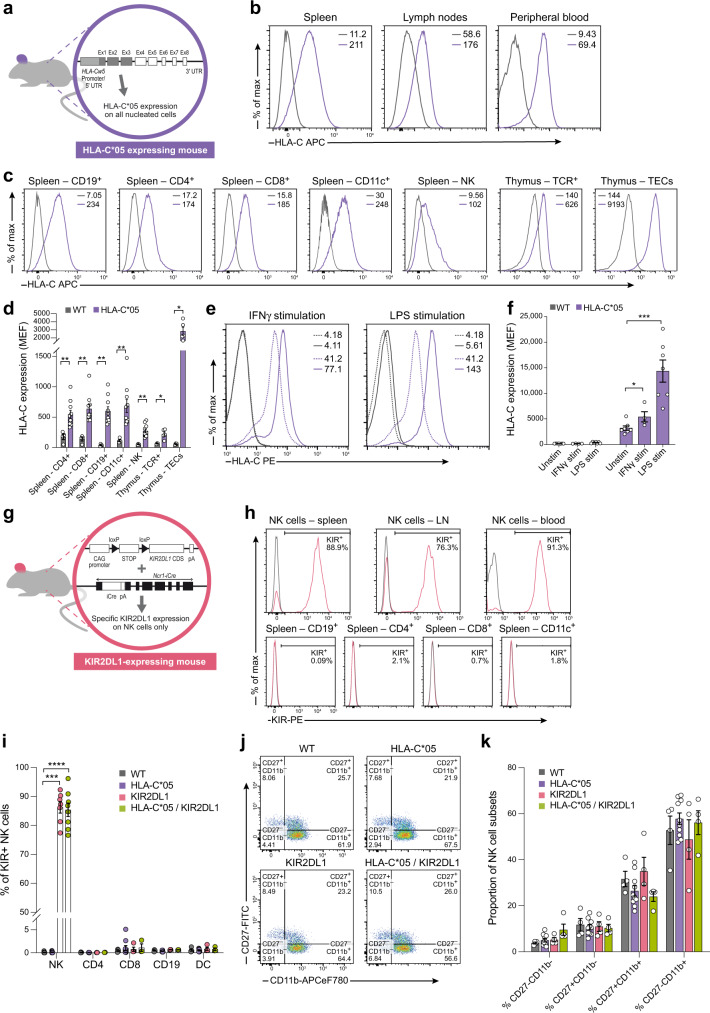
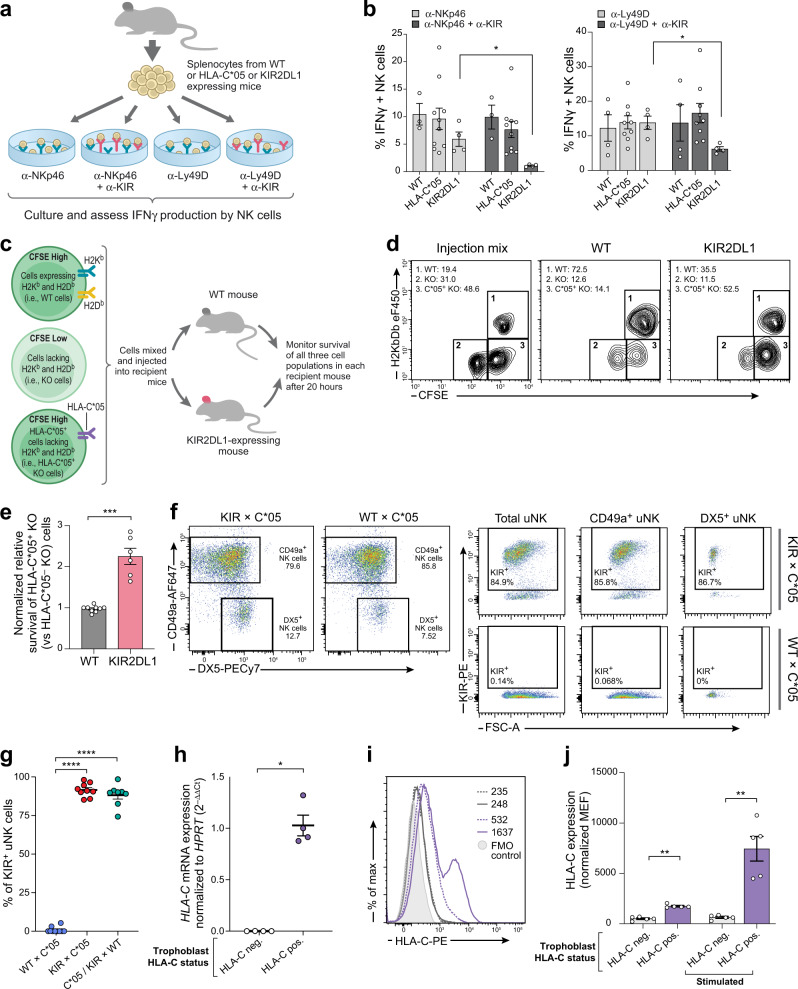
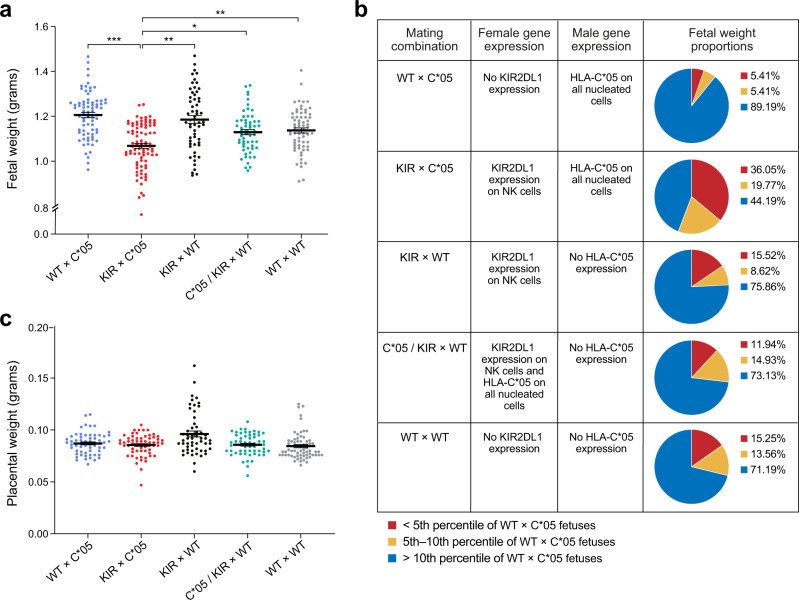
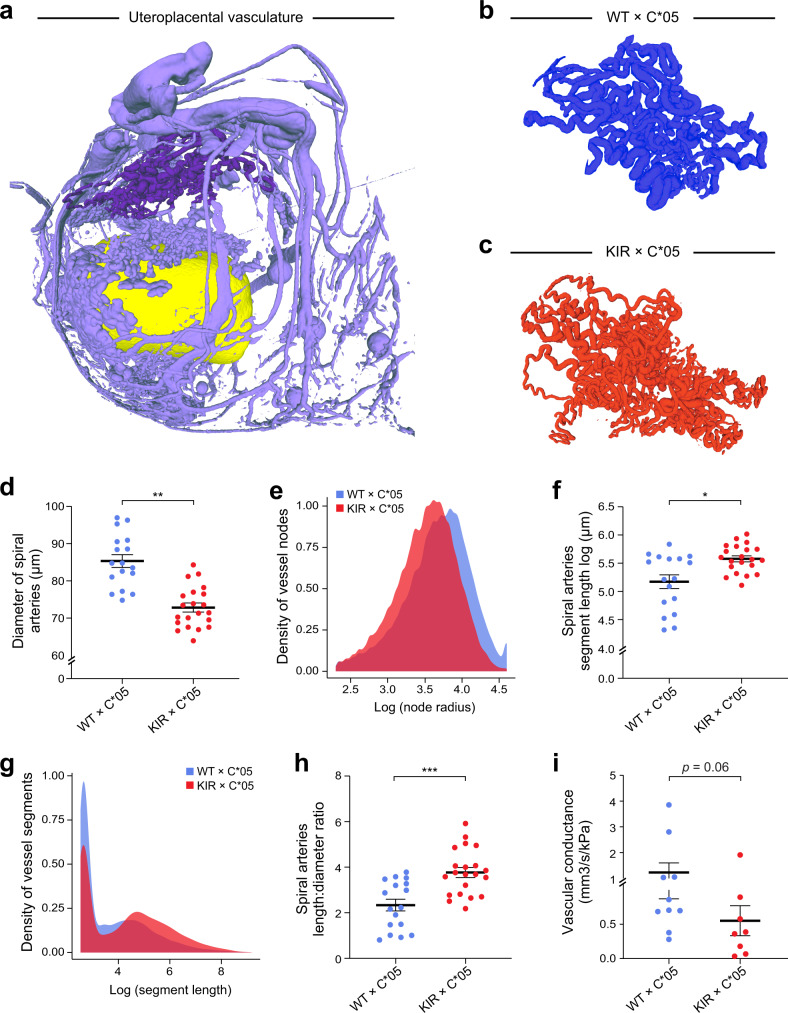
Fetal growth restriction (FGR) affects 5-10% of pregnancies, and can have serious consequences for both mother and child. Prevention and treatment are limited because FGR pathogenesis is poorly understood. Genetic studies implicate KIR and HLA genes in FGR, however, linkage disequilibrium, genetic influence from both parents, and challenges with investigating human pregnancies make the risk alleles and their functional effects difficult to map. Here, we demonstrate that the interaction between the maternal KIR2DL1, expressed on uterine natural killer (NK) cells, and the paternally inherited HLA-C*0501, expressed on fetal trophoblast cells, leads to FGR in a humanized mouse model. We show that the KIR2DL1 and C*0501 interaction leads to pathogenic uterine arterial remodeling and modulation of uterine NK cell function. This initial effect cascades to altered transcriptional expression and intercellular communication at the maternal-fetal interface. These findings provide mechanistic insight into specific FGR risk alleles, and provide avenues of prevention and treatment.


Conflict of interest statement

A.R. is a co-founder and equity holder of Celsius Therapeutics, an equity holder in Immunitas, and was an SAB member of ThermoFisher Scientific, Syros Pharmaceuticals, Neogene Therapeutics and Asimov until July 31, 2020. From August 1, 2020, A.R. is an employee of Genentech and has equity in Roche. O.R.-R. is an employee of Genentech as of October 19, 2020 and has equity in Roche. O.A., O.R.-R. and A.R. are co-inventors on patent applications filed by the Broad Institute for inventions related to single-cell genomics, such as in PCT/US2018/060860 and US provisional application no. 62/745,259. G.M. is a director of and shareholder in Genomics plc and a partner in Peptide Groove LLP. The remaining authors declare no competing interests.

Figures

Fig. 1
Fig. 1. HLA-C*05 and KIR2DL1 transgenic mouse model.
a Schematic of construct used to make HLA-C*05 transgenic mice. Gray shaded region: HLA-C allele, white shaded region: murine H-2Kb allele. b, c Representative cell surface expression of HLA-C*05 on total cells from organs (b) and on gated cell subsets from spleen (c). NK cells are NKp46+CD3-TCR cells, thymus TCR + cells are CD3+TCR+ and TECs are Epcam+CD45 cells. Numbers denote mean florescence intensity (MFI). d HLA-C cell surface expression plotted as molecules of equivalent fluorochrome (MEF). e Representative cell surface HLA-C*05 expression on spleen CD19+ cells cultured with (solid lines) or without stimulation (dashed lines). Numbers denote MFI. f HLA-C cell surface expression plotted as MEF from CD19+ splenocytes. g Schematic of KIR2DL1 and Ncr1-iCre gene expression construct used to make NK cell-specific KIR2DL1-expressing mice. h Representative cell surface expression of KIR2DL1 on NKp46+CD3-TCR NK cells in different organs or on different cell subsets from spleen. Numbers denote percentage of KIR+ cells. i Percentage of KIR+ cells in immune cell subsets from the spleen. j, k Cell surface staining of CD27 and CD11b on gated splenic NK cells. Purple: HLA-C*05 mice, gray: WT mice, pink: KIR2DL1-expressing mice, green: HLA-C*05/KIR2DL1 double transgenic mice. Mean ± SEM is shown. n represents biologically independent animals in each group. d n = 4 (WT), 10 (HLA-C*05), for Spleen—CD4+, CD8+, CD19+, CD11c+, and NK cells. n = 3 (WT), 5 (HLA-C*05), for Thymus-TCR+. n = 4 (WT), 5 (HLA-C*05), for Thymus-TECs. f n = 7 (Unstim), 4 (IFNγ stim) and 7 (LPS stim). i n = 9 (WT), 10 (HLA-C*05), 7 (KIR2DL1), 8 (HLA-C*05, KIR2DL1) for NK; n = 4 (WT), 10 (HLA-C*05), 4 (KIR2DL1), 3 (HLA-C*05,KIR2DL1) for CD4, CD8, CD19, and DC. k n = 4 (WT), 10 (HLA-C*05), 4 (KIR2DL1), and 4 (HLA-C*05,KIR2DL1) for all conditions. *p < 0.05, **p < 0.01, ***p < 0.001, ****p < 0.0001, Two-tailed Mann–Whitney U-test. Exact p-values are: d HLA-C*05 vs. WT—p = 0.0357 (Thymus TCR + ), p = 0.0159 (Thymus TECs), p = 0.002 (all others). f p = 0.0424 (IFNγ stim vs. Unstim), p = 0.0006 (LPS stim vs. Unstim). i p = 0.0002 (KIR2DL1 vs. WT), p < 0.0001 (HLA-C*05/KIR2DL1 vs. WT). Source Data are provided as a Source Data file.
Fig. 2
Fig. 2. KIR2DL1 transgene recognizes HLA-C*05, modifies NK cell function.
a Experimental design of NK cell stimulation experiments. b Staining for IFNγ+ NK cells (CD3-TCR Nkp46+ or CD3-TCR-DX5+) upon culture with antibodies depicted in panel a. c Experimental design of adoptive transfer experiments. d Representative staining of cellular injection mix and CFSE+ splenocytes harvested from recipient mice. Numbers denote percentage of each gated cell population. e Relative survival of HLA-C*05+ KO cells compared to survival of HLA-C*05-KO cells (normalized to WT mice). f Representative flow cytometric staining of DX5 and CD49a on uNK cells (CD3-CD19-TCR-CD45+NKp46+CD122+ cells) isolated from the gd9.5 implantation sites from the mentioned mating crosses. KIR staining is shown on total uNK cells, CD49a+, or DX5+ uNK subsets. g Percentage of KIR+ uNK cells in different mating crosses at gd9.5. Crosses are written as female × male. h HLA-C*05 mRNA expression on fetal trophoblast cells from gd9.5 or gd10.5 implantation sites. i Representative HLA-C*05 cell surface expression on fetal trophoblast cells isolated from placenta at gd12.5, and cultured with (solid lines) or without stimulation (dashed lines). Purple: HLA-C*05+ trophoblast cells, gray: HLA-C*05 trophoblast, i.e., WT cells, filled histogram: fluorescence minus one (FMO) control. Numbers denote MFI. j HLA-C cell surface expression plotted as MEF normalized to FMO controls. Mean ± SEM is shown. n represents biologically independent animals/samples in each group. b n = 3 (WT), 10 (HLA-C*05), 4 (KIR2DL1) for α-NKp46 ± α-KIR stim, n = 4 (WT), 9 (HLA-C*05), 4 (KIR2DL1) for α-Ly49D ± α-KIR stim. e n = 9 (WT), 6 (KIR2DL1). g n = 10 (WT × C*05), 9 (KIR × C*05) and 8 (C*05/KIR × WT). h n = 4 per group. j n = 5 per group. *p < 0.05, **p < 0.01, ***p < 0.001, ****p < 0.0001, Two-tailed Mann–Whitney U-test. Exact p-values are: b p = 0.0286 (both comparisons), e p = 0.0002, g p < 0.0001, h p = 0.0286, j p = 0.0079 (both comparisons). Source Data are provided as a Source Data file.
Fig. 3
Fig. 3. Expression of maternal KIR2DL1 and paternal HLA-C*05 leads to FGR.
a Fetal weight and c placental weight determined at gd18.5 of progeny from different mating combinations involving WT, KIR2DL1-expressing and HLA-C*05 transgenic mice. Crosses are written as female × male. b Table showing distribution of fetal weight proportions from each mating combination compared to the WT × C*05 control mating. Numbers depict percentages of fetuses whose weight was below the 5th percentile, between 5th and 10th percentile and above the 10th percentile of the WT × C*05 mating controls. Mean ± SEM is shown. n represents biologically independent litters from each group. a n = 12 litters (WT × C*05), 11 litters (KIR × C*05), 10 litters (C*05/KIR × WT), 10 litters (WT × WT) and 8 litters (KIR × WT). c n = 10 litters (WT × C*05), 8 litters (KIR × C*05), 10 litters (C*05/KIR × WT), 10 litters (WT × WT) and 8 litters (KIR × WT). *p < 0.05, **p < 0.01, ***p < 0.001, Linear mixed-effects model was used for statistical testing. Exact p-values are: a p = 0.0001 (KIR × C*05 vs. WT × C*05), p = 0.0051 (KIR × C*05 vs. KIR × WT), p = 0.0198 (KIR × C*05 vs. C*05/KIR × WT), p = 0.0043 (KIR × C*05 vs. WT × WT). Source Data are provided as a Source Data file.
Fig. 4
Fig. 4. KIR2DL1 and HLA-C*05 interaction alters uterine spiral arteries.
a Representative uteroplacental circulation from WT × C*05 mating at gd10.5 visualized following perfusion with an X-ray contrast agent and imaging by micro-CT. Spiral arteries are shown in dark purple and the yolk sac is shown in yellow. b, c Representative spiral artery vasculature images from the different mating crosses at gd10.5. d, f Spiral artery diameter (d) or segment length (f) is shown. e and g Radii distribution of spiral artery vessel nodes (e) and distribution of segment lengths (g) is shown. h Ratio of the mean of the spiral artery segment length and mean of the spiral artery diameter of each implantation site is shown. i Total network fluid conductance based on the Poiseuille flow model. Mean ± SEM is shown. n represents biologically independent implantation sites from each group. d, f, h n = 17 (WT × C*05) and 21 (KIR × C*05). i n = 10 (WT × C*05) and 8 (KIR × C*05). *p < 0.05, **p < 0.01, ***p < 0.001. Linear mixed-effects model was used for statistical testing in d, f. Exact p-values are: d p = 0.0031, f p = 0.0134. Two-tailed Mann–Whitney U-test used for h, i. Exact p-values are: h p = 0.0003, i p = 0.0676. Source Data are provided as a Source Data file.
Fig. 5
Fig. 5. Heterogeneity of NK cells at the mouse maternal–fetal interface.
a Overview of study design. b UMAP embedding of full-length scRNA-seq on sorted NK cells colored by subtype as cNK or trNK (determined by FACS sorting and verified using the cNK and trNK signature score) or by Louvain cluster label. c Dot plot showing top six cNK and trNK marker genes. d UMAP embedding of NK cells profiled by droplet-based scRNA-seq and colored by Louvain cluster or the cNK and trNK signature score. e Summary of NK subtypes identified in sorted uNK cells derived from both full-length and droplet-based scRNA-seq data. f Dot plot of top five marker genes for each cluster shown in b. gi Left: top twenty genes driving the topic; the score has been scaled to improve visualization. Right: UMAP embedding of droplet-based scRNA-seq uNK data (same as in panel d) colored by the weight of each cell in the topic. Topic 3 (g), Topic 8 (h), Topic 9 (i). In all plots, cells from all three genotypes (WT × C*05, KIR × C*05, C*05/KIR × WT) are included. For full-length scRNA-seq, n = 5 mice for all three mating groups, k = 2176 cells (trNK = 1091 and cNK = 1085). For droplet-based scRNA-seq, n = 4 mice (WT × C*05) and 3 mice (KIR × C*05 and C*05/KIR × WT), k = 30,147 uNK cells. Each mouse represents cells pooled from the maternal–fetal interface of multiple implantation sites within the same litter. In dot plots, the size of the dot represents the fraction of cells with nonzero expression of each gene, and the color of the dot represents the average nonzero gene expression. Source Data are provided as a Source Data file.
Fig. 6
Fig. 6. FGR phenotype characterization in NK cells.
a Overview of FGR phenotype characterization by topic modeling and differential gene expression analysis. b, c Topic modeling of droplet-based scRNA-seq uNK cell data from the mouse maternal–fetal interface. The cell topic weight distributions for the displayed topics Topic 6 (b), and Topic 16 (c) were significantly different between KIR × C*05 vs. control mating groups. Left: top 20 genes driving the topic; the score has been scaled to improve visualization. Right: UMAP embedding colored by the cell weight for that topic—bright red indicates the cell is high in the topic and dark blue indicates the cell is low in the topic. d, e Re-validation of Ccl1 (d) and Gzme/d/g (e) from the topics using in situ hybridization on gd9.5 implantation sites. Representative probe staining on sections from the different mating crosses is shown. Quantification depicted as average probe copies per cell or percentage of positive cells within a stained section for the respective probes is shown as mean ± SEM. f Volcano plots showing differentially expressed genes in the FGR KIR × C*05 mating combination. Differentially expressed genes were calculated on a per cluster basis, and are stratified as such in the panel. b, c n = 4 mice (WT × C*05) and 3 mice (KIR × C*05 and C*05/KIR × WT), k = 30,147 uNK cells. d, e n = 14 (WT × C*05) and 13 (KIR × C*05) independent sections for Ccl1 and n = 16 (WT × C*05) and 15 (KIR × C*05) independent sections for Gzmd/e/g, *p < 0.05, Two-tailed Mann–Whitney U-test. Exact p-values are: d p = 0.0332, e p = 0.0448. Source Data are provided as a Source Data file.
Fig. 7
Fig. 7. The maternal–fetal interface atlas and cell–cell interactions in FGR.
a Overview of scRNA-seq analysis of unsorted cells from the maternal–fetal interface. b UMAP embedding of unsorted cells colored by cell type classification. c Heatmap of select differentially expressed genes (calculated on a per cell type basis) between KIR × C*05 and WT × C*05 mating groups. Every gene in the heatmap was differentially expressed in at least one cell type. Color of square indicates log of the average expression fold change between KIR ×C*05 and WT × C*05. Bright red: higher average expression in KIR × C*05; Dark blue: lower average expression in KIR × C*05; White: no difference; gray: gene expressed in <10% in both conditions within a cell subset. Colored boxes to the left indicate top functional annotation of each gene. de Cell–cell interaction analysis by CellPhoneDB. Cell–cell interaction network for WT × C*05 (d), and KIR × C*05 (e) cells. Color of circle corresponds to the cell type classification in panel b. Line weight represents number of significant ligand–receptor interactions found between the cell type nodes. Interactions increased or decreased in KIR × C*05 group compared to WT × C*05 group are shown in red and blue, respectively. f Select ligand–receptor pairs unique in either KIR × C*05 or WT × C*05 groups in one of the NK cell types. The first gene listed in the label was found in one of the NK clusters, and the second gene was found in an interacting non-NK cell type cluster. Large circle indicates that R–L pair is found between an NK cluster and the indicated cell type, small circle indicates absence of the R–L pair within the interacting cell types; cell types are colored as in b. b n = 3 mice each from WT × C*05, KIR × C*05, and C*05/KIR × WT, k = 42,869 cells. Each mouse represents cells pooled from the maternal–fetal interface of multiple implantation sites within the same litter. Source Data are provided as a Source Data file.

Similar articles

Cited by

References

    1. de Onis M, Blossner M, Villar J. Levels and patterns of intrauterine growth retardation in developing countries. Eur. J. Clin. Nutr. 1998;52:S5–S15. - PubMed
    1. Romo A, Carceller R, Tobajas J. Intrauterine growth retardation (IUGR): epidemiology and etiology. Pediatr. Endocrinol. Rev. 2009;6:332–336. - PubMed
    1. Imdad A, Bhutta ZA. Nutritional management of the low birth weight/preterm infant in community settings: a perspective from the developing world. J. Pediatr. 2013;162:S107–S114. doi: 10.1016/j.jpeds.2012.11.060. - DOI - PubMed
    1. Bernstein IM, Horbar JD, Badger GJ, Ohlsson A, Golan A. Morbidity and mortality among very-low-birth-weight neonates with intrauterine growth restriction. Vt. Oxf. Netw. Am. J. Obstet. Gynecol. 2000;182:198–206. doi: 10.1016/S0002-9378(00)70513-8. - DOI - PubMed
    1. Rosenberg A. The IUGR newborn. Semin. Perinatol. 2008;32:219–224. doi: 10.1053/j.semperi.2007.11.003. - DOI - PubMed

Publication types