. 2022 Jul 29;13(1):4412.
doi: 10.1038/s41467-022-32061-1.

TRIM28-dependent SUMOylation protects the adult ovary from activation of the testicular pathway

Affiliations

TRIM28-dependent SUMOylation protects the adult ovary from activation of the testicular pathway

Moïra Rossitto et al. Nat Commun. .

Abstract

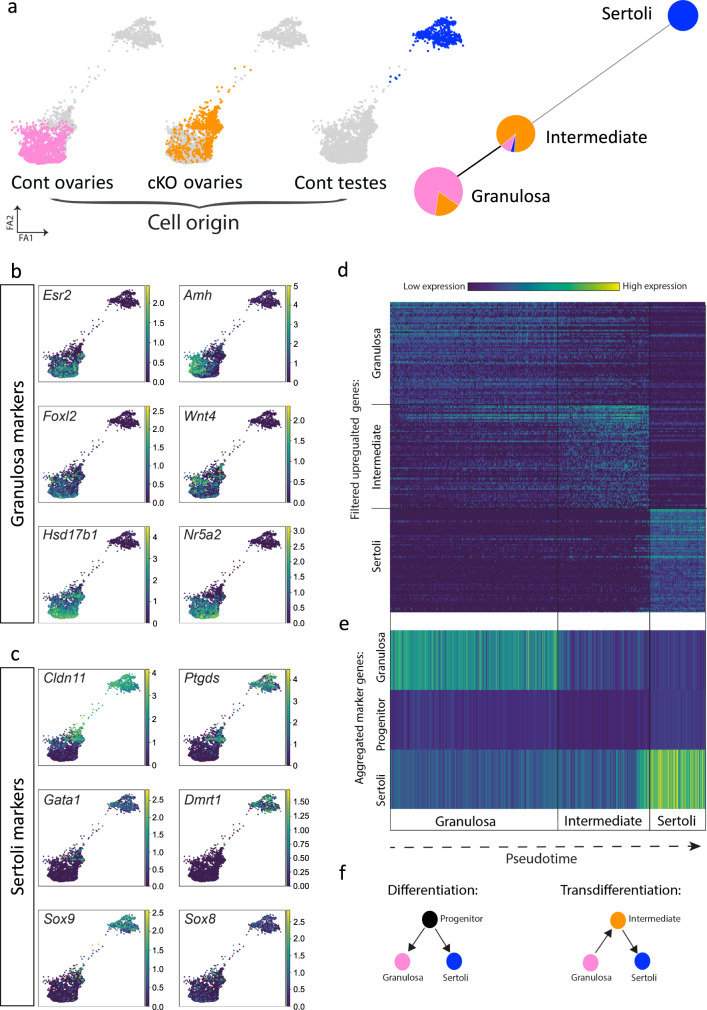
Gonadal sexual fate in mammals is determined during embryonic development and must be actively maintained in adulthood. In the mouse ovary, oestrogen receptors and FOXL2 protect ovarian granulosa cells from transdifferentiation into Sertoli cells, their testicular counterpart. However, the mechanism underlying their protective effect is unknown. Here, we show that TRIM28 is required to prevent female-to-male sex reversal of the mouse ovary after birth. We found that upon loss of Trim28, ovarian granulosa cells transdifferentiate to Sertoli cells through an intermediate cell type, different from gonadal embryonic progenitors. TRIM28 is recruited on chromatin in the proximity of FOXL2 to maintain the ovarian pathway and to repress testicular-specific genes. The role of TRIM28 in ovarian maintenance depends on its E3-SUMO ligase activity that regulates the sex-specific SUMOylation profile of ovarian-specific genes. Our study identifies TRIM28 as a key factor in protecting the adult ovary from the testicular pathway.


Conflict of interest statement

The authors declare no competing interests.

Figures

Fig. 1
Fig. 1. Trim28 loss in granulosa cells induces masculinisation of the adult ovary.
a compared with control ovaries, in granulosa cells of 20 dpp Trim28cKO ovaries, FOXL2 expression is progressively lost and SOX8 (Sertoli cell marker) starts to be expressed. An overlap of both stainings is also visible, showing that some cells are co-expressing FOXL2 and SOX8. Among the SOX8-positive cells, few express also SOX9, suggesting that SOX8 may precede SOX9. Green staining of oocytes (*) is a non-specific antibody artefact of early folliculogenesis. Scale bar: 50 µm. b in 4-month-old Trim28cKO ovaries, transdifferentiation to Sertoli cells is complete. Compared with control ovaries, in Trim28cKO ovaries FOXL2 signal has almost disappeared, and follicles are reorganised in pseudo-tubules that express the Sertoli markers SOX8, SOX9, and DMRT1. Protein (green or red) are merged with DNA stain (blue). Scale bar: 50 µm. c RT-qPCR analysis of the temporal (in months) gene expression variations in control ovaries (Cont Ov), Trim28cKO ovaries (cKO Ov), and control testes (Cont Test). In Trim28cKO ovaries, typical ovarian genes are progressively downregulated, but for Rspo1, and testis genes are upregulated. Bars are the mean ± SEM. Details of the statistical analysis are provided in Source data file. Source data are provided as a Source Data file. Bars are the mean ± SEM. For 0.5, 2 and 4 months: control ovaries n = 5, 4, 4 animals (gonad pairs) respectively; cKO ovaries n = 5 animals, control testes: n = 3 animals. Details of the statistical analysis are provided in Source data file. d Heatmap of the RNA-seq analysis of 7-month-old ovaries (see Data S1) showing that 2896 and 1669 genes are up- and downregulated, respectively, in Trim28cKO compared with control ovaries. Normalised expression values are expressed as Log2 fold-change (Control vs cKO), from −5 (deep violet) to +8 (yellow). Source data are provided as a Source Data file. e Trim28 cKO induces the masculinisation of the ovarian steroid profile. Steroids were extracted from 7-month-old control (Cont Ov) and Trim28cKO (cKO Ov) ovaries, and control testes (Cont Test) and quantified (ng/g of tissue) by mass spectroscopy. Data are the mean ± SEM. For testosterone n = 4 animals (gonad pairs). For Androstenedione n = 3. For β-estradiol n = 3,3, 4 animals for Cont Ov, cKO Ov and Cont Test respectively. For estrone n = 3,4, 4 animals for Cont Ov, cKO Ov and Cont Test respectively. P value for Testosterone *:0.0324; for androstenedione * and**: 0.2013 and 0.005 respectively; for β-estradiol *: 0.0215; for estrone ** and ***: 0.058 and 0.0008 respectively. (One-way ANOVA with Dunnett’s multiple comparisons test). Source data are provided as a Source Data file. Details of the statistical analysis are provided in Source data file. For the immunofluorescences, at least three independent biological replicates were analysed, and the images presented are representative of all replicates.
Fig. 2
Fig. 2. scRNA-seq analysis of ovarian and testis supporting cells reveals an intermediate cell population during transdifferentiation.
a Force directed graphs showing the scRNA-seq results of adult Trim28cKO ovarian supporting cells (orange), control granulosa (pink), and Sertoli cells (blue) (left). Each dot is one cell (coloured according to the sample of origin), and the distance between cells indicates their inferred transcriptional similarity. Leiden clustering divided the cells into three populations displayed using partition-based graph abstraction (right). Each node represents a cell cluster, and the proportion of Trim28cKO and control granulosa and Sertoli cells is shown as a pie-chart on each node. The edges between nodes represent the neighbourhood relation among clusters with a thicker line showing a stronger connection between clusters. b, c Gene expression of selected granulosa and Sertoli cell markers in the supporting cells analysed in a. Each dot corresponds to one cell from a, and gene expression level ranges from 0 (purple) to high (yellow). d Heatmap showing the expression level of the top filtered differentially expressed genes in the three cell clusters along the pseudo-time. See Table Data S3 for the full list of genes. e Heatmap showing the mean expression levels in the three cell clusters along the pseudo-time of several thousand genes from a previous study on the granulosa, supporting progenitor, and Sertoli cell lineages. Source data are provided as a Source Data file. f Schematic illustrating the processes of differentiation and transdifferentiation.
Fig. 3
Fig. 3. TRIM28 and FOXL2 act together on chromatin to maintain the ovarian pathway.
a TRIM28 and FOXL2 are co-expressed in the nucleus of most follicular granulosa cells in 4-month-old control ovaries and in cells with flat nucleus surrounding follicles (identified as steroidogenic theca cells). In Trim28cKO ovaries, only few cells expressed FOXL2. Scale bar: 10 µm. At least three independent biological replicates were analysed, and the images presented are representative of all replicates. b Overlap between TRIM28 and FOXL2 genomic localisation in the adult ovary. Heatmaps in blue represent FOXL2 ChIP-seq and inputs reads mapped on TRIM28 peaks (±1 kb from the centre). Red traces represent TRIM28 ChIP-seq and inputs reads mapped on FOXL2 peaks. The Venn diagram on the right shows that 32,097 of the 51,764 TRIM28 peaks (62%) and of the 58,581 FOXL2 peaks (55%) overlap in control ovaries. c Examples of TRIM28 and/or FOXL2 peaks in/around genes the expression of which is altered in Trim28cKO ovaries. Upper panel: ovarian-specific genes downregulated in Trim28cKO ovaries (see also Supplementary Fig. 11). The Foxl2 gene is represented with the co-regulated non-coding Foxl2os gene. Lower panel: testicular-specific genes upregulated in Trim28cKO ovaries (see also Supplementary Fig. 12). Green rectangles in the Sox9 panel: open chromatin regions described in the embryonic gonads, 13 corresponds to Enhancer13 that is crucial for sex-determination. Relevant ChIP-seq peaks are highlighted in light blue (TRIM28) and light red (FOXL2). Yellow arrows indicate the gene orientation. d Pie charts showing up- and downregulated genes in Trim28cKO ovaries that are bound by TRIM28 and/or FOXL2. Genes are listed in Data S7. e Enrichment for binding motifs of transcription factors involved in granulosa cell fate maintenance (FOXL2, RUNX1 and ESR1/2) in reads of TRIM28 and FOXL2 ChIP-seq of adult control ovaries (this study), and TRIM28 ChIP-seq of bone marrow and of thymus. n = 3 independent computational analyses. Bars are the mean ± SD. Ordinary one-way ANOVA with Tukey’s multiple comparisons test. Adj P Val: for all motifs ****<0.0001. RUNX1: *=0.0186; **=0.0037; ***=0.0003. ESR1: ***=0.00020,0324 ESR2: ***=0.0005. More statistical data are in Source data file. Source data are provided as a Source Data file. f Left, plot showing enriched proteins, ranked by relative abundance, identified by FOXL2 ChIP-SICAP. Only significant proteins (>2-fold enrichment over No-antibody control, n = 2) are shown. TRIM28 was identified amongst the top 20 proteins found to interact with FOXL2. Pie-chart (right) shows the percentage of the relative intensities of FOXL2 chromatin partners, normalised to the total abundance of the enriched proteins.
Fig. 4
Fig. 4. Loss of TRIM28 SUMO-E3-ligase activity in granulosa cells phenocopies Trim28 conditional knock-out.
a Schematic of the SUMO pathway with TRIM28 E3-SUMO ligase activity. After proteolytic maturation by sentrin-specific proteases (SENPs), SUMO C-terminus is activated by the heterodimeric SUMO-activating enzyme E1 (SAE1/SAE2), and then transferred to a cysteine of E2 (UBC9). Subsequently, the E3 ligases (TRIM28) transfer SUMO from E2 to a lysin residue(s) of target proteins. SUMO2 and 3 diverge by only one residue, making them indistinguishable by antibodies, thus they are currently referred to as SUMO2. b RT-qPCR analysis of ovarian- and testicular-specific genes in 8-week-old Trim28cKO, Trim28Phd/cKO, Trim28Phd/+, and control ovaries. Bars are the mean ± SEM, n = 5 animals (gonad pairs). P: < 0.0001 (****), 0.0002(***), 0.0021(**), 0.032(*) (Ordinary one-way ANOVA with Dunnett’s multiple comparisons test). Details of the statistical analysis are provided in the Source data file. Source data are provided as a Source Data file. c FOXL2 is expressed in control and Trim28Phd/+ ovaries, but not in Trim28Phd/cKO and Trim28cKO ovaries. Like in Trim28cKO ovaries, SOX9, SOX8 and DMRT1 are expressed in pseudo-tubules of Trim28Phd/cKO ovaries, but not in control and Trim28Phd/+ ovaries. Protein (green or red) is merged with DNA stains (blue). Scale bar: 50 µm. d Confocal microscopy shows strong SUMO1 and 2 nuclear staining in granulosa cells of control ovaries. The staining intensity is markedly decreased in Trim28cKO and Trim28Phd/cKO ovaries. SUMO1/2 staining is merged with DNA staining. Scale bar: 20 µm. Right panels: quantification of SUMO1 and SUMO2 signal intensity relative to DNA staining. For the three conditions (control and mutants) each column represents one experiment, n represents the number of cells analysed. P: < 0.0001 (****), 0.0002(***), 0.0021(**), 0.032(*)(two-way ANOVA with Dunnett’s multiple comparisons test). Details of the statistical analysis are provided in Source data file. Source data are provided as a Source Data file. For the immunofluorescences, at least three independent biological replicates were analysed, and the images presented are representative of all replicates.
Fig. 5
Fig. 5. Genome-wide SUMOylation changes in Trim28cKO and Trim28Phd/cKO ovaries.
a Normalised quantification of SUMO1 and SUMO2 ChIP-seq reads from control (Cont), Trim28cKO (cKO) and Trim28Phd/cKO (PHD) ovaries mapped on deregulated regions: peaks significantly decreased (Log2 Fold-Change <1; hypo-SUMOylated; blue), and increased (Log2 Fold-Change >1; hyper-SUMOylated; red) in Trim28cKO and Trim28Phd/cKO ovaries compared with controls. The number of peaks analysed for each condition is reported on upper (blue or light red) of each chart. b Normalised quantification of TRIM28 ChIP-seq reads from control (±1 kb from the centre) at SUMO1 and SUMO2 hypo-SUMOylated peaks (blue box plots) and SUMO1 and 2 hyper-SUMOylated peaks (red box plots). cKO: Trim28cKO. PHD: Trim28Phd/cKO. For box plots, the centre line corresponds to the median. The number of peaks analysed is the same as reported in Fig. 5a. For a and b, the central rectangle spans the first quartile (Q1) to the third quartile (Q3) (also called IQR for interquartile range). The upper whisker extends from the hinge to the largest value no further than 1.5 × IQR from the hinge (Q3 + 1.5 × IQR). The lower whisker extends from the hinge to the smallest value at most 1.5 × IQR of the hinge (Q1−1.5 × IQR). Number of libraries: TRIM28 ChIP-seq, n = 1; for SUMO1 and SUMO2 (from control, Trim28cKOand Trim28Phd/cKO) ChIP-seq n = 2. Each library was prepared from ovaries of six different animals. c Pie charts showing that in Trim28cKO ovaries, downregulated genes with SUMOylation changes are preferentially hypo-SUMOylated, while upregulated genes with SUMOylation changes are preferentially hyper-SUMOylated. Number of genes are between brackets. Genes are listed in Data S7.
Fig. 6
Fig. 6. Examples of SUMOylation status (SUMO1 and 2) in control and mutant ovaries of genes the expression of which is altered in Trim28cKO ovaries.
Upper panel: ovarian-specific genes downregulated in Trim28cKO ovaries. Lower panel: testicular-specific genes upregulated in Trim28cKO ovaries. Cont: control. cKO: Trim28cKO. PHD: Trim28Phd/cKO. Yellow arrows indicate the gene orientation. Light blue and red, regions significantly hypo-SUMOylated and hyper-SUMOylated, respectively, in mutants. Blue and red triangles represent the centre of TRIM28 and FOXL2 peaks respectively (see supplementary Fig. 11 and 12). Green rectangles in the Sox9 panel: putative enhancers and Enhancer13 previously described. Green arrows indicate the distance relative to the putative enhancers.

Similar articles

Cited by

References

    1. Capel B. Vertebrate sex determination: evolutionary plasticity of a fundamental switch. Nat. Rev. Genet. 18, 675–689 (2017). - PubMed
    1. Couse JF, et al. Postnatal sex reversal of the ovaries in mice lacking estrogen receptors alpha and beta. Science. 1999;286:2328–2331. doi: 10.1126/science.286.5448.2328. - DOI - PubMed
    1. Britt KL, Findlay JK. Estrogen actions in the ovary revisited. J. Endocrinol. 2002;175:269–276. doi: 10.1677/joe.0.1750269. - DOI - PubMed
    1. Uhlenhaut NH, et al. Somatic sex reprogramming of adult ovaries to testes by FOXL2 ablation. Cell. 2009;139:1130–1142. doi: 10.1016/j.cell.2009.11.021. - DOI - PubMed
    1. Lindeman RE, et al. Sexual cell-fate reprogramming in the ovary by DMRT1. Curr. Biol. 2015;25:764–771. doi: 10.1016/j.cub.2015.01.034. - DOI - PMC - PubMed

Publication types

Substances