. 2022 Jul 29;12(1):13091.
doi: 10.1038/s41598-022-16881-1.

A 19 day earth tide measurement with a MEMS gravimeter

Affiliations

A 19 day earth tide measurement with a MEMS gravimeter

Abhinav Prasad et al. Sci Rep. .

Abstract

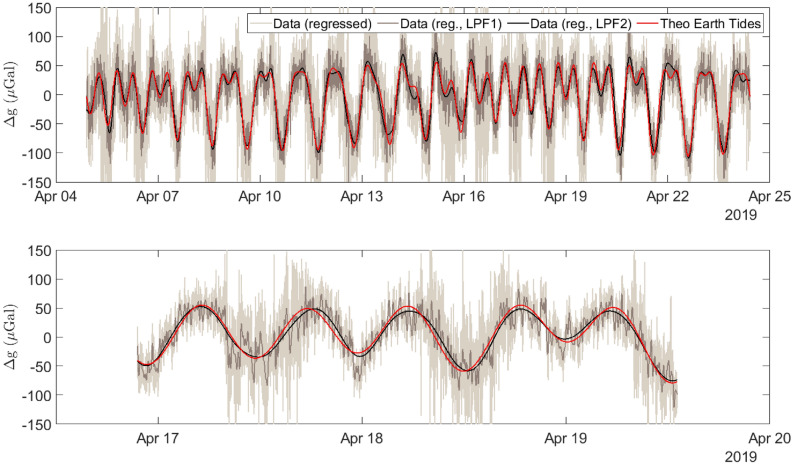
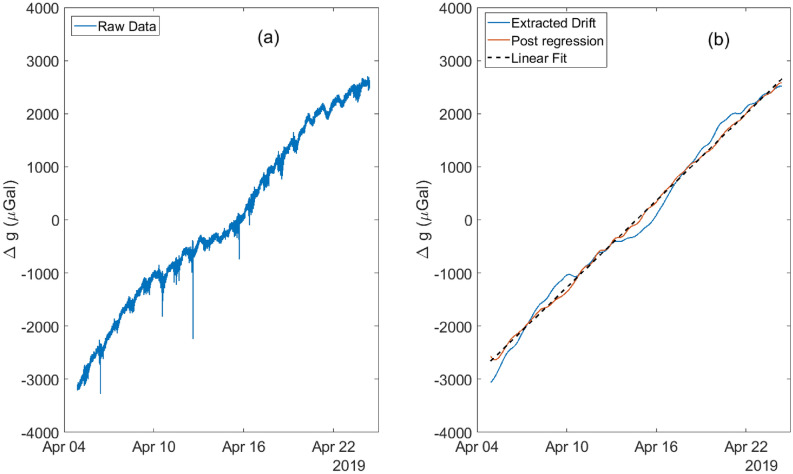
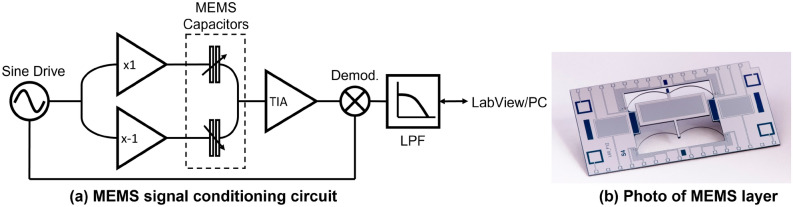
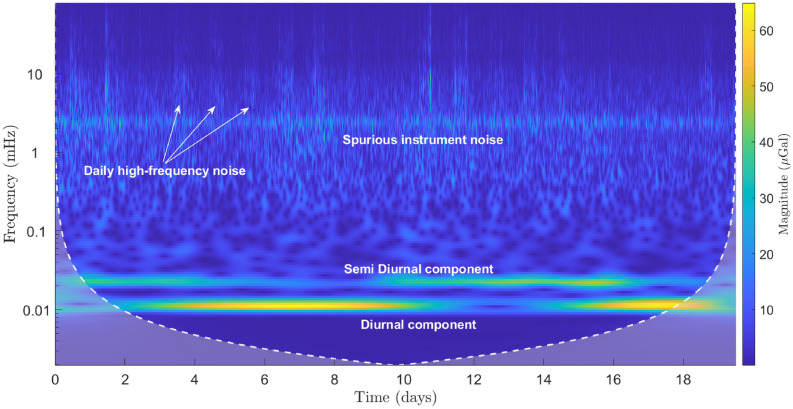
The measurement of tiny variations in local gravity enables the observation of subterranean features. Gravimeters have historically been extremely expensive instruments, but usable gravity measurements have recently been conducted using MEMS (microelectromechanical systems) sensors. Such sensors are cheap to produce, since they rely on the same fabrication techniques used to produce mobile phone accelerometers. A significant challenge in the development of MEMS gravimeters is maintaining stability over long time periods, which is essential for long term monitoring applications. A standard way to demonstrate gravimeter stability and sensitivity is to measure the periodic elastic distortion of the Earth due to tidal forces-the Earth tides. Here, a 19 day measurement of the Earth tides, with a correlation coefficient to the theoretical signal of 0.975, has been presented. This result demonstrates that this MEMS gravimeter is capable of conducting long-term time-lapse gravimetry, a functionality essential for applications such as volcanology.


Conflict of interest statement

The authors declare no competing interests.

Figures

Figure 1
Figure 1
The MEMS device. An exploded view of the MEMS gravimeter assembly. The middle MEMS layer is mounted upon a base plate. The silicon base plate simply serves as a mechanical support for the MEMS layer. The MEMS layer has metal capacitive electrodes (combs) patterned on its surface. Corresponding pickup electrodes are patterned on an upper glass layer (made from SD2 silica), which is used to read out the signal as the MEMS proof-mass moves. A couple of reference capacitors were fabricated on the frame of the MEMS layer to monitor the gap/lateral movement between the assembly layers of the device.
Figure 2
Figure 2
Two time series plots of the Earth tide measurement, conducted at the University of Glasgow in April 2019. In both graphs, the red series is a theoretical signal calculated using T-Soft, the gray-scale series are the experimental data recorded using the MEMS gravimeter. From lightest grey to black, these series represent increasing filtering of the data using a low-pass filter. The black series was filtered with a 20 μHz bandwidth low-pass filter. All of the theoretical data is presented after a regression analysis was used to remove drifts caused by temperature variations within the system. The upper graph shows the full data set, the lower graph shows a zoomed in selection of this data.
Figure 3
Figure 3
An amplitude spectral density plot of the post-regression instrument data (the blue and the orange series), and the instrument noise data (the yellow series). The blue series represents data that were recorded at a sampling rate of 0.18 Hz. The orange and the yellow series were recorded at a sampling rate of 20 Hz. Three distinct frequency bands of interest can be observed in the data—these are highlighted using the grey bands. At 10-5 Hz, the diurnal and semi-diurnal components of the Earth tides are visible; the primary and secondary microseisms can be observed at around 0.2 Hz; and the resonant peak of the MEMS device itself is located at 7.35 Hz. The sensor noise has a flat spectral response for the measured bandwidth. Note: The downward roll-off at high frequencies for the blue and the yellow series is due to low-pass filtering at the demodulation stage.
Figure 4
Figure 4
The Allan Deviation (AD) plots for the raw slow sampled MEMS data (the blue series), the raw fast sampled MEMS data (the orange series), and the sensor noise data (the yellow series). Dashed series are a result of fitting straight lines across different averaging periods for each data set. The slope of each fit is represented in the form of power-laws. Note: the small integration time (τ) data is not shown for the blue (τ<22tslow, where, tslow=5.5 s) and the yellow series (τ<23tfast, where, tfast=0.05 s) as the AD values for these times are affected by the low-pass filtering stage.
Figure 5
Figure 5
The raw data (a) and the drift analysis (b) plots for the gravimeter. The raw data is first low-pass filtered to retain only very long-term features (<2 μHz) in the raw data (blue series in (b)). The extracted drift is then processed to regress out the impact of the temperature and the control instrumentation. The post-regression data (red series) is then fitted against a straight line (dashed black series) to obtain the drift rate of the gravimeter.
Figure 6
Figure 6
An illustration of the different components of the experimental set up: (a) represents the lock-in based signal conditioning of the MEMS sensor, and (b) is a photo of a fully-released MEMS layer (courtesy: Kelvin Nanotechnology Limited).
Figure 7
Figure 7
A scalogram graph of the MEMS data generated using continuous wavelet analysis on Matlab. The double Earth tide peaks are visible at the lower frequencies while the higher frequency band consists of a continuous spurious signal arising from the temperature control electronics and intermittent high frequency noise.

References

    1. Barnes G, Barraud J. Imaging geologic surfaces by inverting gravity gradient data with depth horizons. Geophysics. 2012;77:G1–G11. doi: 10.1190/geo2011-0149.1. - DOI
    1. Rim H, Li Y. Advantages of borehole vector gravity in density imaging. Geophysics. 2015;80:G1–G13. doi: 10.1190/geo2013-0394.1. - DOI
    1. Kaufmann G. Geophysical mapping of solution and collapse sinkholes. Appl. Geophys. 2014;111:271–288. doi: 10.1016/j.jappgeo.2014.10.011. - DOI
    1. Butler D. Microgravimetric and gravity gradient techniques for detection of subsurface cavities. Geophysics. 1984;49:1084–1096. doi: 10.1190/1.1441723. - DOI
    1. Romaides A, et al. A comparison of gravimetric techniques for measuring subsurface void signals. J. Phys. D Appl. Phys. 2001;34:433–443. doi: 10.1088/0022-3727/34/3/331. - DOI