Metagenomic analysis reveals associations between salivary microbiota and body composition in early childhood
- PMID: 35906254
- PMCID: PMC9338228
- DOI: 10.1038/s41598-022-14668-y
Metagenomic analysis reveals associations between salivary microbiota and body composition in early childhood
Abstract
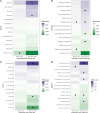
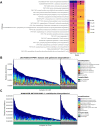
Several studies have shown that body mass index is strongly associated with differences in gut microbiota, but the relationship between body weight and oral microbiota is less clear especially in young children. We aimed to evaluate if there is an association between child growth and the saliva microbiome. We hypothesized that associations between growth and the saliva microbiome would be moderate, similarly to the association between growth and the gut microbiome. For 236 toddlers participating in the New Hampshire Birth Cohort Study, we characterized the association between multiple longitudinal anthropometric measures of body height, body weight and body mass. Body Mass Index (BMI) z-scores were calculated, and dual-energy x-ray absorptiometry (DXA) was used to estimate body composition. Shotgun metagenomic sequencing of saliva samples was performed to taxonomically and functionally profile the oral microbiome. We found that within-sample diversity was inversely related to body mass measurements while community composition was not associated. Although the magnitude of associations were small, some taxa were consistently associated with growth and modified by sex. Certain taxa were associated with decreased weight or growth (including Actinomyces odontolyticus and Prevotella melaninogenica) or increased growth (such as Streptococcus mitis and Corynebacterium matruchotii) across anthropometric measures. Further exploration of the functional significance of this relationship will enhance our understanding of the intersection between weight gain, microbiota, and energy metabolism and the potential role of these relationships on the onset of obesity-associated diseases in later life.
© 2022. The Author(s).
Conflict of interest statement
The authors declare no competing interests.
Figures


Similar articles
-
No association between the early-life gut microbiota and childhood body mass index and body composition.Med. 2025 Apr 11;6(4):100538. doi: 10.1016/j.medj.2024.10.015. Epub 2024 Nov 12. Med. 2025. PMID: 39536756
-
Gut Microbiota in the First 2 Years of Life and the Association with Body Mass Index at Age 12 in a Norwegian Birth Cohort.mBio. 2018 Oct 23;9(5):e01751-18. doi: 10.1128/mBio.01751-18. mBio. 2018. PMID: 30352933 Free PMC article.
-
Gut Microbiota and Body Weight in School-Aged Children: The KOALA Birth Cohort Study.Obesity (Silver Spring). 2018 Nov;26(11):1767-1776. doi: 10.1002/oby.22320. Epub 2018 Oct 8. Obesity (Silver Spring). 2018. PMID: 30296366 Free PMC article.
-
Offspring body size and metabolic profile - effects of lifestyle intervention in obese pregnant women.Dan Med J. 2014 Jul;61(7):B4893. Dan Med J. 2014. PMID: 25123127 Review.
-
[Simple obesity in children. A study on the role of nutritional factors].Med Wieku Rozwoj. 2006 Jan-Mar;10(1):3-191. Med Wieku Rozwoj. 2006. PMID: 16733288 Review. Polish.
Cited by
-
Prevalence of Obesity and Dental Caries in High School Adolescents during the First Decade of Saudi Vision 2030: A Cross-Sectional Study.Children (Basel). 2024 May 8;11(5):563. doi: 10.3390/children11050563. Children (Basel). 2024. PMID: 38790558 Free PMC article.
-
Secular trends in dental caries in Korean children and adolescents: 2007-2019 Korea National Health and Nutritional Examination Survey.Sci Rep. 2025 Mar 3;15(1):7498. doi: 10.1038/s41598-025-91271-x. Sci Rep. 2025. PMID: 40032922 Free PMC article.
-
Obesity and Dental Caries in School Children.J Clin Med. 2024 Feb 1;13(3):860. doi: 10.3390/jcm13030860. J Clin Med. 2024. PMID: 38337554 Free PMC article.
-
Effects of intergenerational transmission of small intestinal bacteria cultured from stunted Bangladeshi children with enteropathy.bioRxiv [Preprint]. 2024 Nov 3:2024.11.01.621574. doi: 10.1101/2024.11.01.621574. bioRxiv. 2024. PMID: 39554152 Free PMC article. Preprint.
-
Prediction of postoperative infection through early-stage salivary microbiota following kidney transplantation using machine learning techniques.Ren Fail. 2025 Dec;47(1):2519816. doi: 10.1080/0886022X.2025.2519816. Epub 2025 Jul 3. Ren Fail. 2025. PMID: 40605535 Free PMC article.
References
-
- Fryar, C. D.C.M., Afful, J., Prevalence of overweight, obesity, and severe obesity among children and adolescents aged 2–19 years: United States, 1963–1965 through 2017–2018. 2020.
Publication types
MeSH terms
Grants and funding
LinkOut - more resources
Full Text Sources

