

Changes in intestinal microbiota in postmenopausal oestrogen receptor-positive breast cancer patients treated with (neo)adjuvant chemotherapy
- PMID: 35906259
- PMCID: PMC9338016
- DOI: 10.1038/s41523-022-00455-5
Changes in intestinal microbiota in postmenopausal oestrogen receptor-positive breast cancer patients treated with (neo)adjuvant chemotherapy
Abstract
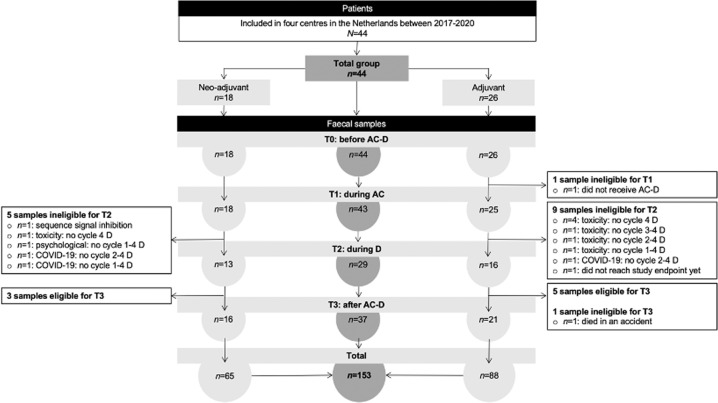
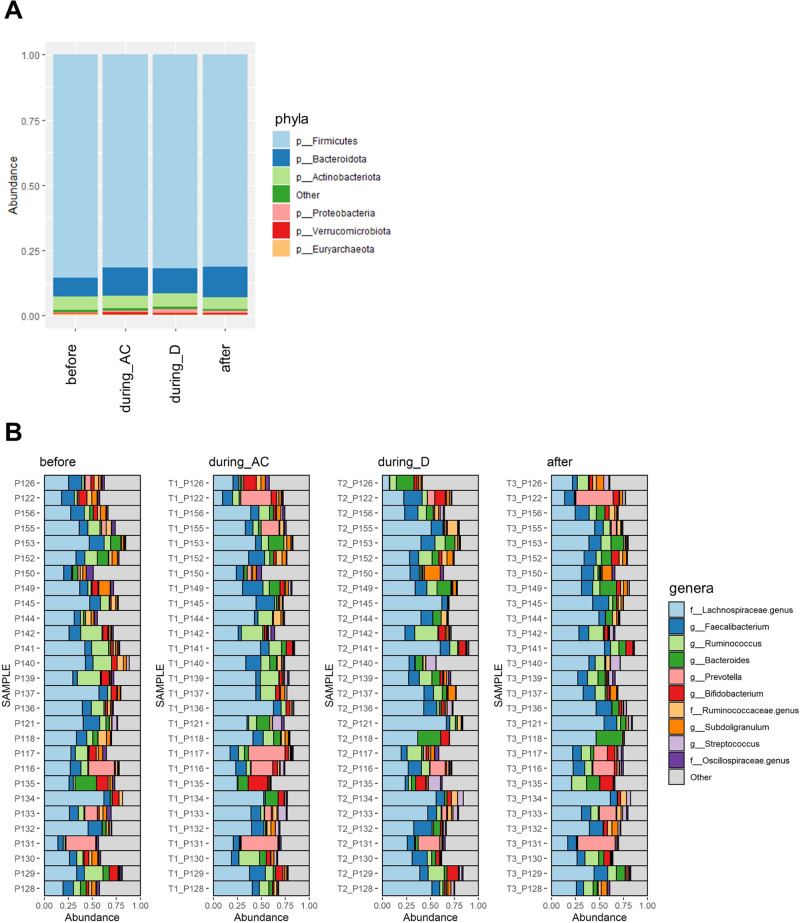
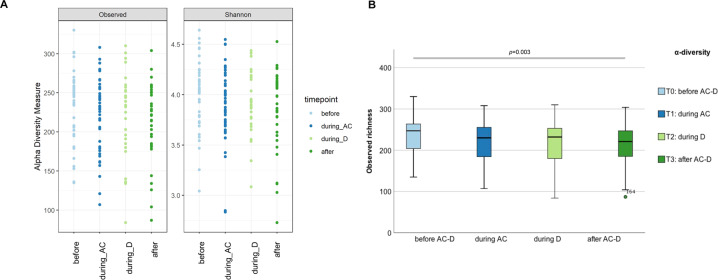
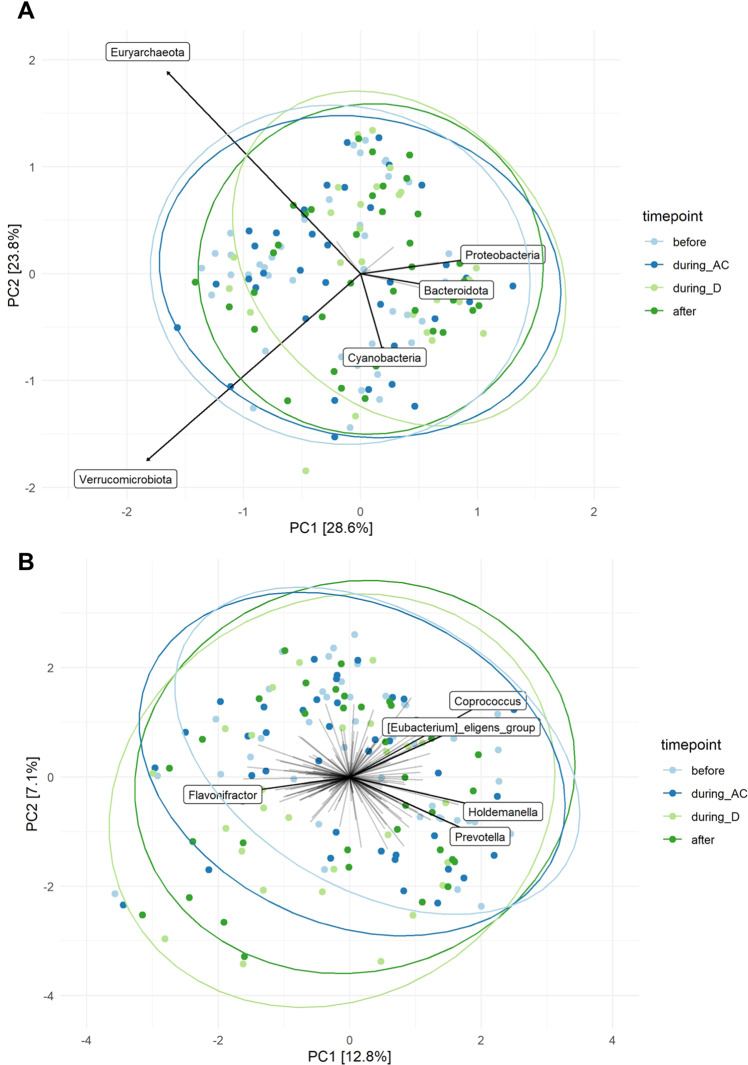
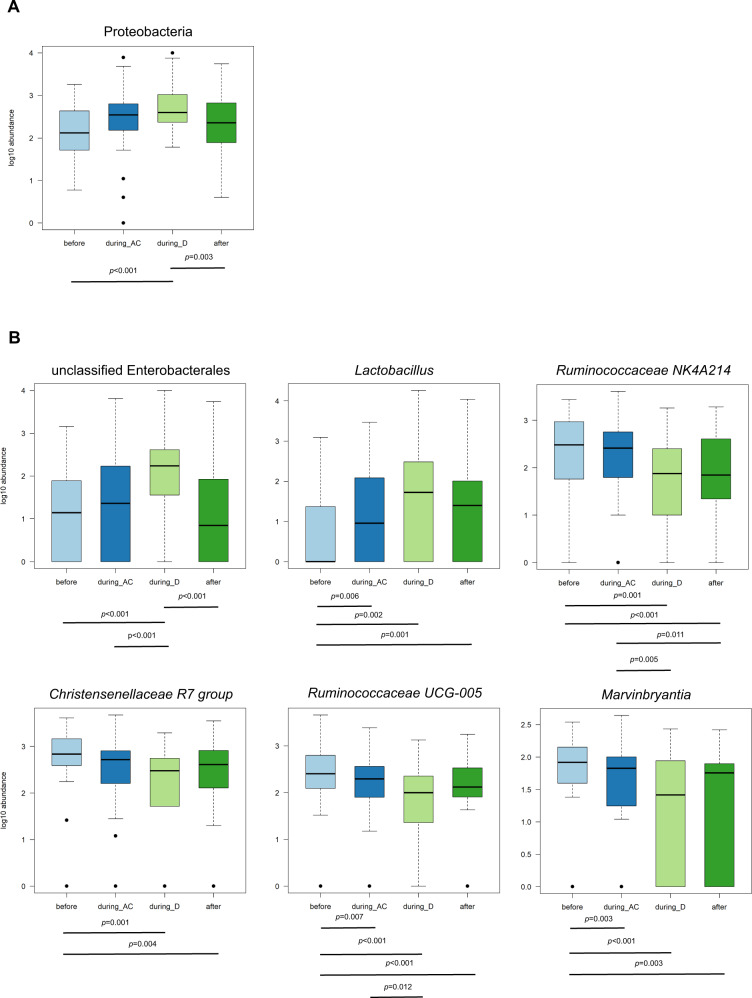
This clinical study explored the associations between the intestinal microbiota, chemotherapy toxicity, and treatment response in postmenopausal oestrogen receptor positive breast cancer patients.Oestrogen receptor positive postmenopausal breast cancer patients were prospectively enroled in a multicentre cohort study and treated with 4 cycles of (neo)adjuvant adriamycin, cyclophosphamide (AC) followed by 4 cycles of docetaxel (D). Patients collected a faecal sample and completed a questionnaire before treatment, during AC, during D, and after completing AC-D. Chemotherapy toxicity and tumour response were determined. Intestinal microbiota was analysed by amplicon sequencing of the 16 S rRNA V4 gene-region. In total, 44 patients, including 18 neoadjuvant patients, were included, and 153 faecal samples were collected before AC-D (n = 44), during AC (n = 43), during D (n = 29), and after AC-D treatment (n = 37), 28 participants provided all four samples. In the whole group, observed species richness reduced during treatment (p = 0.042). The abundance of Proteobacteria, unclassified Enterobacterales, Lactobacillus, Ruminococcaceae NK4A214 group, Marvinbryantia, Christensenellaceae R7 group, and Ruminococcaceae UCG-005 changed significantly over time. Patients with any grade diarrhoea during docetaxel treatment had a significantly lower observed species richness compared to patients without diarrhoea. In the small group neoadjuvant treated patients, pathologic response was unrelated to baseline intestinal microbiota richness, diversity and composition. While the baseline microbiota was not predictive for pathologic response in a rather small group of neoadjuvant treated patients in our study, subsequent shifts in microbial richness, as well as the abundance of specific bacterial taxa, were observed during AC-D treatment in the whole group and the neoadjuvant group.
© 2022. The Author(s).
Conflict of interest statement
J.d.V.G. has served as a consultant for Amgen, AstraZeneca, MSD, Pierre Fabre and Servier. All outside the submitted work. J.d.V.G., M.L.S. and R.A. have received institutional research funding from Servier. All outside the submitted work. M.d.B. received research funding from Roche, Novartis, Pfizer, Eisai and AstraZeneca outside this submitted work. M.d.B. received a travel grant from Roche outside this submitted work. The other authors declare no competing financial interest. The Kootstra Talent Fellowship partly financially supported this study. K.V. acknowledges support in funding from the Dutch Province of Limburg. All authors declare no competing non-financial interests.
Figures
References
-
- Bear HD, et al. The effect on tumor response of adding sequential preoperative docetaxel to preoperative doxorubicin and cyclophosphamide: preliminary results from National Surgical Adjuvant Breast and Bowel Project Protocol B-27. J. Clin. Oncol. 2003;21:4165–4174. doi: 10.1200/JCO.2003.12.005. - DOI - PubMed
-
- Eiermann W, et al. Phase III study of doxorubicin/cyclophosphamide with concomitant versus sequential docetaxel as adjuvant treatment in patients with human epidermal growth factor receptor 2-normal, node-positive breast cancer: BCIRG-005 trial. J. Clin. Oncol. 2011;29:3877–3884. doi: 10.1200/JCO.2010.28.5437. - DOI - PubMed
-
- Puglisi F, et al. Tumor shrinkage evaluation during and after preoperative doxorubicin and cyclophosphamide followed by docetaxel in patients with breast cancer. Anticancer Res. 2004;24:2487–2493. - PubMed
LinkOut - more resources
Full Text Sources
