. 2023 Mar;93(4):870-877.
doi: 10.1038/s41390-022-02193-7. Epub 2022 Jul 29.

Decreased expression of hypoxia-inducible factor 1α (HIF-1α) in cord blood monocytes under anoxia

Affiliations

Decreased expression of hypoxia-inducible factor 1α (HIF-1α) in cord blood monocytes under anoxia

Christiane Schlegel et al. Pediatr Res. 2023 Mar.

Abstract

Background: Infections are a major cause for morbidity and mortality in neonates; however, the underling mechanisms for increased infection susceptibility are incompletely understood. Hypoxia, which is present in inflamed tissues, has been identified as an important activation signal for innate immune cells in adults and is mainly mediated by hypoxia-inducible factor 1α (HIF-1α). Fetal tissue pO2 physiologically is low but rises immediately after birth.

Methods: In this study, the effect of low oxygen partial pressure (pO2) on HIF-1α expression and its targets phagocytosis, reactive oxygen species (ROS) production and vascular endothelial growth factor (VEGF) secretion was compared in vitro between immune cells from adult peripheral blood and cord blood using anoxia, HIF-1α stabilizer desferroxamin (DFO) and E. coli as stimuli.

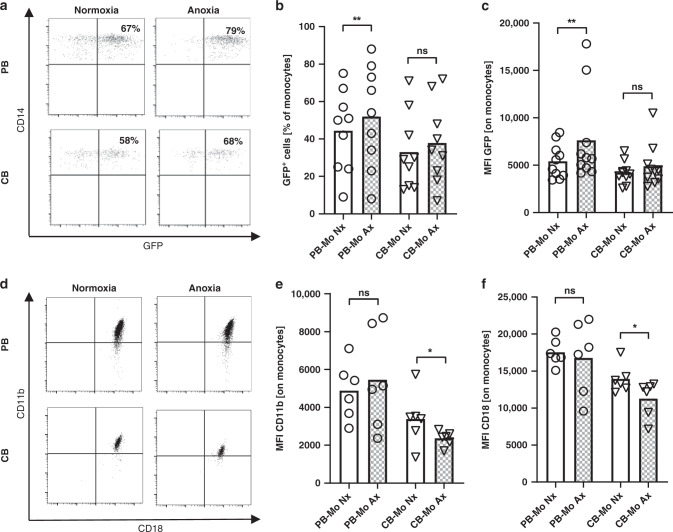
Results: We show that anoxia-induced HIF-1α protein accumulation, phagocytosis, ROS-production and VEGF-expression were greatly diminished in cord blood compared to adult cells. E. coli led to HIF-1α gene expression in adult and cord blood immune cells; however, cord blood cells failed to accumulate HIF-1α protein and VEGF upon E. coli stimulation.

Conclusions: Taken together, our results show a diminished activation of cord blood immune cells by low pO2, which might contribute to impaired reactivity in the context of infection.

Impact: Neonatal immune cells do not accumulate HIF-1α under low oxygen partial pressure leading to decreased phagocytosis and decreased ROS production. We demonstrate a previously unknown mechanism of reduced activation of neonatal immune cells in the context of an inflammatory response. This could contribute to the increased susceptibility of newborns and preterm infants to infection.


Conflict of interest statement

The authors declare no competing interests.

Figures

Fig. 1
Fig. 1. HIF-1α expression in cord blood and adult mononuclear cells under anoxia.
Peripheral blood mononuclear cells (PBMC) and cord blood mononuclear cells (CBMC) were isolated and cultured under normoxia or under anoxia for 4 (a) or 48 (b) hours. Expression of HIF-1α was analyzed on protein level via western blot and on RNA level via PCR. a Representative western blot shows expression of HIF-1α and housekeeping gene GAPDH under anoxia in PBMC (left line) and CBMC (right line). Bar plot shows HIF-1α protein expression under anoxia in western blot assessed by densitometry in PBMC and CBMC. Bars represent pooled data from 14 independent experiments and standard deviation is depicted. ****p < 0.0001; Wilcoxon matched-pairs signed rank test. b Dot plot with bars shows HIF-1α mRNA expression under normoxia and anoxia in PBMC and CBMC relative to the housekeeping gene RPL37A assessed by qPCR. Bars represent pooled data from 6 independent experiments and mean is depicted. ns not significant; Wilcoxon matched-pairs signed rank test. c Representative western blot shows expression of PHD II and housekeeping gene GAPDH under normoxia and anoxia in PBMC (left two lines) and CBMC (right two lines). Dot plot with bars shows PHD II protein expression under normoxia and anoxia in western blot assessed by densitometry in PBMC and CBMC. Bars represent pooled data from 7 to 9 independent experiments and mean is depicted. ns not significant; Kruskal–Wallis test.
Fig. 2
Fig. 2. Phagocytosis rates and expression of phagocytosis receptors of cord blood and adult monocytes under anoxia.
Peripheral blood mononuclear cells (PBMC) and cord blood mononuclear cells (CBMC) were isolated and cultured under normoxia or under anoxia for four hours. ac Afterwards, GFP-expressing E. coli (E. coli-GFP) were added to the culture for 1 h. a Representative density plots show the expression of GFP in CD14+ adult monocytes (upper plots) and cord blood monocytes (lower plots) in the upper right quadrant after culture in normoxia (left plots) or anoxia (right plots). b, c Dot plots with bars show the percentages of GFP expressing monocytes (b) and the mean fluorescent intensity (MFI) for GFP expression in monocytes (c) after culture in normoxia (blank bars) or in anoxia (checked bars). d Representative density plots show the expression of CD18 (x-axis) and CD11b (y-axis) on CD14+ adult (upper plots) and cord blood (lower plots) monocytes. e, f Dot plots with bars show expression of CD11b (e) and CD18 (f) on monocytes cultured under normoxia (blank bars) and under anoxia (checked bars). Bars represent pooled data from 6 to 10 independent experiments and mean is depicted. **p < 0.01, *p < 0.05, ns not significant; Wilcoxon matched-pairs signed rank test.
Fig. 3
Fig. 3. ROS production of cord blood and adult monocytes under anoxia.
Peripheral blood mononuclear cells (PBMC) and cord blood mononuclear cells (CBMC) were isolated and cultured under normoxia or under anoxia for four hours. Afterwards, ROS production was detected by Dihydrorhodamine (DHR). a Representative density plots show the expression of Rhodamine in CD14+ adult monocytes (upper plots) and cord blood monocytes (lower plots) in the upper right quadrant after culture in normoxia (left plots) or anoxia (right plots). b, c Dot plots with bars show the percentages of Rhodamine+ monocytes (b) and the mean fluorescent intensity (MFI) for Rhodamine in monocytes (c) after culture in normoxia (blank bars) or in anoxia (checked bars). Bars represent pooled data from 5 independent experiments and mean is depicted. *p < 0.05, ns not significant; Wilcoxon matched-pairs signed rank test.
Fig. 4
Fig. 4. Phagocytosis and ROS production of cord blood and adult monocytes after stimulation with deferoxamine.
Peripheral blood mononuclear cells (PBMC) and cord blood mononuclear cells (CBMC) were isolated and cultured under normoxia or under anoxia for four hours. ac Afterwards, GFP-expressing E. coli (E. coli-GFP) were added to the culture for 1 h. a Representative density plots show the expression of GFP in CD14+ adult monocytes (upper plots) and cord blood monocytes (lower plots) in the upper right quadrant (left plots) without stimulation or after stimulation with deferoxamine (DFO) (right plots). b, c Dot plots with bars show the percentages of GFP expressing monocytes (b) and the mean fluorescent intensity (MFI) for GFP-expression in monocytes (c) without stimulation (blank bars) or after stimulation with DFO (checked bars). df ROS production was detected by Dihydrorhodamine (DHR). d Representative density plots show the expression of Rhodamine in CD14+ adult monocytes (upper plots) and cord blood monocytes (lower plots) in the upper right quadrant without stimulation (left plots) or after stimulation with DFO (right plots). e, f Dot plots with bars show the percentages of Rhodamine+ monocytes (b) and the mean fluorescent intensity (MFI) for Rhodamine in monocytes (c) without stimulation (blank bars) or after stimulation with DFO (checked bars). Bars represent pooled data from 6 independent experiments and mean is depicted. *p < 0.05, ns not significant; Wilcoxon matched-pairs signed rank test.
Fig. 5
Fig. 5. VEGF production of cord blood and adult mononuclear cells under anoxia.
Peripheral blood mononuclear cells (PBMC) and cord blood mononuclear cells (CBMC) were isolated and cultured under normoxia or under anoxia for 16–22 h. Expression of VEGF in supernatants was analyzed by ELISA. Dot plot with bars shows VEGF protein in supernatants of adult (white bars) and cord blood (gray bars) mononuclear cells cultured under normoxia (blank bars) or under anoxia (checked bars). Bars represent pooled data from 5 independent experiments and mean is depicted. *p < 0.05; Wilcoxon matched-pairs signed rank test.

Similar articles

Cited by

References

    1. Kostlin-Gille N, et al. Epidemiology of early and late onset neonatal sepsis in very low birthweight infants: data from the German Neonatal Network. Pediatr. Infect. Dis. J. 2021;40:255–259. doi: 10.1097/INF.0000000000002976. - DOI - PubMed
    1. Dowling DJ, Levy O. Ontogeny of early life immunity. Trends Immunol. 2014;35:299–310. doi: 10.1016/j.it.2014.04.007. - DOI - PMC - PubMed
    1. Taylor CT, Colgan SP. Regulation of immunity and inflammation by hypoxia in immunological niches. Nat. Rev. Immunol. 2017;17:774–785. doi: 10.1038/nri.2017.103. - DOI - PMC - PubMed
    1. Cramer T, Johnson RS. A novel role for the hypoxia inducible transcription factor Hif-1alpha: critical regulation of inflammatory cell function. Cell Cycle. 2003;2:192–193. doi: 10.4161/cc.2.3.402. - DOI - PubMed
    1. Lewis JS, Lee JA, Underwood JC, Harris AL, Lewis CE. Macrophage responses to hypoxia: relevance to disease mechanisms. J. Leukoc. Biol. 1999;66:889–900. doi: 10.1002/jlb.66.6.889. - DOI - PubMed

Publication types

Substances