

doi: 10.1038/s41598-022-16557-w.
KOPI: Kinase inhibitOr Proteome Impact analysis
Affiliations
- PMID: 35906361
- PMCID: PMC9338059
- DOI: 10.1038/s41598-022-16557-w
Item in Clipboard
KOPI: Kinase inhibitOr Proteome Impact analysis
Sci Rep.
.
Abstract
Kinase inhibitors often exert on/off-target effects, and efficient data analysis is essential for assessing these effects on the proteome. We developed a workflow for rapidly performing such a proteomic assessment, termed as kinase inhibitor proteome impact analysis (KOPI). We demonstrate KOPI's utility with staurosporine (STS) on the leukemic K562 cell proteome. We identified systematically staurosporine's non-kinome interactors, and showed for the first time that it caused paradoxical hyper- and biphasic phosphorylation.
© 2022. The Author(s).
Conflict of interest statement
The authors declare no competing interests.
Figures
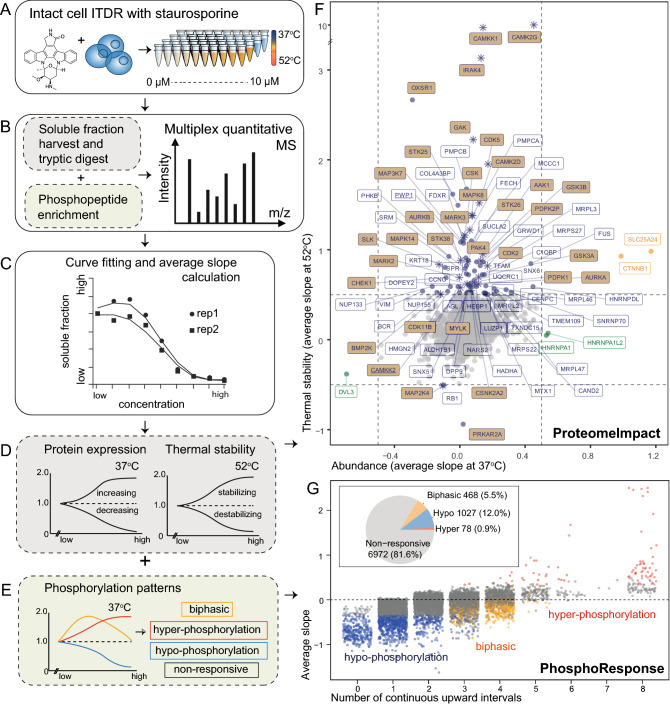
Kinase inhibitor proteome impact analysis (KOPI) workflow and outputs. (A) The cell line is treated with kinase inhibitor/s at different concentrations under normal (37 °C) temperature and a heat challenge (52 °C). (B) The soluble fraction is harvested for tryptic digestion and multiplexed for quantitative mass spectrometry. (C) The fold changes relative to the untreated are fitted with a smoothing curve. (D) The average slope per curve is calculated to indicate the proteins’ response to drug treatment. The same analysis is performed on the enriched phospho-peptides to quantify the phosphoproteome’s response. (E) Each phosphosite was sorted into 4 possible responses based on the trend of their curves. The results are represented as the (F) ProteomeImpact and the (G) Phospho-Response. (F) ProteomeImpact: the average slope of each protein’s dose–response at 37 °C and 52 °C. Proteins with the average slope value on either axis larger than 0.5 are annotated, with kinases in beige. Stars represent common hits between this publication and Savitski et al. (G) PhosphoResponse: phosphopeptides are plotted against their number of continuous upward intervals (x-axis) and average slope under 37 °C (y-axis). Response categories: hypo-(blue), hyper-phosphorylation (red), biphasic (yellow) and non-responsive (grey). The pie chart indicates global proportions.
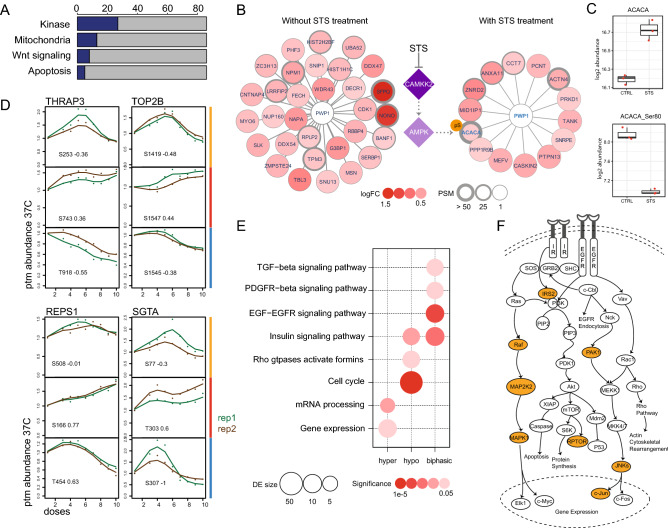
Impact of STS on the non-kinome and phosphoproteome. (A) The number of hits identified as kinases, and/or localized to the mitochondria, related to Wnt signaling and/or apoptosis. (B) Changes in PWP1 protein complex upon STS treatment as analysed by MS-immunoprecipitation. Hit proteins are defined by average log2 fold change (logFC) < − 0.5 or > 0.5, adjusted p-value < 0.05, from three replicates. PSM (number of peptide-spectra match per protein). CAMKK2 and AMPK were identified in the ProteomeImpact experiment (Fig. 1F), with CAMKK2 identified as a direct interactor of STS (solid purple fill). Known regulation of AMPK by CAMKK2– (as indicated by the faint purple fill and dotted lines). (C) Log 2 abundance intensity of the total protein (ACACA) and its phosphosite ACACA-Ser80 with (STS) and without (CTRL) treatment. (D) Phosphopeptide response curves for four proteins with all three response patterns: thyroid hormone receptor-associated protein 3 (THRAP3), DNA topoisomerase 2-beta (TOP2B), RalBP1-associated Eps domain-containing protein 1 (REPS1), small glutamine-rich tetratricopeptide repeat-containing protein alpha (SGTA). The doses were represented as ordinal numbers, with the highest dose 10.0 µM at position number 10 (x-axis). The ptm (post-translation modification) abundance 37C (y-axis) represents the abundance fold change relative to the untreated condition. Coloured bars indicate biphasic (yellow), hyper-phosphorylation (red) and hypo-phosphorylation (blue), green and brown lines represent two biological replicates. (E) Differential phosphosites are clustered by biological processes involved. DE size (differential expression size), significance (enrichment significance). (F) Signaling network of epidermal growth factor receptor (EGFR) and insulin receptor (IR). Proteins with biphasic phosphorylation response in this pathway (shaded yellow).
References
Publication types
MeSH terms
Substances
LinkOut - more resources
Full Text Sources
Molecular Biology Databases
