

Validation and advantages of using novel RT-qPCR melting curve analysis assays for the identification of SARS-CoV-2 variants
- PMID: 35906388
- PMCID: PMC9338320
- DOI: 10.1038/s41598-022-17339-0
Validation and advantages of using novel RT-qPCR melting curve analysis assays for the identification of SARS-CoV-2 variants
Abstract
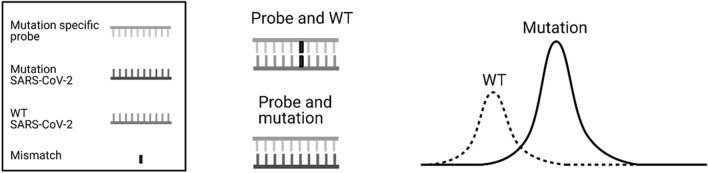
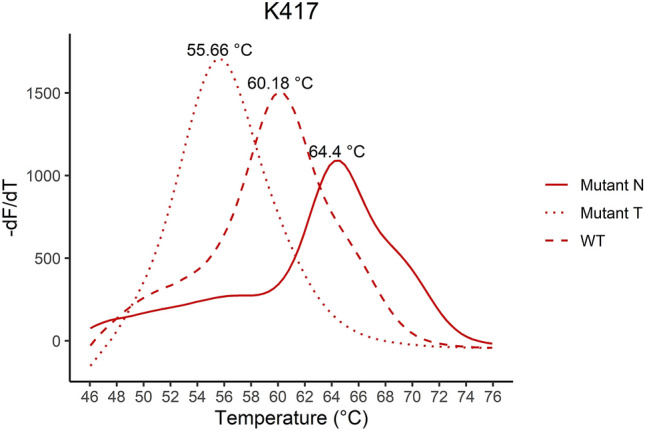
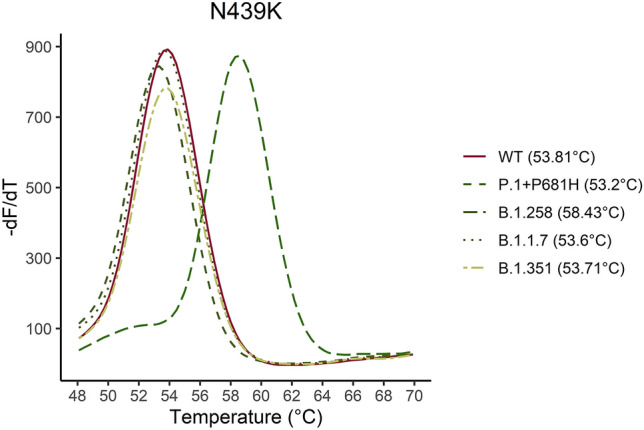
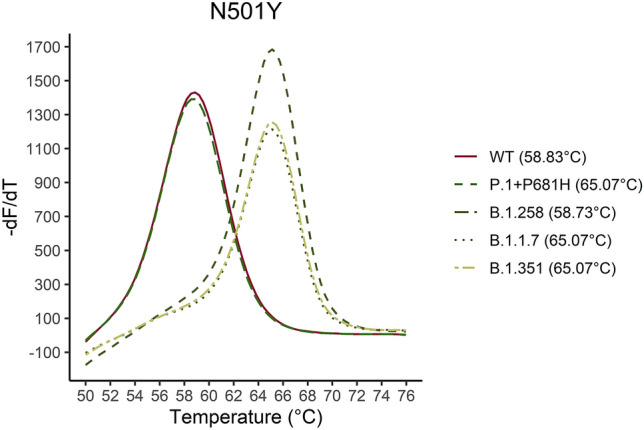
Reverse transcription quantitative PCR (RT-qPCR) assays are gold standard in diagnosing SARS-CoV-2 infection and play a major role in viral subtyping for rapid detection and monitoring of important mutations, containing the spread of new virus variants. We wanted to compare RT-qPCR melting curve analysis assays to Sanger Sequencing for detection of variants within the SARS-CoV-2 spike glycoprotein and examined their sensitivity and specificity. Samples positive for SARS-CoV-2 (n = 663 + 82) were subtyped using both Sanger sequencing and five RT-qPCR melting curve analysis assays specific for the mutations N501Y, P681H, E484K, K417N/T, and N439K. The results of the two methods were compared. The training cohort and the clinical validation cohort showed equally, or significantly better sensitivity of the assays compared to the Sanger sequencing. The agreement of the Sanger sequencing and the assays ranged from 92.6 to 100% for the training cohort and 99.4-100% for the clinical validation. The sensitivity, specificity, and turn-around time of the RT-qPCR melting curve analysis assays are well-suited for clinical monitoring of VOCs, making the assays an important tool in contact tracing and risk stratification. Furthermore, the assays were able to indicate the presence of new mutations in the complementary sequence to the mutation-specific probes.
© 2022. The Author(s).
Conflict of interest statement
SJ, RKP, NVH, KKF, and UBC are employees of PentaBase A/S. The CoviDetect™ Variant assays are now part of a marketed product portfolio of PentaBase A/S. MRS, MNP, LFH, HL, PBJ had no conflict of interests.
Figures
Similar articles
-
RT-qPCR Assays for Rapid Detection of the N501Y, 69-70del, K417N, and E484K SARS-CoV-2 Mutations: A Screening Strategy to Identify Variants With Clinical Impact.Front Cell Infect Microbiol. 2021 May 20;11:672562. doi: 10.3389/fcimb.2021.672562. eCollection 2021. Front Cell Infect Microbiol. 2021. PMID: 34123874 Free PMC article.
-
Real-Time RT-PCR Allelic Discrimination Assay for Detection of N501Y Mutation in the Spike Protein of SARS-CoV-2 Associated with B.1.1.7 Variant of Concern.Microbiol Spectr. 2022 Feb 23;10(1):e0068121. doi: 10.1128/spectrum.00681-21. Epub 2022 Feb 16. Microbiol Spectr. 2022. PMID: 35170989 Free PMC article.
-
Emergency SARS-CoV-2 Variants of Concern: Novel Multiplex Real-Time RT-PCR Assay for Rapid Detection and Surveillance.Microbiol Spectr. 2022 Feb 23;10(1):e0251321. doi: 10.1128/spectrum.02513-21. Epub 2022 Feb 23. Microbiol Spectr. 2022. PMID: 35196812 Free PMC article.
-
Rapid and Flexible RT-qPCR Surveillance Platforms To Detect SARS-CoV-2 Mutations.Microbiol Spectr. 2023 Feb 14;11(1):e0359122. doi: 10.1128/spectrum.03591-22. Epub 2023 Jan 9. Microbiol Spectr. 2023. PMID: 36625603 Free PMC article.
-
Molecular biology of SARS-CoV-2 and techniques of diagnosis and surveillance.Adv Clin Chem. 2024;118:35-85. doi: 10.1016/bs.acc.2023.11.003. Epub 2023 Dec 14. Adv Clin Chem. 2024. PMID: 38280807 Review.
Cited by
-
ACE2 and TMPRSS2 in human kidney tissue and urine extracellular vesicles with age, sex, and COVID-19.Pflugers Arch. 2025 Jan;477(1):83-98. doi: 10.1007/s00424-024-03022-y. Epub 2024 Oct 9. Pflugers Arch. 2025. PMID: 39382598 Free PMC article.
-
Prospective clinical performance of CoVarScan in identifying SARS-CoV-2 Omicron subvariants.Microbiol Spectr. 2025 Jan 7;13(1):e0138524. doi: 10.1128/spectrum.01385-24. Epub 2024 Dec 11. Microbiol Spectr. 2025. PMID: 39660915 Free PMC article.
-
Two-Stage Mixed-Dye-Based Isothermal Amplification with Ribonuclease-Cleavable Enhanced Probes for Dual-Visualization Detection of SARS-CoV-2 Variants of Interest.Adv Sci (Weinh). 2024 Aug;11(29):e2401988. doi: 10.1002/advs.202401988. Epub 2024 Jun 3. Adv Sci (Weinh). 2024. PMID: 38829265 Free PMC article.
-
Rapid and Accurate Detection of the SARS-CoV-2 Omicron Variant with a CRISPR-Cas12a Reaction in the RT-qPCR Pot.ACS Omega. 2024 Apr 11;9(16):18046-18050. doi: 10.1021/acsomega.3c09717. eCollection 2024 Apr 23. ACS Omega. 2024. PMID: 38680362 Free PMC article.
References
-
- Wu Z, McGoogan JM. Characteristics of and important lessons from the coronavirus disease 2019 (COVID-19) outbreak in China: Summary of a report of 72314 cases from the Chinese Center for Disease Control and Prevention. JAMA-J. Am. Med. Assoc. 2020;323(13):1239–1242. doi: 10.1001/jama.2020.2648. - DOI - PubMed
MeSH terms
Supplementary concepts
LinkOut - more resources
Full Text Sources
Medical
Miscellaneous
