. 2022 Jul 29;12(1):13046.
doi: 10.1038/s41598-022-17477-5.

Upregulation of the hypothalamo-neurohypophysial system and activation of vasopressin neurones attenuates hyperalgesia in a neuropathic pain model rat

Affiliations

Upregulation of the hypothalamo-neurohypophysial system and activation of vasopressin neurones attenuates hyperalgesia in a neuropathic pain model rat

Kazuhiko Baba et al. Sci Rep. .

Abstract

Arginine vasopressin (AVP) is a hypothalamic neurosecretory hormone well known as an antidiuretic, and recently reported to be involved in pain modulation. The expression kinetics of AVP and its potential involvement in the descending pain modulation system (DPMS) in neuropathic pain (NP) remains unclear. We investigated AVP expression and its effects on mechanical and thermal nociceptive thresholds using a unilateral spinal nerve ligation (SNL) model. All rats with SNL developed NP. Intensities of enhanced green fluorescent protein (eGFP) in the supraoptic and paraventricular nuclei, median eminence, and posterior pituitary were significantly increased at 7 and 14 days post-SNL in AVP-eGFP rats. In situ hybridisation histochemistry revealed significantly increased AVP mRNA expression at 14 days post-SNL compared with the sham control group. The chemogenetic activation of AVP neurones significantly attenuated mechanical and thermal hyperalgesia with elevated plasma AVP concentration. These analgesic effects were suppressed by pre-administration with V1a receptor antagonist. AVP neurones increased the neuronal activity of serotonergic dorsal raphe, noradrenergic locus coeruleus, and inhibitory interneurones in the spinal dorsal horn. These results suggest that the hypothalamo-neurohypophysial system of AVP is upregulated in NP and activated endogenous AVP exerts analgesic effects via the V1a receptors. AVP neurones may activate the DPMS.


Conflict of interest statement

The authors declare no competing interests.

Figures
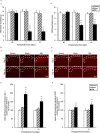
Figure 1
Figure 1
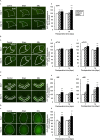
SNL induces mechanical and thermal hyperalgesia and increases the number of Iba-1 and GFAP-positive cells in the L5 ipsilateral dorsal horn at day 7 and 14 after SNL in AVP-eGFP Tg rats. (A) The change of mechanical and thermal nociceptive threshold. (a) Mean values of withdrawal thresholds to von Frey hair stimulation of the ipsilateral hind paw at the baseline (BL) on days 7 and 14 after SNL operation in Control, Sham surgery, and SNL rats. (b) Mean value of withdrawal latency to thermal stimulation of the ipsilateral hind paw at the BL and days 7 and 14 after SNL operation. (B) Change in ionised calcium-binding adapter molecule 1(Iba-1)-positive cells in the lumbar segment 5 (L5) ipsilateral dorsal horn. (a,b) Digital image of Iba-1-positive cells in the L5 ipsilateral dorsal horn and the average Alexa 546 fluorescence intensity in Iba-1 positive cells in laminae I–II. (C) Change in glial fibrillary acidic protein (GFAP)-positive cells. (a,b) Digital image of GFAP-positive cells in the L5 ipsilateral dorsal horn and the average Alexa 546 fluorescence intensity in GFAP-positive cells in laminae I–II. Sections were obtained from Control, Sham, and SNL groups on days 7 and 14 after SNL surgery. The area surrounded by a white dotted line indicates the layer of laminae I–II. Data are presented as the mean ± SEM (one-way ANOVA). n = 5–6 per group. **p < 0.01 compared with each Control experiment. ††p < 0.01 compared to Sham group.
Figure 2
Figure 2
SNL increases intensities of AVP-eGFP fluorescence in SON, PVN, ME, and PP at day 7 and 14 after SNL. (A) (a) Fluorescence microscopic images of arginine vasopressin (AVP)-enhanced green fluorescent protein (eGFP) in the supraoptic nucleus (SON), where the region surrounded by a white dotted line indicates the SON. (b) Average eGFP fluorescence intensities of the SON. (B) (a) Fluorescence microscopic images of AVP-eGFP in the paraventricular nucleus (PVN), where the regions surrounded by the white dotted line and a white solid line indicate the parvocellular PVN (pPVN) and magnocellular PVN (mPVN), respectively. Average eGFP fluorescence intensities of (b) the pPVN and (c) mPVN. (C) (a) Fluorescence microscopic images of AVP-eGFP in the median eminence (ME), where the regions surrounded by a white dotted line and a white solid line indicate the inner ME (iME) and outer ME (oME), respectively; (b) and (c) present the average eGFP fluorescence intensities of the iME and oME, respectively. (D) (a) Fluorescence microscopic images of AVP-eGFP in the posterior pituitary (PP), where the region surrounded by a white dotted line indicates the PP. (b) Average eGFP fluorescence intensities of the PP. Data are presented as the mean ± SEM (one-way ANOVA). n = 6 per group. *p < 0.05 and **p < 0.01 compared with each Control experiment. p < 0.05 and ††p < 0.01 compared with each Sham experiment.
Figure 3
Figure 3
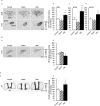
SNL increases the gene expression of AVP and POMC and decreases CRH mRNA levels at day 14 after SNL. (A) (a) Expression levels of arginine vasopressin (AVP) mRNA in the supraoptic nucleus (SON) and paraventricular nucleus (PVN). Regions surrounded by the black and white dotted lines and black solid line indicate the SON, the parvocellular PVN (pPVN) and the magnocellular PVN (mPVN), respectively. AVP mRNA probe binding (% of control) in (b) the SON, (c) pPVN, and (d) mPVN. (B) (a) Expression level of corticotrophin-releasing hormone (CRH) mRNA in the pPVN. Region surrounded by a white dotted line indicates the pPVN. (b) CRH mRNA probe binding (% of control) in the pPVN. (C) (a) Expression level of proopiomelanocortin (POMC) mRNA in the anterior pituitary (AP). Region surrounded by the black dotted line indicates the AP. (b) POMC mRNA probe binding (% of control) in AP. Data are presented as the mean ± SEM (one-way ANOVA). n = 5–7 in each group. *p < 0.05 and **p < 0.01 compared with each Control experiment. p < 0.05 and ††p < 0.01 compared with each Sham experiment.
Figure 4
Figure 4
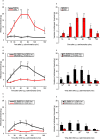
Mechanical and thermal nociceptive thresholds were elevated at 90 min after CNO administration in AVP-hM3Dq-mCherry Tg rats. Changes in (A) (a) mechanical and (B) (a) thermal nociceptive thresholds after the SNL procedure. (A) (b) Mechanical nociceptive threshold 90 min after CNO or saline intraperitoneal (i.p.) injection in each group. (B) (b) Thermal nociceptive threshold 90 min after CNO or saline i.p. injection in each group. (C) Plasma arginine vasopressin (AVP) concentration. Data are presented as the mean ± SEM (Student’s t-test). n = 6 per group. *p < 0.05 and **p < 0.01 compared with each Saline experiment.
Figure 5
Figure 5
Time course of mechanical nociceptive threshold in AVP-hM3Dq-mCherry Tg rats after CNO administration and effect of the AVP V1a receptor antagonist. (A) (a) Time course and (b) variation of mechanical nociceptive threshold after CNO intraperitoneal (i.p.) injection. Data are presented as the mean ± SEM (Student’s t-test). *p < 0.05 and **p < 0.01 compared with each Saline experiment. (B) (a) Time course and (b) variation of mechanical nociceptive threshold after CNO i.p. injection with SR49059 pre-treatment or 5% DMSO i.p. injection. (C) (a) Time course and (b) variation of mechanical nociceptive threshold after CNO i.p. injection with SR49059 pre-treatment or 5% DMSO intrathecal (i.t.) injection. Data are presented as the mean ± SEM (Student’s t-test). n = 5–6 in each group. *p < 0.05 and **p < 0.01 compared with each 5% DMSO experiment.
Figure 6
Figure 6
Time course of thermal nociceptive threshold in AVP-hM3Dq-mCherry Tg rats after CNO administration and effect of the AVP V1a receptor antagonist. (A) (a) Time course and (b) variation of thermal nociceptive threshold after CNO or saline intraperitoneal (i.p.) injection. Data are presented as the mean ± SEM (Student’s t-test). *p < 0.05 and **p < 0.01 compared with each Saline experiment. (B) (a) Time course and (b) variation of thermal nociceptive threshold after CNO i.p. injection with SR49059 pre-treatment or 5% DMSO i.p. injection. (C) (a) Time course and (b) variation of thermal nociceptive threshold after CNO i.p. injection with SR49059 pre-treatment or 5% DMSO intrathecal (i.t.) injection. Data are presented as the mean ± SEM (Student’s t-test). n = 5–6 in each group. *p < 0.05 and **p < 0.01 compared with each 5% DMSO experiment.
Figure 7
Figure 7
AVP neurones activate serotonergic neurones in the DR, noradrenergic neurones in the LC and PAX-2 positive interneurones of the spinal dorsal horn. (A) Time course of (a) mechanical and (b) thermal nociceptive threshold after CNO or saline intraperitoneal (i.p.) injection. Data are presented as the mean ± SEM (Student’s t-test). *p < 0.05 and **p < 0.01 compared with each Saline experiment. (B) (a) Fluorescence microscopic images of tryptophan hydroxylase (TPH)-ir (green) and Fos-ir (red) positive neurones in the dorsal raphe (DR). (b) The number of TPH-ir and Fos-ir positive neurones in the DR. Data are presented as the mean ± SEM (Student’s t-test). *p < 0.05 and **p < 0.01 compared with each Saline. (C) (a) Fluorescence microscopic images of tyrosine hydroxylase (TH)-ir (green) and Fos-ir (red) positive neurones in the locus coeruleus (LC). The number of TH-ir and Fos-ir positive neurones in the LC. Data are presented as the mean ± SEM (Student’s t-test). **p < 0.01 compared with Saline. The fluorescence microscopic images of paired box gene-2 (PAX-2)-ir (red) and Fos-ir (green) positive cells in the lumber segment 5 (L5) ipsilateral dorsal horn. (b) The number of PAX-2-ir and Fos-ir positive cells in the L5 spinal dorsal horn. Data are presented as the mean ± SEM (Student’s t-test). n = 6 in each group. **p < 0.01 compared with Saline.

Similar articles

Cited by

References

    1. Brown CH, Bains JS, Ludwig M, Stern JE. Physiological regulation of magnocellular neurosecretory cell activity: Integration of intrinsic, local and afferent mechanisms. J. Neuroendocrinol. 2013;25:678–710. doi: 10.1111/jne.12051. - DOI - PMC - PubMed
    1. Cuzzo B, Padala SA, Lappin SL. StatPearls. StatPearls Publishing © 2021, StatPearls Publishing LLC; 2021.
    1. Berson BS, Berntson GG, Zipf W, Torello MW, Kirk WT. Vasopressin-induced antinociception: An investigation into its physiological and hormonal basis. Endocrinology. 1983;113:337–343. doi: 10.1210/endo-113-1-337. - DOI - PubMed
    1. Kordower JH, Bodnar RJ. Vasopressin analgesia: Specificity of action and non-opioid effects. Peptides. 1984;5:747–756. doi: 10.1016/0196-9781(84)90017-2. - DOI - PubMed
    1. Thurston CL, Campbell IG, Culhane ES, Carstens E, Watkins LR. Characterization of intrathecal vasopressin-induced antinociception, scratching behavior, and motor suppression. Peptides. 1992;13:17–25. doi: 10.1016/0196-9781(92)90135-p. - DOI - PubMed

Publication types