

Combining multi-marker metabarcoding and digital holography to describe eukaryotic plankton across the Newfoundland Shelf
- PMID: 35906469
- PMCID: PMC9338326
- DOI: 10.1038/s41598-022-17313-w
Combining multi-marker metabarcoding and digital holography to describe eukaryotic plankton across the Newfoundland Shelf
Erratum in
-
Publisher Correction: Combining multi-marker metabarcoding and digital holography to describe eukaryotic plankton across the Newfoundland Shelf.Sci Rep. 2022 Oct 6;12(1):16739. doi: 10.1038/s41598-022-20894-1. Sci Rep. 2022. PMID: 36202845 Free PMC article. No abstract available.
Abstract
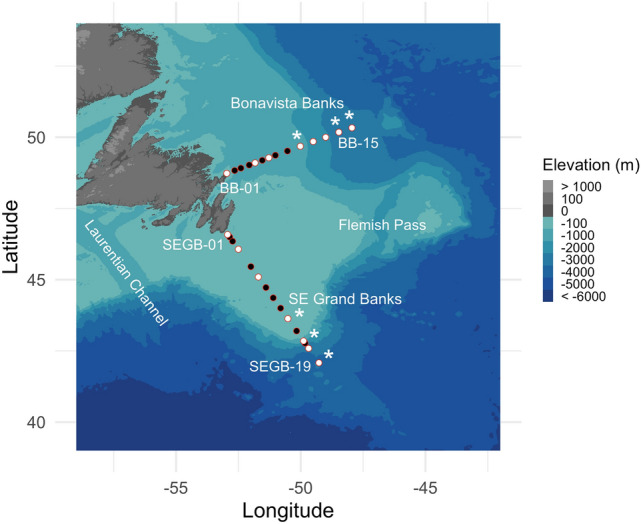
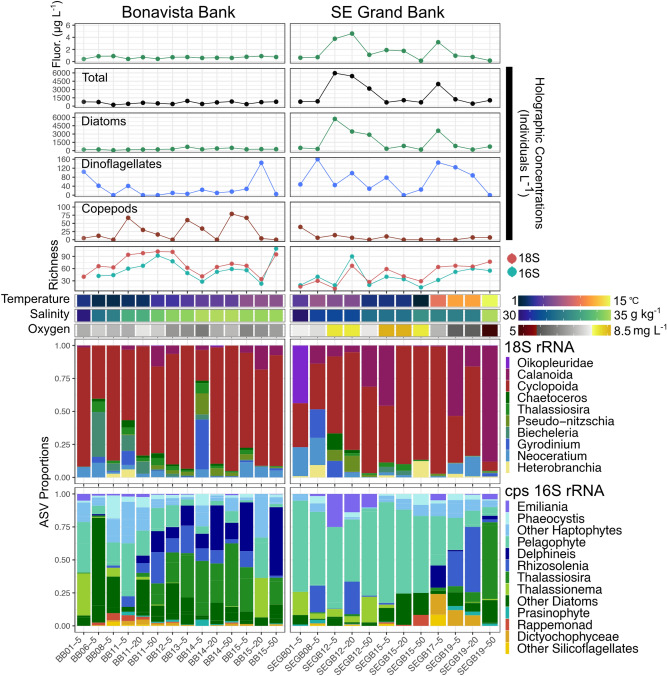
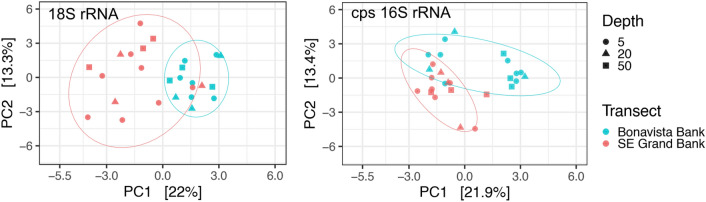
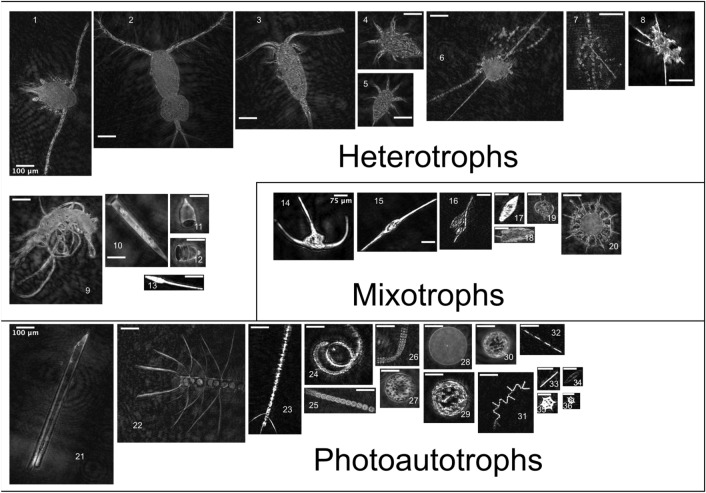
The planktonic diversity throughout the oceans is vital to ecosystem functioning and linked to environmental change. Plankton monitoring tools have advanced considerably with high-throughput in-situ digital cameras and genomic sequencing, opening new challenges for high-frequency observations of community composition, structure, and species discovery. Here, we combine multi-marker metabarcoding based on nuclear 18S (V4) and plastidial 16S (V4-V5) rRNA gene amplicons with a digital in-line holographic microscope to provide a synoptic diversity survey of eukaryotic plankton along the Newfoundland Shelf (Canada) during the winter transition phase of the North Atlantic bloom phenomenon. Metabarcoding revealed a rich eukaryotic diversity unidentifiable in the imaging samples, confirming the presence of ecologically important saprophytic protists which were unclassifiable in matching images, and detecting important groups unobserved or taxonomically unresolved during similar sequencing campaigns in the Northwest Atlantic Ocean. In turn, imaging analysis provided quantitative observations of widely prevalent plankton from every trophic level. Despite contrasting plankton compositions portrayed by each sampling method, both capture broad spatial differences between the northern and southern sectors of the Newfoundland Shelf and suggest complementary estimations of important features in eukaryotic assemblages. Future tasks will involve standardizing digital imaging and metabarcoding for wider use and consistent, comparable ocean observations.
© 2022. The Author(s).
Conflict of interest statement
The authors declare no competing interests.
Figures
References
-
- Lombard F, et al. Consistent quantitative observations of planktonic ecosystems. Front. Mar. Sci. 2019;6:196. doi: 10.3389/fmars.2019.00196. - DOI
-
- Sieracki, M. E., et al. Optical plankton imaging and analysis systems for ocean observation. Proceedings of OceanObs’09: Sustained Ocean Observations and Information for Society, 878–885 (2010). 10.5270/OceanObs09.cwp.81.
-
- Mars Brisbin M, Brunner OD, Grossmann MM, Mitarai S. Paired high-throughput, in situ imaging and high-throughput sequencing illuminate acantharian abundance and vertical distribution. Limnol. Oceanogr. 2020;65(12):2953–2965. doi: 10.1002/lno.11567. - DOI
-
- Benfield M, et al. RAPID: Research on automated plankton identification. Oceanography. 2007;20(2):172–187. doi: 10.5670/oceanog.2007.63. - DOI
Publication types
MeSH terms
Associated data
LinkOut - more resources
Full Text Sources
