

Geographical disparities in obesity prevalence: small-area analysis of the Chilean National Health Surveys
- PMID: 35906592
- PMCID: PMC9335969
- DOI: 10.1186/s12889-022-13841-2
Geographical disparities in obesity prevalence: small-area analysis of the Chilean National Health Surveys
Abstract
Background: Previous representative health surveys conducted in Chile evidenced a high obesity prevalence rate among adults, especially in female and urban areas. Nevertheless, these have limited utility for targeted interventions and local source allocation for prevention. This study analyzes the increments in obesity prevalence rates in populations ≥15 years of age and the geographic variation at the regional level. We also assessed whether the obesity rates have different patterns on a smaller geographic level than national and regional ones.
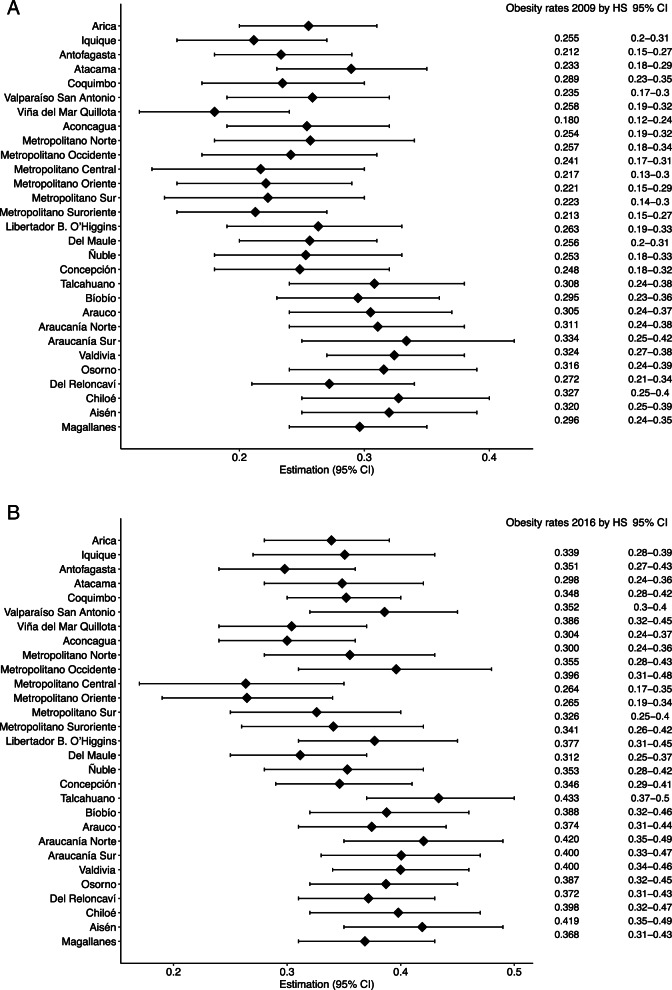
Methods: This ecological study analyzed data from two representative national samples of adolescents and adults ≥15 years old, who participated in the last Chilean health surveys, 2009 (n = 5412) and 2016 (n = 6233). Obesity (body mass index≥30 kg/m2) rates were calculated on the national, regional, and Health service (HS) levels, being HS the smallest unit of analysis available. Obesity rates and relative increase to early identify target populations and geographic areas, with 95% confidence intervals (95% CI), were calculated using the sampling design of the national surveys, at the national and regional level, and by gender, age groups, and socioeconomic status. The Fay-Herriot (FH) models, using auxiliary data, were fitted for obesity rate estimates at the HS level.
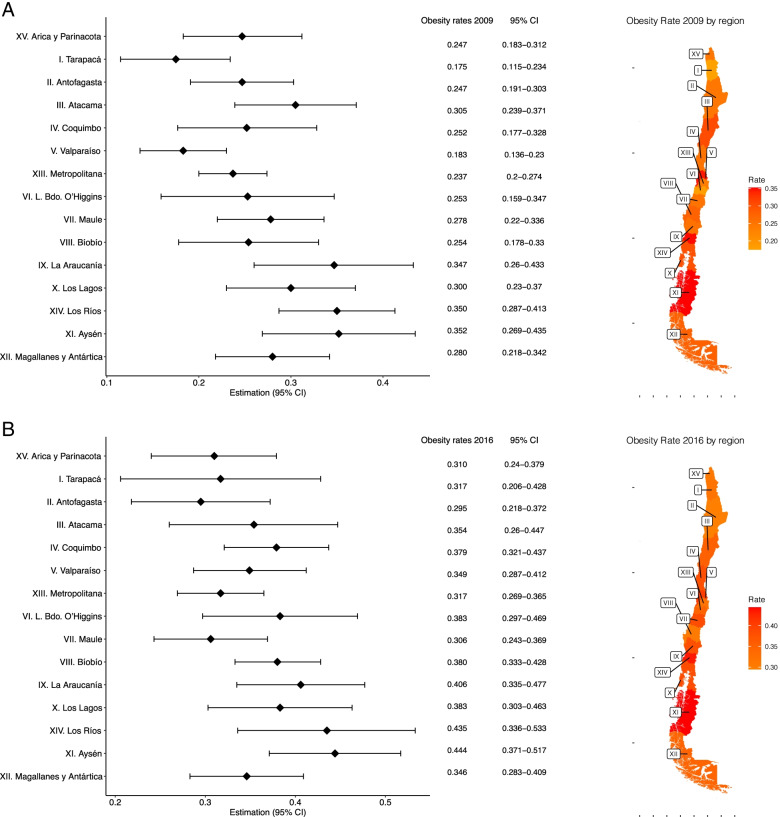
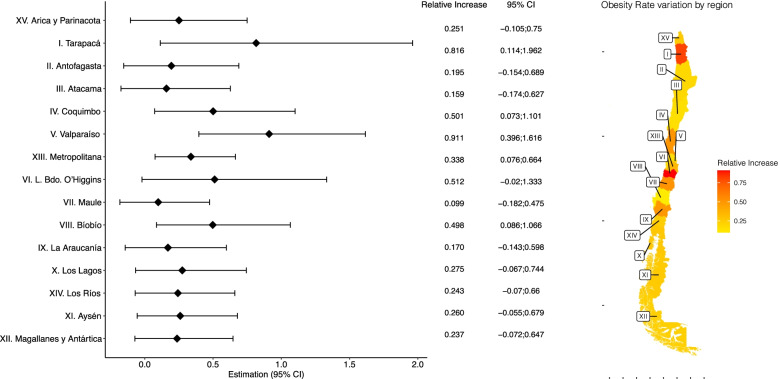
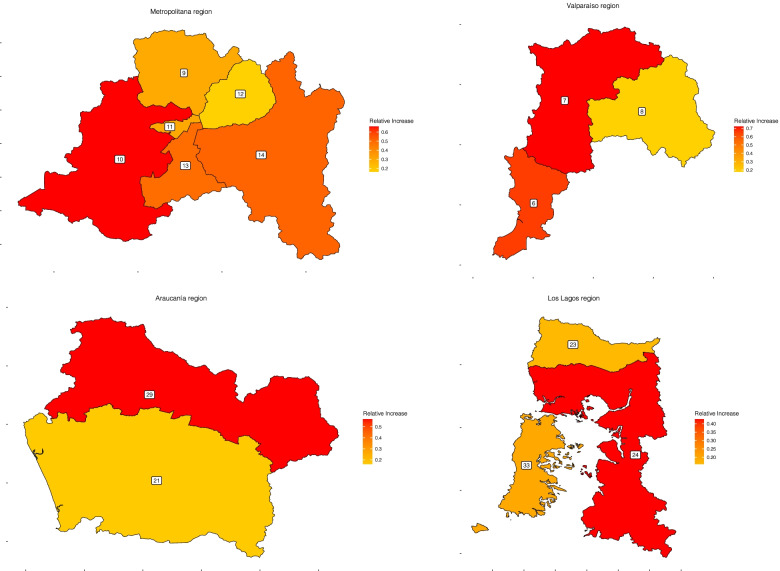
Results: The relative increase in obesity rate was 37.1% (95%CI 23.3-52.9) at the national level, with a heterogeneous geographic distribution at the regional one. Southern regions had the highest obesity rates in both surveys (Aysén: 35.2, 95%CI 26.9-43.5 in 2009, 44.3 95%CI 37-51.7 in 2016), but higher increases were predominantly in the northern and central areas of the country (relative increase 91.1 95%CI 39.6-110.1 in Valparaiso and 81.6 95%CI 14.4-196.2 in Tarapacá). Obesity rates were higher in females, older age, and lower socioeconomic groups; nevertheless, relative increases were higher in the opposite ones. The FH estimates showed an obesity rates variation at the HS level, where higher rates tend to converge to specific HS areas of each region.
Conclusion: Obesity rates and relative increase are diverse across subnational levels and substantially differ from the national estimates, highlighting a pattern that converges to areas with low-middle income households. Our results emphasize geographical disparities in obesity prevalence among adults and adolescents.
Keywords: Geographic variation; Low-middle income households; Obesity; Small-area analysis.
© 2022. The Author(s).
Conflict of interest statement
The authors declare no conflict of interest.
Figures
References
-
- Li Z, Hsiao Y, Godwin J, Martin BD, Wakefield J, Clark SJ, et al. Changes in the spatial distribution of the under-five mortality rate: small-area analysis of 122 DHS surveys in 262 subregions of 35 countries in Africa. PLoS One. 2019;14(1):e0210645. doi: 10.1371/journal.pone.0210645. - DOI - PMC - PubMed
Publication types
MeSH terms
LinkOut - more resources
Full Text Sources
Medical
Miscellaneous
