. 2022 Jul 30;14(14):5641-5668.
doi: 10.18632/aging.204196. Epub 2022 Jul 30.

Aging the brain: multi-region methylation principal component based clock in the context of Alzheimer's disease

Affiliations

Aging the brain: multi-region methylation principal component based clock in the context of Alzheimer's disease

Kyra L Thrush et al. Aging (Albany NY). .

Abstract

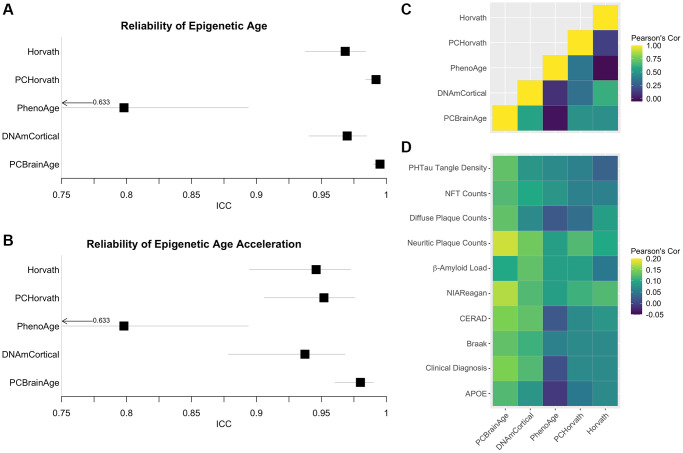
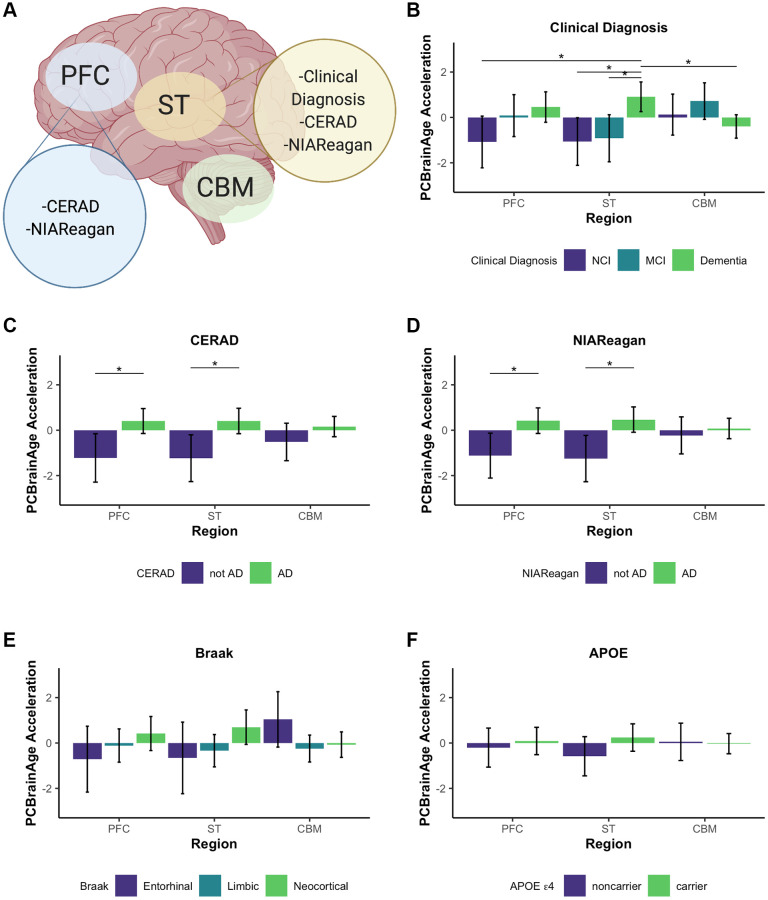
Alzheimer's disease (AD) risk increases exponentially with age and is associated with multiple molecular hallmarks of aging, one of which is epigenetic alterations. Epigenetic age predictors based on 5' cytosine methylation (DNAm), or epigenetic clocks, have previously suggested that epigenetic age acceleration may occur in AD brain tissue. Epigenetic clocks are promising tools for the quantification of biological aging, yet we hypothesize that investigation of brain aging in AD will be assisted by the development of brain-specific epigenetic clocks. Therefore, we generated a novel age predictor termed PCBrainAge that was trained solely in cortical samples. This predictor utilizes a combination of principal components analysis and regularized regression, which reduces technical noise and greatly improves test-retest reliability. To characterize the scope of PCBrainAge's utility, we generated DNAm data from multiple brain regions in a sample from the Religious Orders Study and Rush Memory and Aging Project. PCBrainAge captures meaningful heterogeneity of aging: Its acceleration demonstrates stronger associations with clinical AD dementia, pathologic AD, and APOE ε4 carrier status compared to extant epigenetic age predictors. It further does so across multiple cortical and subcortical regions. Overall, PCBrainAge's increased reliability and specificity makes it a particularly promising tool for investigating heterogeneity in brain aging, as well as epigenetic alterations underlying AD risk and resilience.

Keywords: Alzheimer's disease; age acceleration; brain; epigenetic clocks; unsupervised machine learning.


Conflict of interest statement

CONFLICTS OF INTEREST: MEL previously acted as a Scientific Advisor for, and received consulting fees from, Elysium Health, Inc. AHC received consulting fees from FOXO Technologies, Inc. for work unrelated to the present manuscript.

Figures

Figure 1
Figure 1
Training and testing of multiple iterations of PCBrainAge. Using the dataset from GSE74193, elastic net was used to predict age using principal component loadings in both sexes (A), only males (B), or only females (C). Here, we show the resultant predictions for each model in both females (purple) and males (green) regardless of training sex. Each model so trained is then predicted in all individuals from syn5850422 (DF), regardless of sex or AD status. Each model selected a number of principal components to use for prediction, and we compared the selection of each model using a Venn diagram (G). Subsequent training of an elastic net model using only the 15 core principal components in both sexes is visualized (H) and compared to performance in the test dataset (I).
Figure 2
Figure 2
Understanding core principal component composition. Principal component loadings for individuals in the training dataset were correlated using biweight midcorrelation (bicor) to selected author-provided phenotypic annotations (A). The same procedure was applied to the projected principal component loadings for all individuals in the test dataset, including those with and without Alzheimer’s disease (B). To ensure that future correlations between age prediction and disease are not the result of unrealistic distortions in PC loadings following the prediction process, we used ridgeplots to visualize the distribution of loadings in each PC in age 65+ training individuals (C) and the test data (D). [Abbreviations: NPCs: neural progenitor cells; Cort: cortical; ESCs: embryonic stem cells; DA: dopaminergic].
Figure 3
Figure 3
PCBrainAge acceleration is associated with indications of AD. (A) PCBrainAge residuals following multiple correction were verified to remain orthogonal to age using a scatterplot with LOESS curves for males (green) and females (purple). PCBrainAge Acceleration was subsequently analyzed in the context of CERAD scores (B), Braak stages (C), NIA Reagan scores (D), the ante-mortem clinical diagnosis (E), and the APOE ε4 carrier status (F) of each individual. P-values are the result of performing Kruskal-Wallis tests of nonparametric means amongst the categorical groups. Error bars for 3B-3F depict 1 standard error. (G) Acceleration was further broken down into cognitive groups by APOE ε4 carrier status for improved clarity. Error bars depict the 95% confidence interval. Significance levels based on BH adjusted p values are: *P < 0.05, **P < 0.01; ***P < 0.001.
Figure 4
Figure 4
DNAmClockCortical prediction in test data comparable to PCBrainAge predictions. DNAmClockCortical was estimated in our test dataset, which is independent from its original training. We find that DNAmClockCortical has moderate correlation with age at death (A), and agreement with PCBrainAge accelerations for the same individuals (B). While DNAmClockCortical does exhibit clear acceleration in (advanced) AD patients (CE), demented patients (F), and APOEε4 carriers (G), the p-values of the separation between groups are slightly attenuated versus those of PCBrainAge (see Figure 3). The standard deviation of various AD pathological characteristics per clock standard deviation are compared for DNAmCortical (pink) and PCBrainAge (blue) (H). Given individuals less than or equal to a standard deviation of age acceleration for each clock, the probability of patients being diagnosed with dementia normalized to the total cohort probability is shown for each clock (I).
Figure 5
Figure 5
Reliability of Alzheimer’s associated DNAm clocks and correlated pathology. Test-retest reliability of DNAm clocks previously reported to associate with clinical or pathological criteria of AD was measured using two-way consistency ICC values, in a dataset of 34 pairs of cerebellum replicates (A). The procedure was repeated using simple age acceleration values defined as residuals from linear regression of clock scores on age and estimated proportion of neurons. (B). Multiple-regression residuals for these clocks computed in the test dataset from ROSMAP data were correlated to each other (C) and various clinical and pathological scores of AD across samples (D).
Figure 6
Figure 6
Multi-region methylation data recapitulates strong PCBrainAge acceleration associations in test data. Conclusions drawn from significant differences in PCBrainAge are graphically outlined by brain region, created with BioRender.com (A). Barplots show the mean PCBrainAge Acceleration as defined by the residual of our mixed linear effects model (eq. 1), with error bars corresponding to a 95% confidence interval. (*) denotes Benjamini Hochberg corrected p-values < 0.05, where within-region significant comparisons are predominantly highlighted. Acceleration was compared among brain regions between groupings according to clinical diagnosis (B), CERAD scores (C), NIA-Reagan scores (D), Braak Scores (E), and APOE ε4 carrier status (F).
Figure 7
Figure 7
Gene set enrichment analysis for highly contributing CpGs. Each PC’s ranked CpG weights were translated to genes according to annotations, and pathway enrichment analysis was run for each PC. Here, the sparse consensus network of enriched curated GO and REAC terms across the 15 PCs is visualized. Annotated clusters of significant pathway similarities and high weights are labeled (5), along with the genes enriched within that group beyond the rest of the network. Each node is colored according to the enrichment score of that term, from PC1 (yellow) to PC15 (dark purple) according to the viridis color palette, with more color slices demonstrating enrichment across more PCs.

Similar articles

Cited by

References

    1. Jorm AF, Jolley D. The incidence of dementia: a meta-analysis. Neurology. 1998; 51:728–33. 10.1212/wnl.51.3.728 - DOI - PubMed
    1. Hou Y, Dan X, Babbar M, Wei Y, Hasselbalch SG, Croteau DL, Bohr VA. Ageing as a risk factor for neurodegenerative disease. Nat Rev Neurol. 2019; 15:565–81. 10.1038/s41582-019-0244-7 - DOI - PubMed
    1. Kerchner GA, Wyss-Coray T. The Role of Aging in Alzheimer’s Disease. In: Sierra F, Kohanski R. (eds) Advances in Geroscience. Springer: Cham. 2016; 197–227. 10.1007/978-3-319-23246-1_7 - DOI
    1. 2020 Alzheimer's disease facts and figures. Alzheimers Dement. 2020; 16:391–460. 10.1002/alz.12068 - DOI - PubMed
    1. Takahashi K, Yamanaka S. Induction of pluripotent stem cells from mouse embryonic and adult fibroblast cultures by defined factors. Cell. 2006; 126:663–76. 10.1016/j.cell.2006.07.024 - DOI - PubMed

Publication types