

p300 arrests intervertebral disc degeneration by regulating the FOXO3/Sirt1/Wnt/β-catenin axis
- PMID: 35907249
- PMCID: PMC9381896
- DOI: 10.1111/acel.13677
p300 arrests intervertebral disc degeneration by regulating the FOXO3/Sirt1/Wnt/β-catenin axis
Abstract
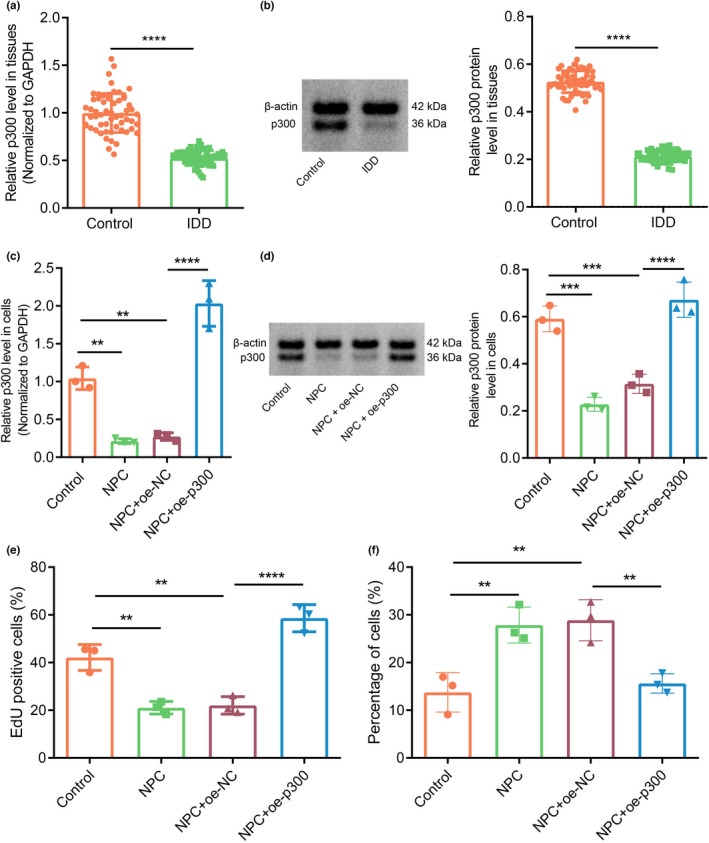
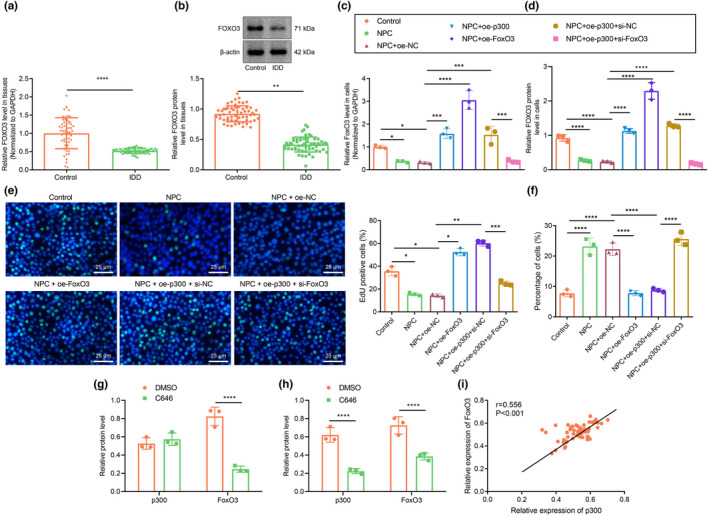
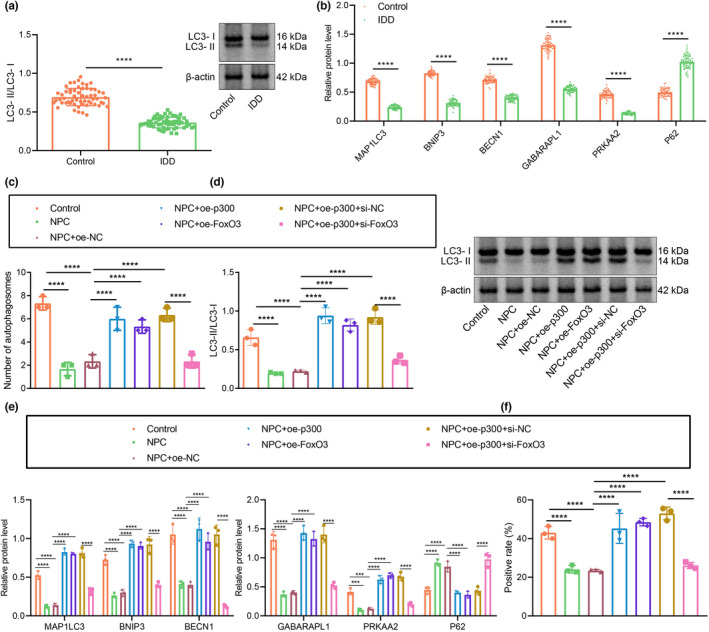
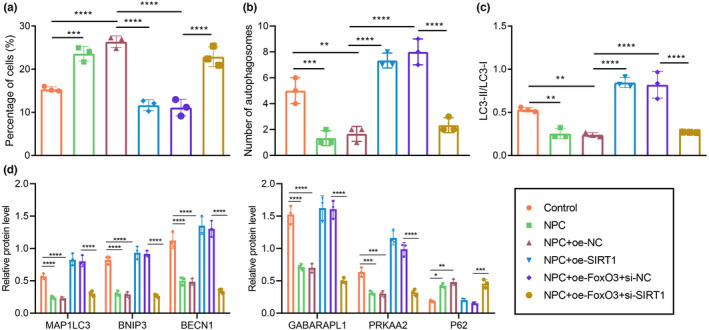
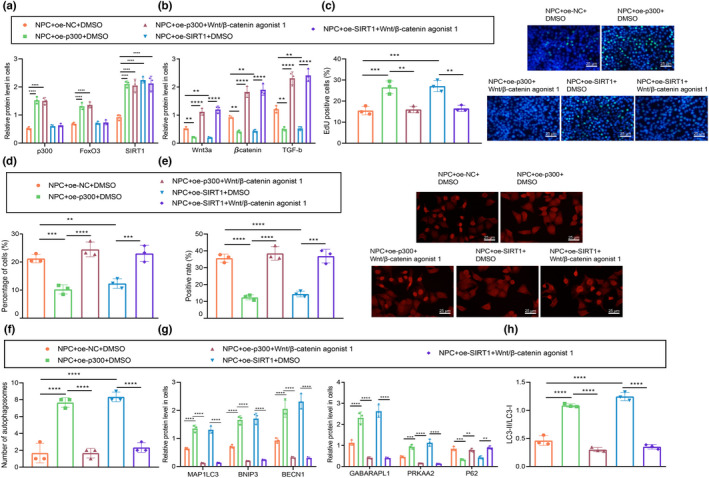
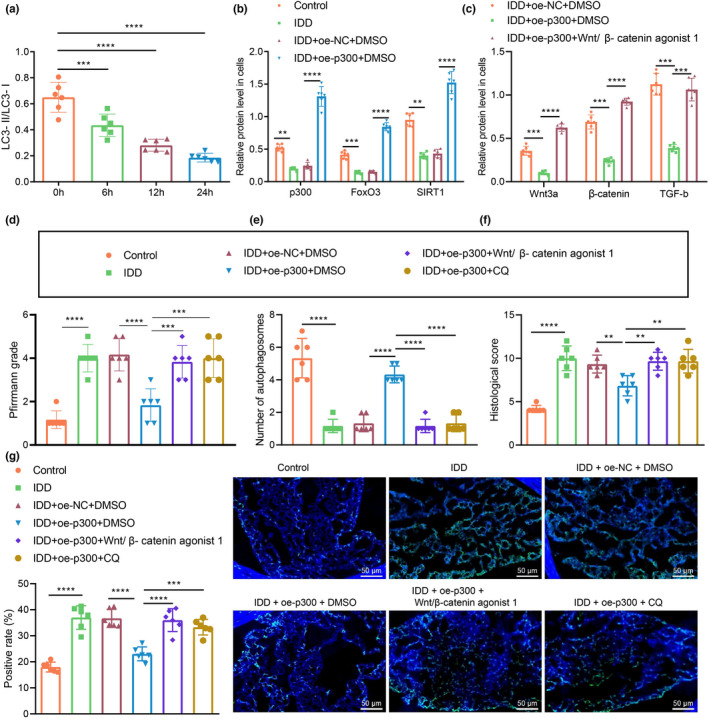
The transcription factor p300 is reportedly involved in age-associated human diseases, including intervertebral disc degeneration (IDD). In this study, we investigate the potential role and pathophysiological mechanism of p300 in IDD. Clinical tissue samples were collected from patients with lumbar disc herniation (LDH), in which the expression of p300, forkhead box O3 (FOXO3), and sirtuin 1 (Sirt1) was determined. Nucleus pulposus cells (NPCs) isolated from clinical degenerative intervertebral disc (IVD) tissues were introduced with oe-p300, oe-FOXO3, Wnt/β-catenin agonist 1, C646 (p300/CBP inhibitor), or si-p300 to explore the functional role of p300 in IDD and to characterize the relationship between p300 and the FOXO3/Sirt1/Wnt/β-catenin pathway. Also, we established a rat IDD model by inducing needle puncture injuries in the caudal IVDs for further verification of p300 functional role. We found that p300 was downregulated in the clinical tissues and NPCs of IDD. Overexpression of p300 promoted the proliferation and autophagy of NPCs while inhibiting cell apoptosis, which was associated with FOXO3 upregulation. p300 could increase the expression of FOXO3 by binding to the Sirt1 promoter, and thus, contributed to inactivation of the Wnt/β-catenin pathway. In vivo results further displayed that p300 slowed down the progression of IDD by disrupting the Wnt/β-catenin pathway through the FOXO3/Sirt1 axis. Taken together, we suggest that p300 can act to suppress IDD via a FOXO3-dependent mechanism, highlighting a potential novel target for treatment of IDD.
Keywords: Autophagy; FOXO3; Intervertebral disc degeneration; Nucleus pulposus cells; Sirt1; Wnt/β-catenin pathway; p300.
© 2022 The Authors. Aging Cell published by Anatomical Society and John Wiley & Sons Ltd.
Conflict of interest statement
The authors declare that they have no competing interests.
Figures

Similar articles
-
S100A6 Regulates nucleus pulposus cell apoptosis via Wnt/β-catenin signaling pathway: an in vitro and in vivo study.Mol Med. 2024 Jun 14;30(1):87. doi: 10.1186/s10020-024-00853-4. Mol Med. 2024. PMID: 38877413 Free PMC article.
-
YTHDF2-dependent m6A modification of FOXO3 mRNA mediates TIMP1 expression and contributes to intervertebral disc degeneration following ROS stimulation.Cell Mol Life Sci. 2024 Dec 3;81(1):477. doi: 10.1007/s00018-024-05503-w. Cell Mol Life Sci. 2024. PMID: 39625652 Free PMC article.
-
SKI knockdown suppresses apoptosis and extracellular matrix degradation of nucleus pulposus cells via inhibition of the Wnt/β-catenin pathway and ameliorates disc degeneration.Apoptosis. 2022 Feb;27(1-2):133-148. doi: 10.1007/s10495-022-01707-2. Epub 2022 Feb 11. Apoptosis. 2022. PMID: 35147801
-
Research on the role and mechanism of IL-17 in intervertebral disc degeneration.Int Immunopharmacol. 2024 May 10;132:111992. doi: 10.1016/j.intimp.2024.111992. Epub 2024 Apr 2. Int Immunopharmacol. 2024. PMID: 38569428 Review.
-
IL-17 in intervertebral disc degeneration: Mechanistic insights and therapeutic implications.Cell Biol Int. 2022 Apr;46(4):535-547. doi: 10.1002/cbin.11767. Epub 2022 Jan 30. Cell Biol Int. 2022. PMID: 35066966 Review.
Cited by
-
Overloaded axial stress activates the Wnt/β-Catenin pathway in nucleus pulposus cells of adult degenerative scoliosis combined with intervertebral disc degeneration.Mol Biol Rep. 2023 Jun;50(6):4791-4798. doi: 10.1007/s11033-023-08390-9. Epub 2023 Apr 8. Mol Biol Rep. 2023. PMID: 37031322 Free PMC article.
-
FOXO3 Inhibits the Cisplatin Resistance and Progression of Melanoma Cells by Promoting CDKN1C Transcription.Appl Biochem Biotechnol. 2024 Nov;196(11):7834-7848. doi: 10.1007/s12010-024-04909-3. Epub 2024 Apr 3. Appl Biochem Biotechnol. 2024. PMID: 38568329
-
Liu Wei Di Huang Decoction Alleviates Renal Fibrosis by Inhibiting Endothelial Mesenchymal Transitions via Upregulating Sirt1 Expression and Inhibiting the Wnt/β-Catenin Signaling Pathway.Drug Des Devel Ther. 2025 Jul 30;19:6587-6603. doi: 10.2147/DDDT.S517938. eCollection 2025. Drug Des Devel Ther. 2025. PMID: 40761667 Free PMC article.
-
Harnessing Stem Cell-Derived Extracellular Vesicles for the Regeneration of Degenerative Bone Conditions.Int J Nanomedicine. 2023 Sep 29;18:5561-5578. doi: 10.2147/IJN.S424731. eCollection 2023. Int J Nanomedicine. 2023. PMID: 37795043 Free PMC article. Review.
-
Network Pharmacology and In Vivo Experimental Verification of the Mechanism of the Qing'e Pill for Treating Intervertebral Disc Degeneration.Curr Comput Aided Drug Des. 2025;21(4):534-548. doi: 10.2174/0115734099356426241119051916. Curr Comput Aided Drug Des. 2025. PMID: 39623712 Free PMC article.
References
-
- Alvarez‐Garcia, O. , Matsuzaki, T. , Olmer, M. , Masuda, K. , & Lotz, M. K. (2017). Age‐related reduction in the expression of FOXO transcription factors and correlations with intervertebral disc degeneration. Journal of Orthopaedic Research, 35(12), 2682–2691. 10.1002/jor.23583 - DOI - PMC - PubMed
-
- Alvarez‐Garcia, O. , Matsuzaki, T. , Olmer, M. , Miyata, K. , Mokuda, S. , Sakai, D. , Masuda, K. , Asahara, H. , & Lotz, M. K. (2018). FOXO are required for intervertebral disk homeostasis during aging and their deficiency promotes disk degeneration. Aging Cell, 17(5), e12800. 10.1111/acel.12800 - DOI - PMC - PubMed
-
- Chen, D. , Xia, D. , Pan, Z. , Xu, D. , Zhou, Y. , Wu, Y. , Cai, N. , Tang, Q. , Wang, C. , Yan, M. , Zhang, J. J. , Zhou, K. , Wang, Q. , Feng, Y. , Wang, X. , Xu, H. , Zhang, X. , & Tian, N. (2016). Metformin protects against apoptosis and senescence in nucleus pulposus cells and ameliorates disc degeneration in vivo. Cell Death & Disease, 7(10), e2441. 10.1038/cddis.2016.334 - DOI - PMC - PubMed
Publication types
MeSH terms
Substances
LinkOut - more resources
Full Text Sources
Research Materials
Miscellaneous
