. 2022 Oct;52(10):1581-1594.
doi: 10.1002/eji.202249879. Epub 2022 Aug 10.

CD169+ subcapsular sinus macrophage-derived microvesicles are associated with light zone follicular dendritic cells

Affiliations

CD169+ subcapsular sinus macrophage-derived microvesicles are associated with light zone follicular dendritic cells

Xin Chen et al. Eur J Immunol. 2022 Oct.

Abstract

Follicular dendritic cells (FDCs) are a specialized type of stromal cells that exclusively reside in B-cell follicles. When inflammation occurs, the FDC network is reorganized to support germinal center (GC) polarization into the light zone (LZ) and dark zone (DZ). Despite the indispensable role of FDCs in supporting humoral responses, the FDC regulatory requirements remain incompletely defined. In this study, we unexpectedly observed an accumulation of CD169+ subcapsular sinus macrophage (SSM)-derived microvesicles (MVs) in the B-cell zone, which were tightly associated with the FDC network. Interestingly, a selective deposition of CD169+ MVs was detected in both GC LZ FDCs in secondary follicles and on predetermined LZ FDCs in primary follicles. The ablation of CD169+ MVs, resulting from SSM depletion, resulted in significantly decreased expression of LZ-related genes in FDCs. In addition, we found that CD169+ MVs could colocalize with fluorescently tagged antigen-containing immune complexes (ICs), supporting a possible role of CD169+ MVs in transporting antigens to the FDC network. Thus, our data reveal intimate crosstalk between FDCs and SSMs located outside B-cell follicles via SSM-released MVs, providing a novel perspective on the mechanisms underlying the regulation of FDC maturation and polarization.

Keywords: CD169+ MVs; FDCs; ICs; LZ; SSMs.


Conflict of interest statement

The authors declare no commercial or financial conflict of interests.

Figures

Figure 1
Figure 1
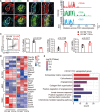
CD169+ MV deposition on FDCs. (A) Immunofluorescence (IF) staining of inguinal lymph node (iLN) sections. The white dashed line indicates CD169 signals inside B‐cell follicles. The boxed region is enlarged in the right panel, and arrowheads indicate representative CD169 signals associated with the FDC network. (B) Representative IF images of iLN sections showing staining for CD169 (red) and FDC markers (green), including CD16/32, FDC‐M1 and VCAM‐1. (C) Representative IF images of iLN sections from LysMCre‐RosaTdT mice and Ms4a3Cre‐RosaTdT mice. (D) Detection of CD169 on FDCs. Representative flow cytometry plots showing the gating strategy of FDCs (gP38+CD31CD35+) isolated from peripheral LNs (gated on CD45). Numbers adjacent to outlined areas indicate the percentages of cells in each area. (E) Representative IF images of sorted CD45gp38+CD31CD35+ FDCs fixed on slides. (F) Siglec1 mRNA quantification by qPCR in CD169+ FDCs, CD169 FDCs, CD169 KO cells and CD169+ SSMs normalized to 18S rRNA. The graphs show the mean ± SEM of 1 representative from 3 independent experiments. (each sample was pooled from peripheral LNs of 6 mice, n = 3) (G) High‐resolution IF images of iLN sections captured by the ZEISS Airyscan module showing staining for CD63 and CD81, with a representative CD169 signal in an enlarged view showing its diameter as 0.36 μm. Arrowheads indicate scattered CD169 signals associated with FDCs. (H) Representative CLEM alignment of LM images with EM images of iLN sections. The boxed region in the left panel (scale bar, 15 μm) is enlarged in the right panel (scale bar, 1 μm). Arrowheads indicate representative structures of CD169 signals under 2 nm resolution. (I) Measurement of the diameters of CD169 signals in EM images (each dot represents one CD169 signal, and 56 dots are shown as the mean ± SEM). The red line represents the mean value. All the representative imaging data shown were from 3 independent experiments.
Figure 2
Figure 2
SSM‐derived CD169+ MVs increase with age. (A‐C) CD169‐DTR mice were treated with PBS or DT. For the DT‐2 week group, DT was intraperitoneally injected every 3 days. iLNs were harvested at indicated time points for analysis. (A) Representative flow cytometry plots showing CD11cintCD169hi SSMs (gated on CD3B220) from iLN. Numbers adjacent to outlined areas indicate the percentages of cells. (B) Representative IF images of iLN sections. FDC networks are encircled by the white dashed lines. (C) Quantification of the percentage of FDC volume colocalized with CD169+ MVs in panel (B). The graph shows the mean ± SEM of 5–6 iLNs from 3 mice per group. Each symbol represents an individual iLN. The exact P values from one‐way ANOVA are shown. (D‐E) Kinetic analysis of CD169+ MVs in iLNs as age increases. (D) Representative IF images of iLN sections from mice aged from 1 to 6 weeks. FDC networks are encircled by the white dashed lines. (E) Quantification of the percentage of FDC volume colocalized with CD169+ MVs at the indicated ages. The graph shows the mean ± SEM of 5–6 iLNs from 3 mice per group. Each symbol represents an individual iLN. The exact P values from one‐way ANOVA are shown. The representative data in (A‐E) were from 3 independent experiments.
Figure 3
Figure 3
CD169+ FDCs resemble LZ FDCs in inflamed LNs. The mice were immunized with KLH in CFA s.c. for 7 days (multisite immunization). (A‐B) Representative IF images of draining iLN sections from immunized mice. The blue and white dashed lines indicate the perimeter of FDC networks and CD169+ MV areas, respectively. (B) The yellow dashed line from the SCS to the T‐B border indicates the axis of CD169, CD35 and CD23 intensity measurement in the right panel. Representative images in (A‐B) were from 3 independent experiments. (C) mRNA quantification of Cxcl12, Cxcl13 and Cr2 normalized to 18S rRNA by qPCR in sorted CD169 FDCs and CD169+ FDCs from immunized mice (The gating scheme of CD169 FDCs and CD169+ FDCs are shown in the left panel). The graphs show the mean ± SEM. of 1 representative from 3 independent experiments (each sample was pooled from peripheral draining LNs of 6 immunized mice, n = 3). The exact P values from the two‐tailed t test are shown. (D‐E) CD169 FDCs and CD169+ FDCs from immunized mice were sorted for RNA seq analysis (each sample was pooled from draining peripheral LNs of 6 immunized mice, n = 3). (D) Heatmap of the scaled gene expression of LZ and DZ FDC markers and curated genes, including MRC genes and TBRC genes shown for CD169 FDCs and CD169+ FDCs. (E) Bar plot showing gene ontology (GO) analysis of upregulated differentially expressed genes (DEGs) in CD169 FDCs versus CD169+ FDCs. The analysis was performed using DAVID. Genes with an adjusted P value < 0.05 and a fold change > 1.5 were used.
Figure 4
Figure 4
CD169+ FDCs resemble LZ FDCs in LNs in the steady state. (A) Representative IF images of iLN sections from unimmunized mice with magnified views of CD169+ FDCs and CD169 FDCs indicated by white and yellow boxes, respectively. One representative from three independent experiments is shown. (B) Representative histogram plot showing the relative expression of CD35 in CD169+ FDCs and CD169 FDCs from unimmunized mice. (C) Quantification of the mean fluorescence intensity (MFI) of CD35 in CD169+ FDCs and CD169 FDCs by flow cytometry in (B). (D) mRNA quantification of Cxcl12, Cxcl13 and Cr2 normalized to 18S rRNA by qPCR in sorted CD169+ FDCs and CD169 FDCs from unimmunized mice. The graphs in (C‐D) show the mean ± SEM of 1 representative from 3 independent experiments (each sample was pooled from peripheral LNs of 10 naive mice, n = 3). The exact P values from the two‐tailed t test are shown.
Figure 5
Figure 5
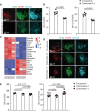
SSMs may influence FDC maturation by shedding CD169+ MVs. (A) Representative IF images of popliteal lymph node (pLN) sections from encapsome‐ or clodronate‐treated mice. Encapsome or clodronate was injected f.p. every 7 days for 2 weeks. (B) Quantification of the mean fluorescence intensity (MFI) of CD35 and CD16/32 in (A). The graph shows the mean ± SEM of 5–6 pLNs from 3 mice per group. Each symbol represents an individual pLN. The exact P values from the two‐tailed t test are shown. (C) FDCs from encapsome or clodronate treated mice were sorted for RNA seq analysis (each sample was pooled from pLNs of 20 mice, n = 3). Heatmap of the scaled gene expression of curated genes shown for sorted CD45gP38+CD31CD35+ FDCs from mice treated with encapsome or clodronate for 2 weeks. (D) Representative IF images of pLN sections from encapsome or clodronate‐treated mice. pLNs were harvested 4 or 7 days post‐injection as indicated. (E) Quantification of the MFI of CD35 and CD16/32 in (D). The graph shows the mean ± SEM of 5–6 pLNs from 3 mice per group. Each symbol represents an individual pLN. The exact P values from one‐way ANOVA are shown. The representative data in (A‐B) and (D‐E) were from 3 independent experiments.
Figure 6
Figure 6
Colocalization of PE‐ICs and CD169+ MVs. Mice were passively immunized with PE‐ICs by injecting rabbit IgG anti‐PE (i.p.) and PE (s.c.). iLNs were harvested 12 h post‐PE injection. (A‐B) Representative IF images of draining iLN sections. (B) Arrowheads in the magnified view of the boxed region indicate representative colocalization of PE‐ICs and CD169+ MVs in vivo. (C) Representative IF images of isolated MVs from PE‐IC‐immunized mice. Twelve hours post‐PE injection, MVs from draining iLNs were isolated through sequential ultracentrifugation, stained and fixed on slides. The arrowhead indicates PE‐IC associated with isolated CD169+ MV. (D) Representative flow cytometry plots showing PE‐IC labeling on isolated CD169+ MVs in PE‐IC‐immunized mice compared with PBS‐treated mice (each sample was pooled from peripheral LNs of 6 mice). Numbers adjacent to outlined areas indicate the percentages of MVs. The representative data in (A‐D) were from 3 independent experiments.

Similar articles

Cited by

References

    1. Van den Broeck, W. , Derore, A. and Simoens, P. , Anatomy and nomenclature of murine lymph nodes: Descriptive study and nomenclatory standardization in BALB/cAnNCrl mice. J Immunol Methods 2006. 312: 12‐19. - PubMed
    1. Mueller, S. N. and Germain, R. N. , Stromal cell contributions to the homeostasis and functionality of the immune system. Nat Rev Immunol 2009. 9: 618‐629. - PMC - PubMed
    1. Link, A. , Vogt, T. K. , Favre, S. , Britschgi, M. R. , Acha‐Orbea, H. , Hinz, B. , Cyster, J. G. and Luther, S. A. , Fibroblastic reticular cells in lymph nodes regulate the homeostasis of naive T cells. Nat Immunol 2007. 8: 1255‐1265. - PubMed
    1. Kumar, V. , Dasoveanu, D. C. , Chyou, S. , Tzeng, T. C. , Rozo, C. , Liang, Y. , Stohl, W. , Fu, Y. X. , Ruddle, N. H. and Lu, T. T. , A dendritic‐cell‐stromal axis maintains immune responses in lymph nodes. Immunity 2015. 42: 719‐730. - PMC - PubMed
    1. Allen, C. D. C. and Cyster, J. G. , Follicular dendritic cell networks of primary follicles and germinal centers: Phenotype and function. Seminars in Immunology 2008. 20: 14‐25. - PMC - PubMed

Publication types