. 2022 Aug 18;185(17):3214-3231.e23.
doi: 10.1016/j.cell.2022.06.038. Epub 2022 Jul 30.

Mitochondrial ROS promotes susceptibility to infection via gasdermin D-mediated necroptosis

Affiliations

Mitochondrial ROS promotes susceptibility to infection via gasdermin D-mediated necroptosis

Chi G Weindel et al. Cell. .

Abstract

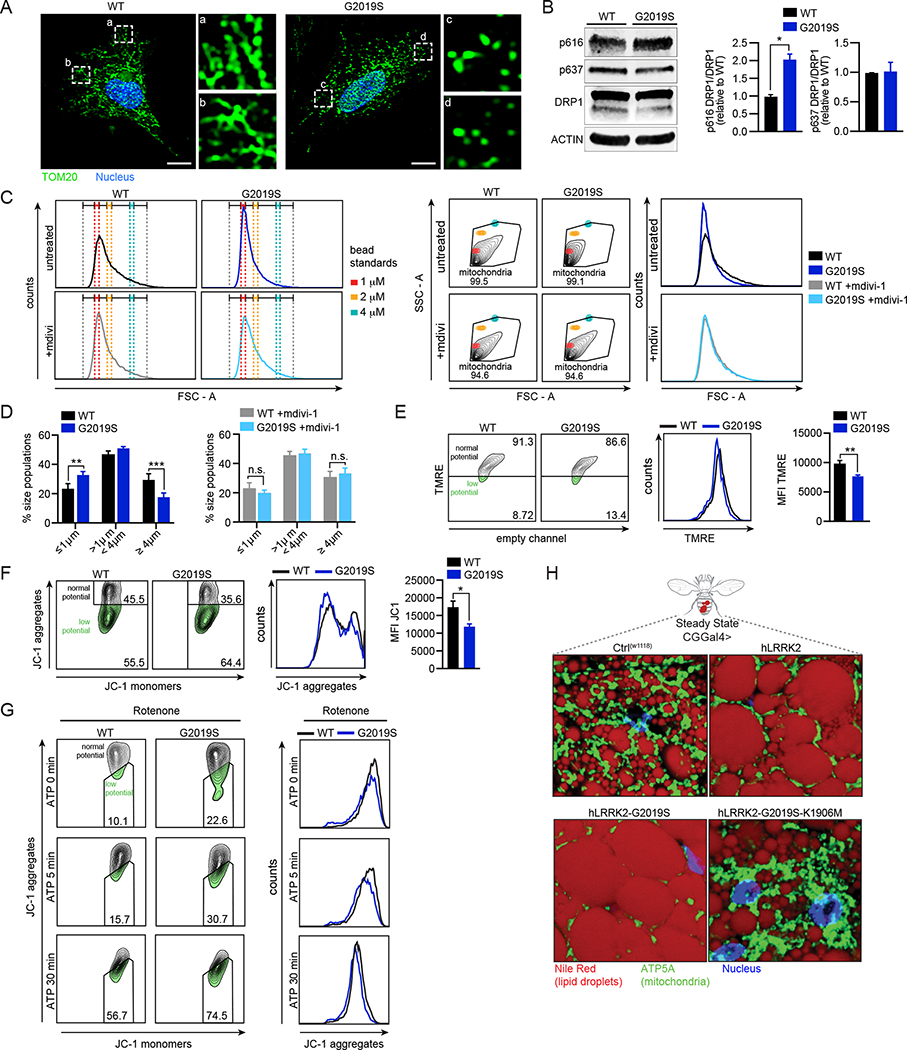
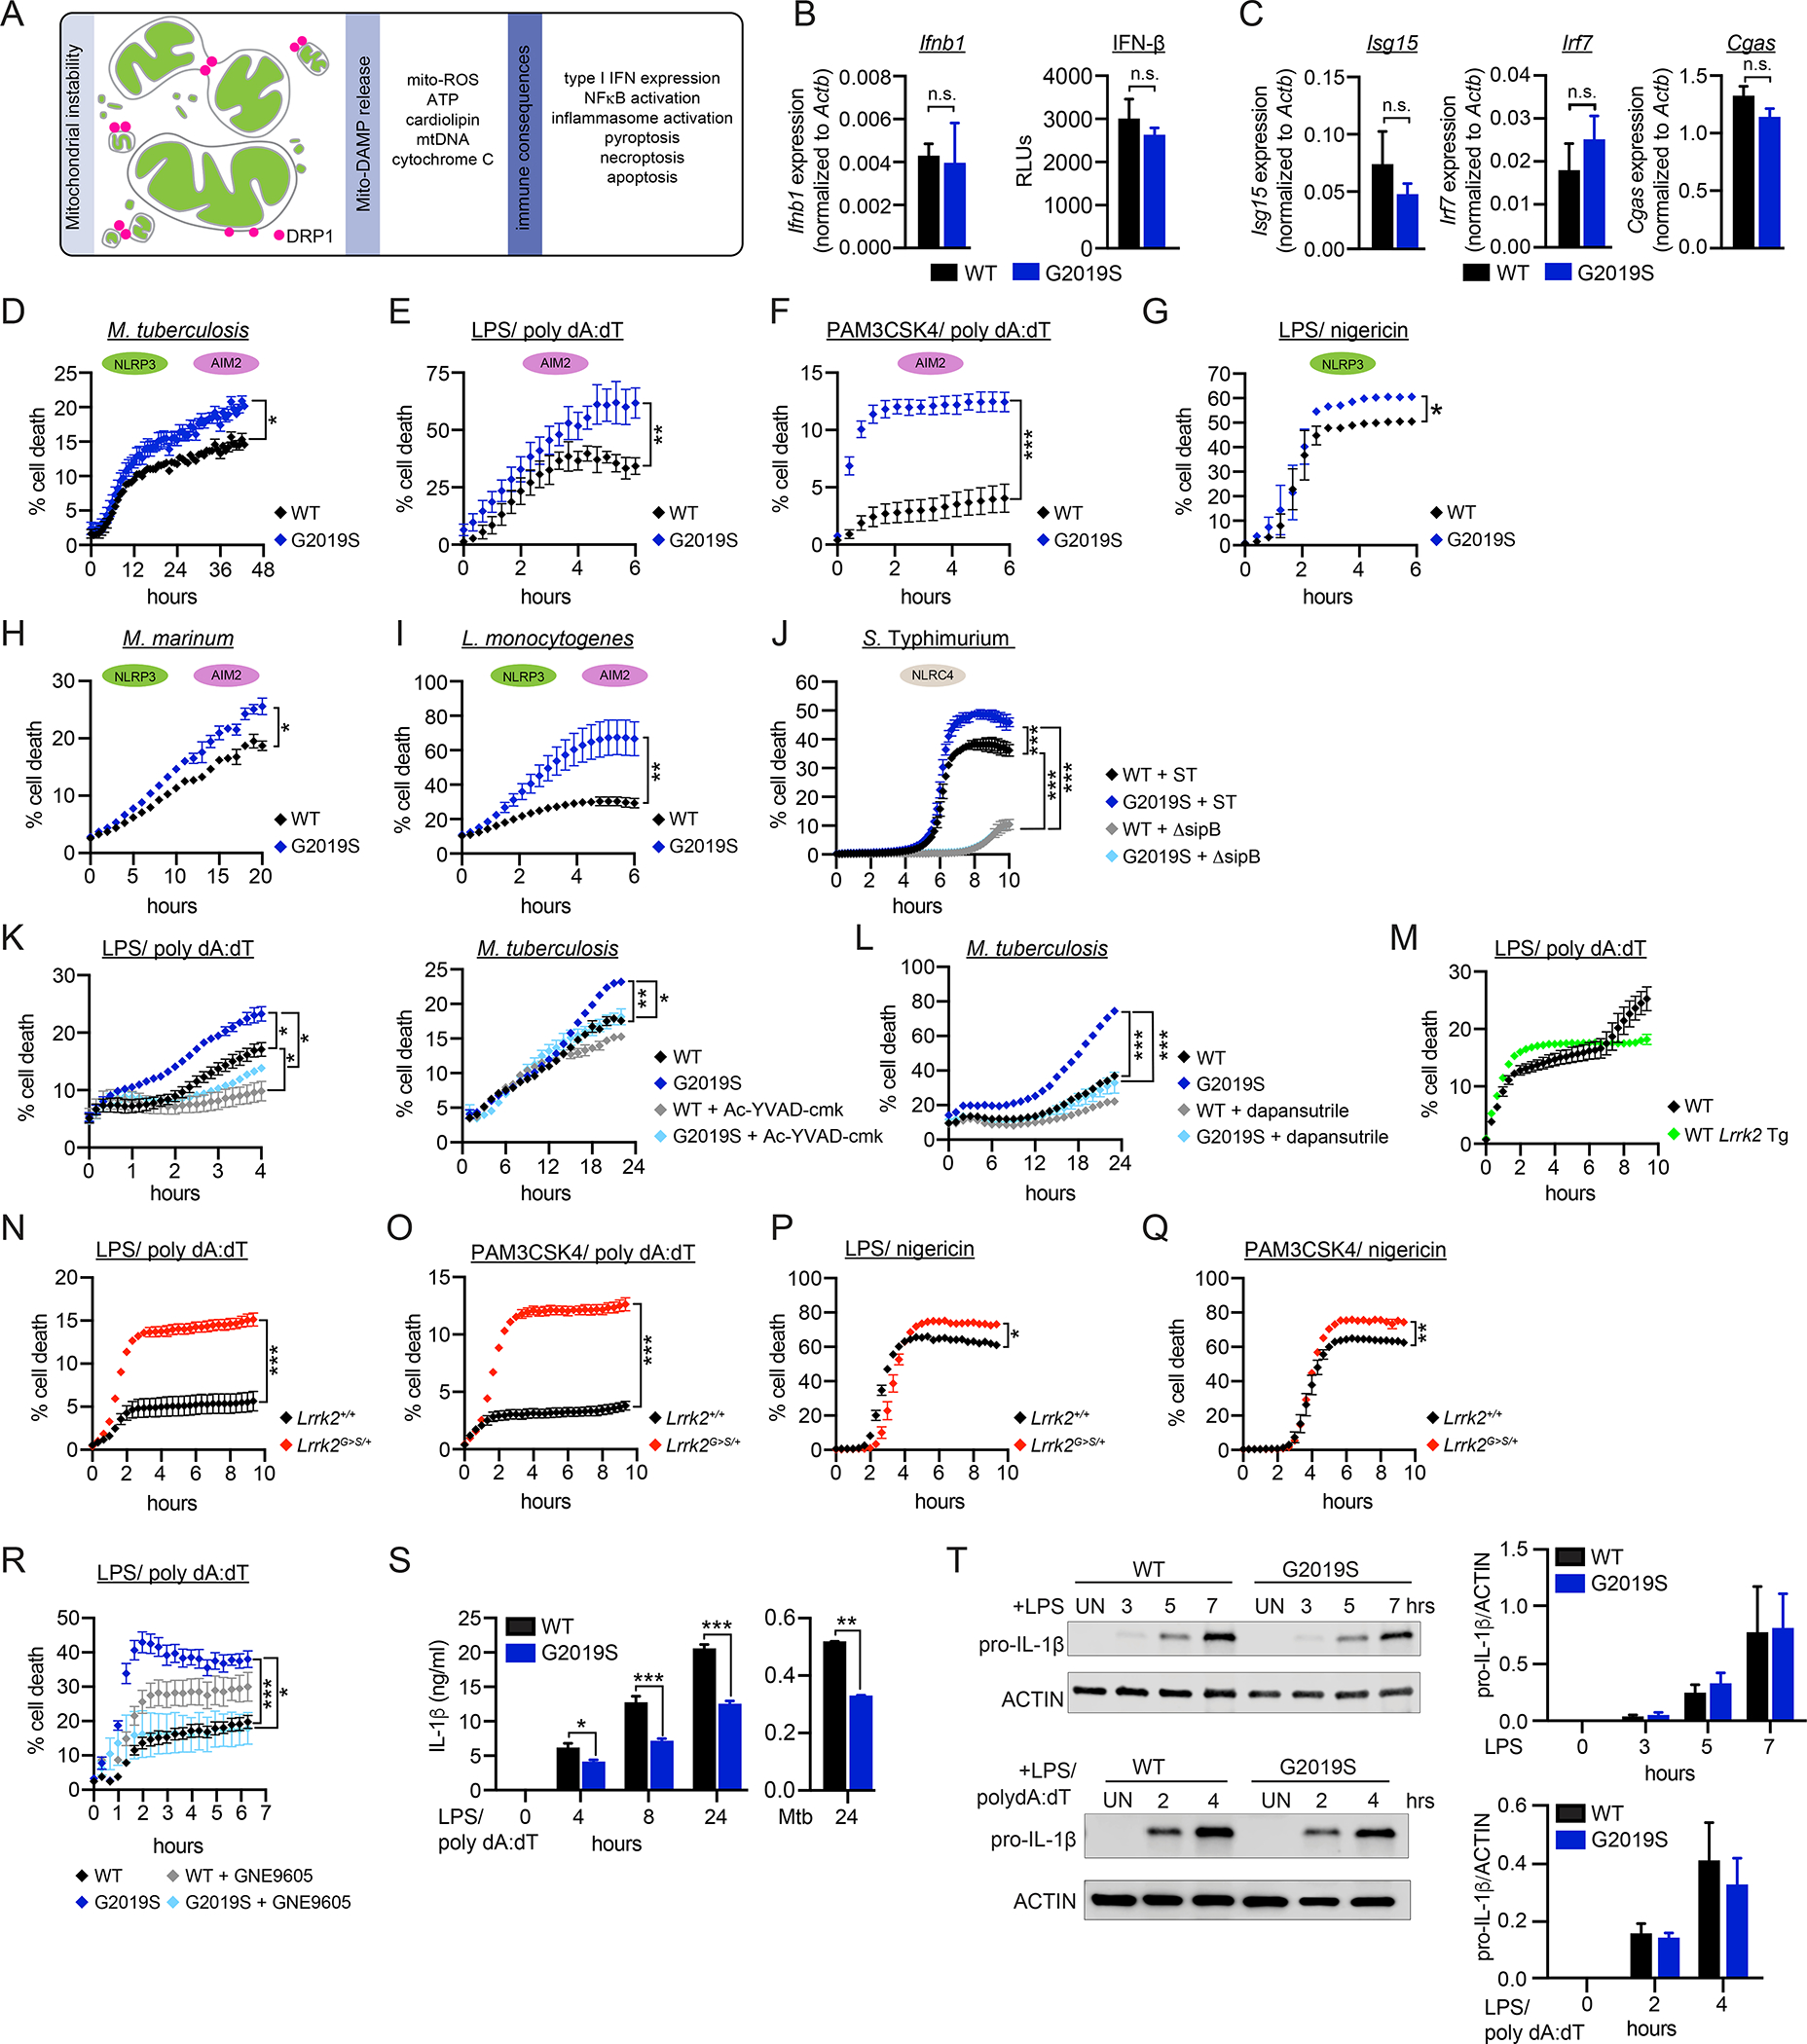
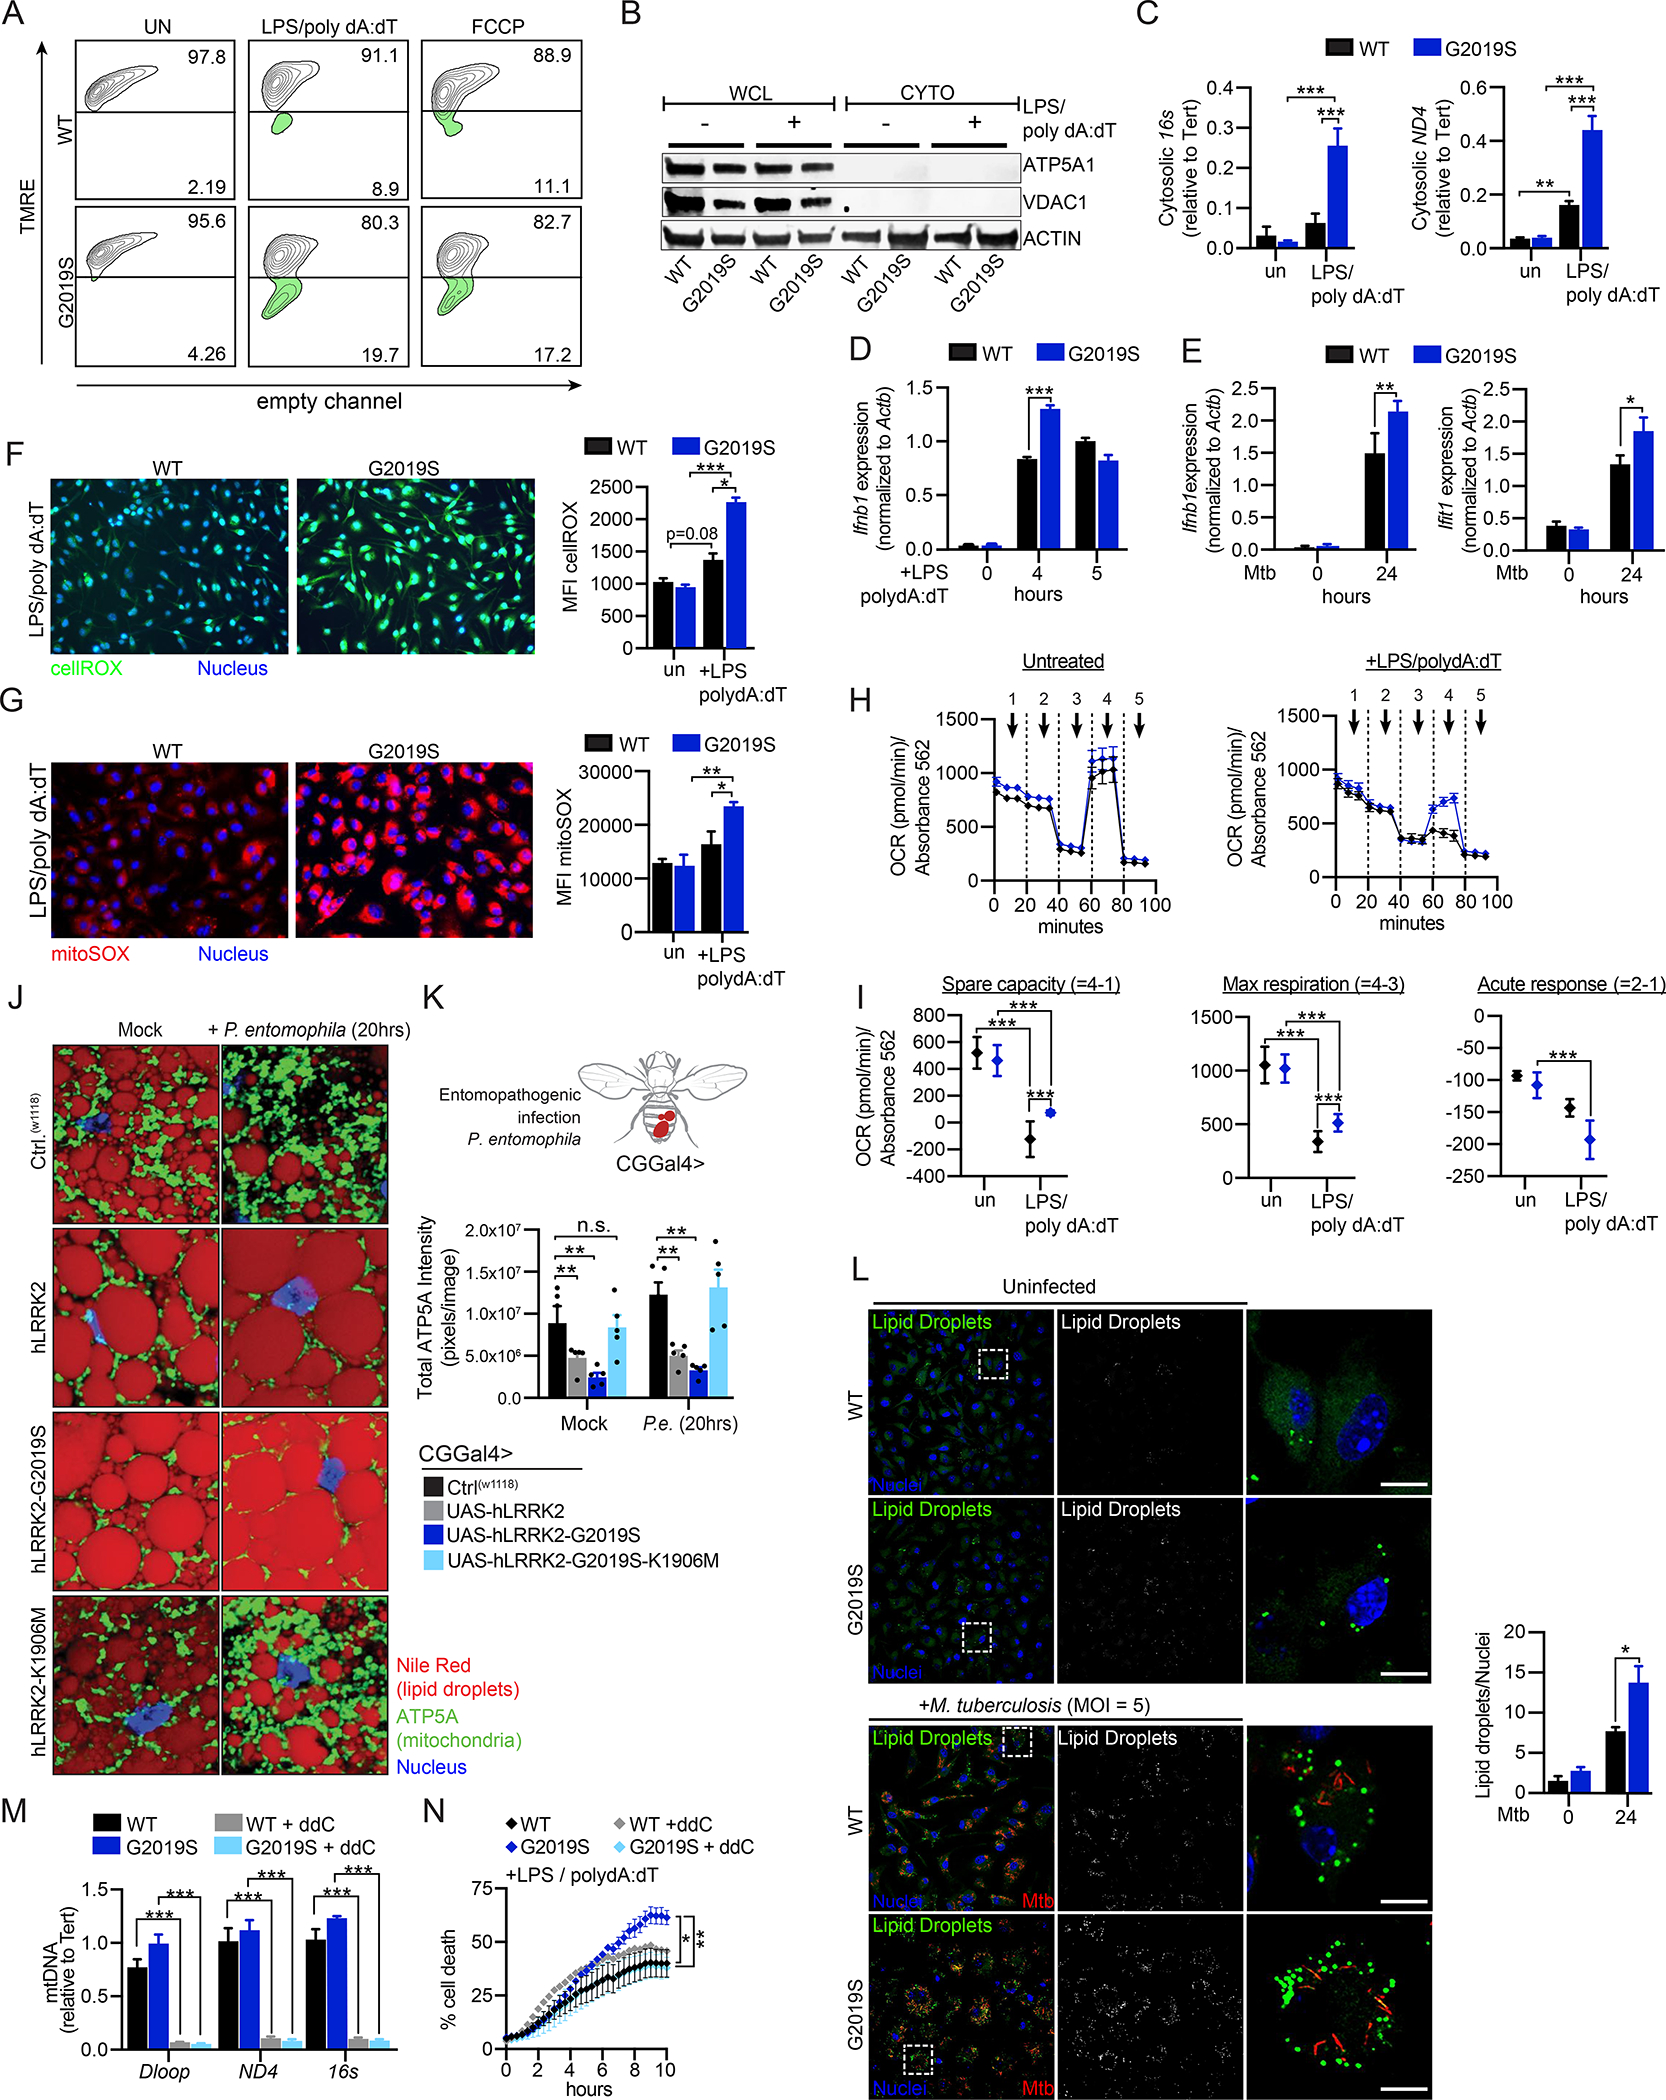
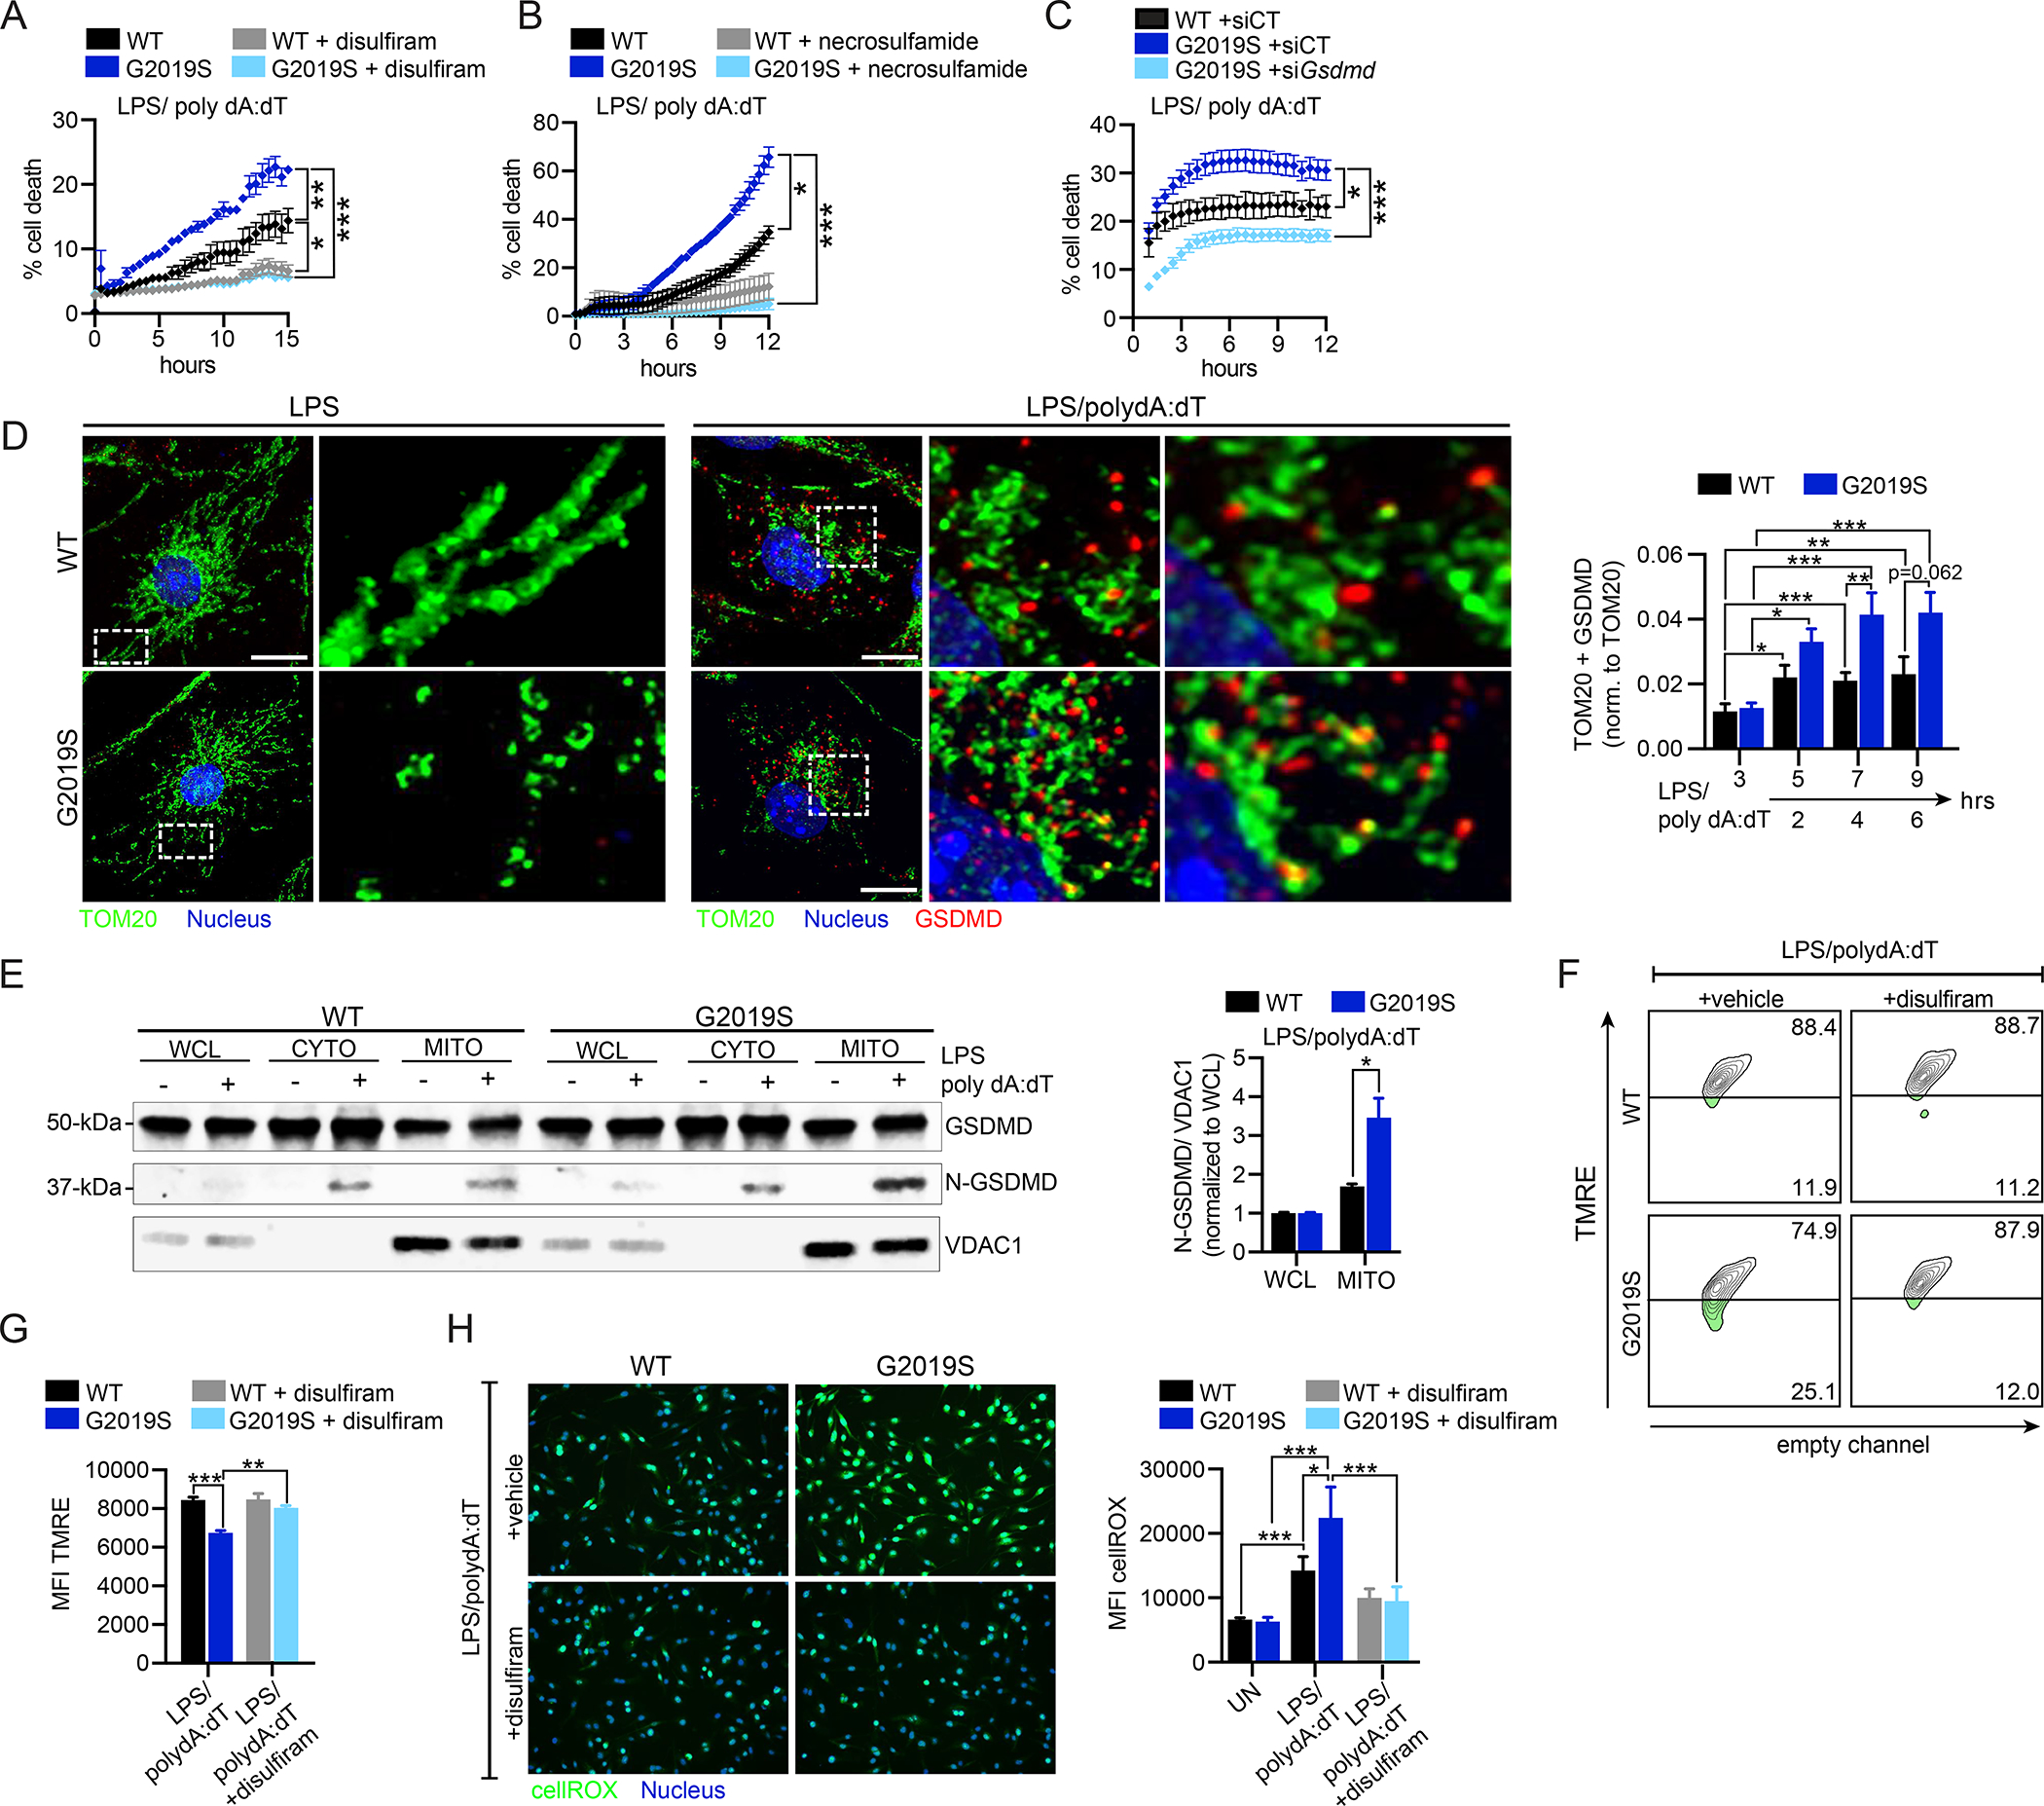
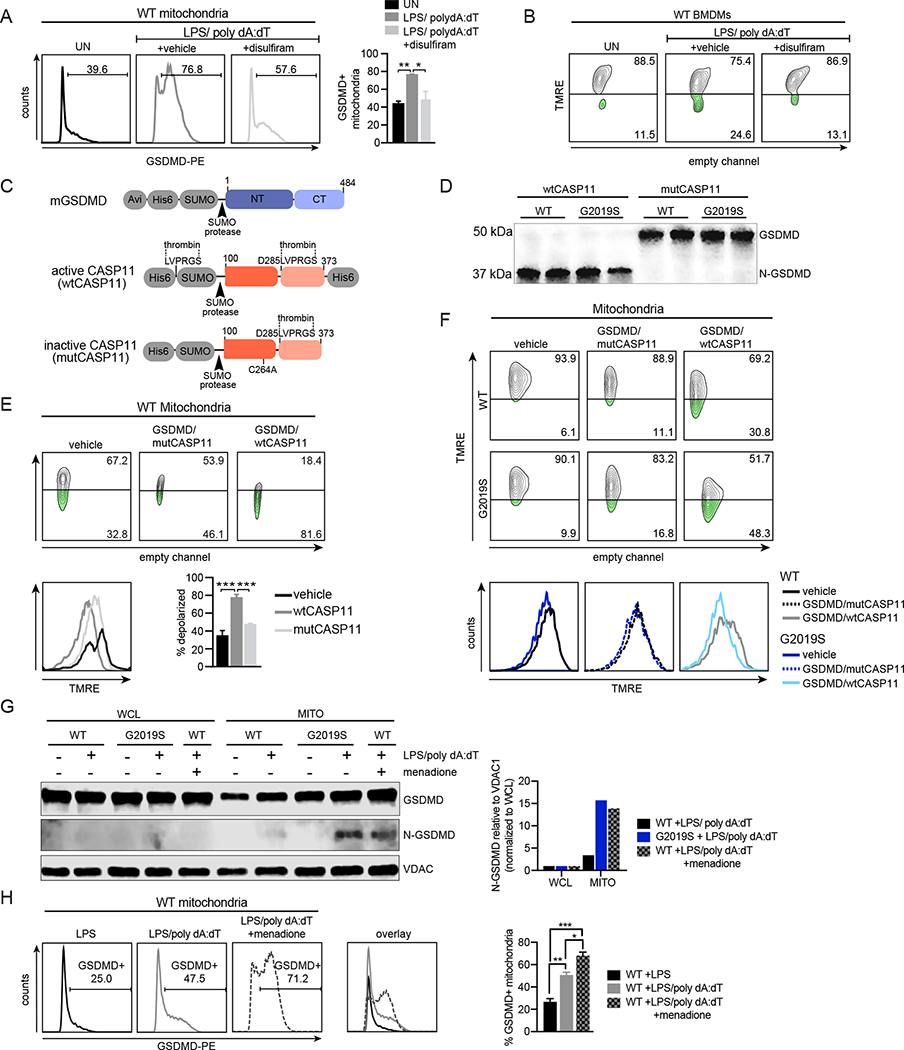
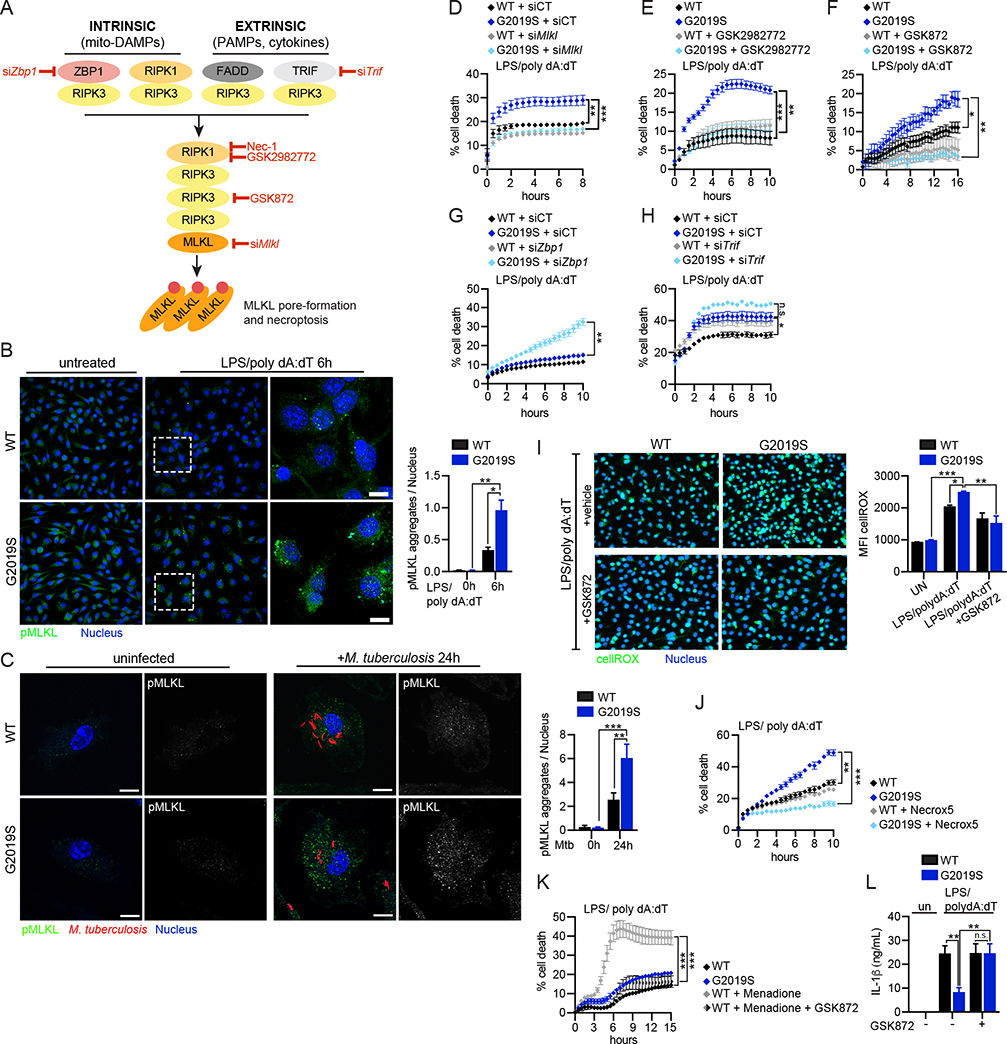
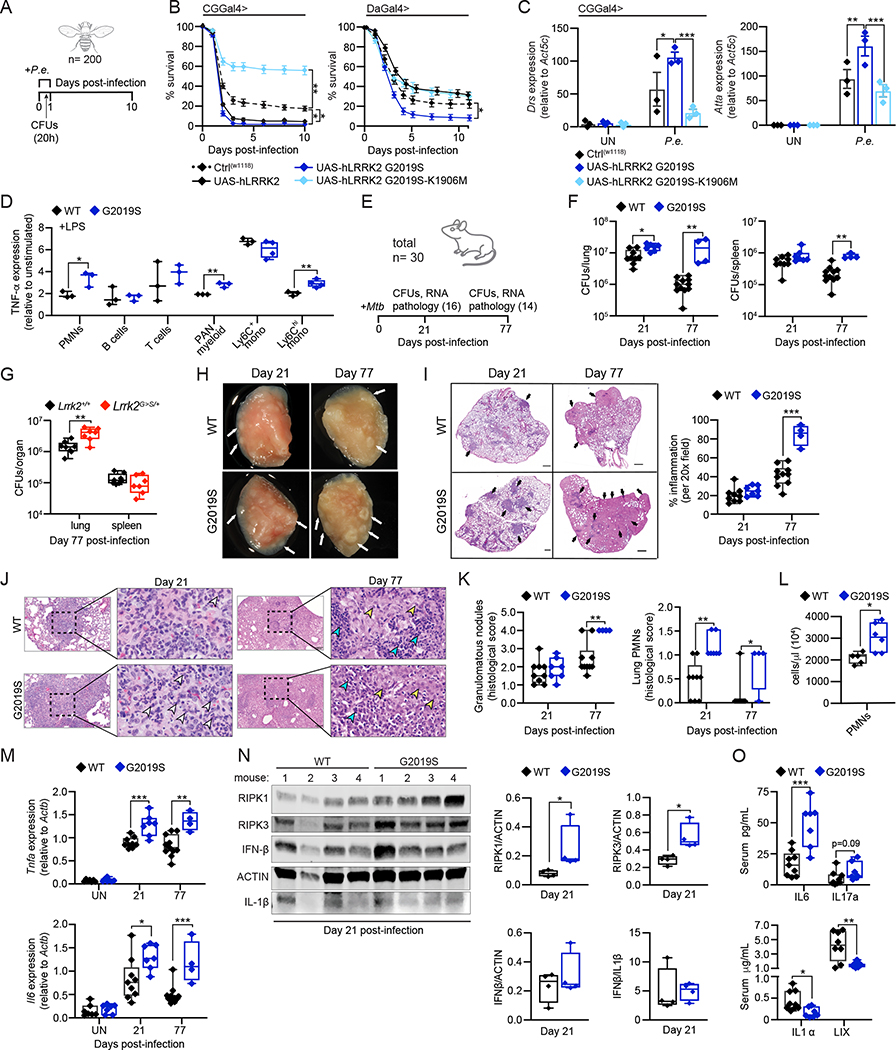
Although mutations in mitochondrial-associated genes are linked to inflammation and susceptibility to infection, their mechanistic contributions to immune outcomes remain ill-defined. We discovered that the disease-associated gain-of-function allele Lrrk2G2019S (leucine-rich repeat kinase 2) perturbs mitochondrial homeostasis and reprograms cell death pathways in macrophages. When the inflammasome is activated in Lrrk2G2019S macrophages, elevated mitochondrial ROS (mtROS) directs association of the pore-forming protein gasdermin D (GSDMD) to mitochondrial membranes. Mitochondrial GSDMD pore formation then releases mtROS, promoting a switch to RIPK1/RIPK3/MLKL-dependent necroptosis. Consistent with enhanced necroptosis, infection of Lrrk2G2019S mice with Mycobacterium tuberculosis elicits hyperinflammation and severe immunopathology. Our findings suggest a pivotal role for GSDMD as an executer of multiple cell death pathways and demonstrate that mitochondrial dysfunction can direct immune outcomes via cell death modality switching. This work provides insights into how LRRK2 mutations manifest or exacerbate human diseases and identifies GSDMD-dependent necroptosis as a potential target to limit Lrrk2G2019S-mediated immunopathology.

Keywords: Drosophila melanogaster; LRRK2; Mycobacterium tuberculosis; Parkinson’s disease; RIPK3; immunometabolism; inflammasome; inflammation; innate immunity; pyroptosis.


Conflict of interest statement

Declaration of interests The authors declare no competing interests.

Figures

Figure 1.
Figure 1.. Lrrk2G2019S promotes mitochondrial dysfunction marked by network fragmentation and susceptibility to depolarization upon cellular stress.
A. Mitochondria (anti-TOM20; green) in WT and Lrrk2G2019S MEFs. Nuclei (DAPI; blue). B. Immunoblot and quantification (n=2) of pDRP1 (pSer616 = activation; pSer637 = inhibition) in WT and Lrrk2G2019S BMDMs relative to total DRP1 with ACTIN loading control. C. FSC-A (FACS plots and histograms) of isolated mitochondria from WT and Lrrk2G2019S BMDMs relative to bead standards +/− 10 μM Mdivi-1 for 16h. D. Mitochondrial size distribution in WT and Lrrk2G2019S BMDMs based on size standard polystyrene beads +/− 10 μM Mdivi-1. E. Mitochondrial membrane potential measured by flow cytometry of TMRE (585/15) in WT and Lrrk2G2019S BMDMs. Histograms display (585/15) x-axis. Quantitation on right. F. Mitochondrial membrane potential measured by flow cytometry of JC-1. JC-1 aggregation = normal mitochondrial membrane potential (610/20); JC-1 monomers = low membrane potential (530/30) x-axis. Histograms display (610/20) y-axis. Quantification on right. G. JC-1 in WT and Lrrk2G2019S BMDMs treated with rotenone (2.5 μM for 3h) followed by ATP (5 mM for 5 and 30 min). Right histograms display (610/20) x-axis. H. Drosophila melanogaster lipid droplets (Nile red; red), mitochondria (ATP5A; green), and nuclei (DAPI; blue) in WT (CT(w1118)), hLRRK2, hLRRK2-G2019S, and hLRRK2-G2019S-K1906M-expressing flies. Expression driven by a fat body-specific promoter (CGGal4>). Statistical analysis: Data are mean of three or more biological replicates (unless otherwise noted). Error bars depict SEM. Statistical significance determined using a two-tailed Student’s T test (B, E, F), or one-way ANOVA with Sidak’s post-test (C): * = p<0.05, ** = p<0.01, *** = p<0.001.
Figure 2.
Figure 2.. Lrrk2G2019S promotes cell death during intracellular bacterial infection and inflammasome activation.
A. Innate immune consequences of mitochondrial network instability. B. Basal Ifnb1 transcript (left; measured by RT-qPCR) and protein levels (right; relative light units (RLUs) measured by ISRE reporter cells) in WT and Lrrk2G2019S BMDMs. C. Basal ISG transcript levels in WT and Lrrk2G2019S BMDMs measured by RT-qPCR. D. % cell death in WT and Lrrk2G2019S BMDMs over a time course of infection with Mtb (MOI 5). Cell death measured by propidium iodide incorporation (% = PI+ cells/total cells*100). E. % cell death in WT and Lrrk2G2019S BMDMs over a time course of AIM2 stimulation. All AIM2 stimulations were performed in BMDMs by 10 ng/mL LPS priming for 3h followed by 1 μg/mL poly dA:dT. Time courses begin with the introduction of poly dA:dT. F. As in E but with Pam3CSK4 priming (10 ng/ml). G. % cell death in WT and Lrrk2G2019S BMDMs over a time-course of NLRP3 stimulation (10 ng/ml LPS priming for 3h followed by 25 μM nigericin). H. As in D, but with Mycobacterium marinum (MOI 5). I. As in D, but with Listeria monocytogenes (MOI 2). J. As in D but with Salmonella enterica (serovar Typhimurium); WT SL1334 and ΔsipB (MOI 0.5). K. (left) AIM2 stimulation as in E or Mtb infection as in D (right) but with caspase-1/11 inhibitor Ac-YVAD-cmk (100 μM). L. As in D but with NLRP3 inhibitor dapansutrile added upon infection (20 μM). M. AIM2 stimulation as in E but with WT and WT Lrrk2 Tg BMDMs. N. AIM2 stimulation as in E but with Lrrk2+/+ and Lrrk2G>S/+ (LRRK2 G2019S KI) BMDMs. O. As in N but with 10 ng/ml Pam3CSK4 priming. P. As in N but with NLRP3 stimulation with LPS/nigericin. Q. As in N but with Pam3CSK4/nigericin. R. As in E but with LRRK2 inhibitor GNE9605 (1 μM). S. Extracellular IL-1β protein levels measured by ELISA over a time course of AIM2 stimulation (as in E) or at 24h after infection with Mtb (MOI 10) in WT and Lrrk2G2019S BMDMs. T. Protein levels of pro-IL-1β after LPS treatment (top) and LPS/poly dA:dT treatment (bottom) in WT and Lrrk2G2019S BMDMs. Quantification on right. n=2. Statistical analysis: n=3 or more unless otherwise noted. Statistical significance determined via two-tailed Student’s T test (B, C, T), a one-way ANOVA with Sidak’s post-test (S, T), or two-way ANOVA with Tukey’s post-test (D-R).
Figure 3.
Figure 3.. Inflammasome activation triggers additional mitochondrial stresses that alter metabolism and promote cell death in Lrrk2G2019S macrophages.
A. TMRE staining of WT and Lrrk2G2019S BMDMs in unstimulated cells and 2h post-AIM2 stimulation. 50 μM FCCP (30 min) used as a positive control. B. Total and cytosolic fractions from WT and Lrrk2G2019S BMDMs 3h post-AIM2 stimulation. Mitochondrial proteins ATP5A1 and VDAC1 show purity of the cytosolic fraction with ACTIN loading control. C. qPCR of mtDNA (16s and ND4) from cytosolic fractions in B., quantified relative to total nuclear DNA (Tert) in unstimulated and AIM2 stimulated (3h) WT and Lrrk2G2019S BMDMs D. Ifnb1 transcript levels by RT-qPCR in WT and Lrrk2G2019S BMDMs at 0, 4, and 5h post-AIM2 stimulation. E. Ifnb1 and Ifit1 transcript levels by RT-qPCR in WT and Lrrk2G2019S BMDMs at 0 and 24h post-Mtb infection (MOI 5). F. WT and Lrrk2G2019S BMDMs stained with cellROX (green) and live cell nuclear stain NucBlue (blue) 2h post-AIM2 activation. (right) Mean fluorescence intensity (MFI) measured using GEN5 software (Biotek) expanding a primary mask created around each nucleus by 10 μm. G. As in F but with the mitochondrial targeted superoxide dye mitoSOX. (right) MFI. H. Oxygen consumption rate (OCR) measured by Agilent Seahorse Metabolic Analyzer in WT and Lrrk2G2019S BMDMs: untreated (left) and AIM2 stimulated (+10 ng/mL LPS 3h, 1 μg/mL poly dA:dT 1h)(right). I. Spare respiratory capacity, maximal respiration, and acute response measured in untreated and AIM2-stimulated WT and Lrrk2G2019S BMDMs. J. Lipid droplets (Nile Red; red), mitochondria (ATP5A; green), and nuclei (DAPI; blue) in WT (CT(w1118)), hLRRK2, hLRRK2-G2019S, and hLRRK2-G2019S-K1906M-expressing Drosophila melanogaster (CGGal4> promoter) treated with sucrose (mock) or infected with Pseudomonas entomophila (P.e.) for 20h. K. Quantification of mitochondrial network intensity in 3–5 whole fat body images taken in mock and P.e.-infected hLRRK2-expressing flies. L. Lipid droplet staining (LipidTox; 1x; 30min) in un- and Mtb-infected (MOI 5) WT and Lrrk2G2019S BMDMs 24h post-infection. Lipid droplets/nucleus calculated with ImageJ (153 WT cells counted; 101 Lrrk2G2019S). M. qPCR of total Dloop, ND4 and 16s in WT and Lrrk2G2019S BMDMs +/− 4 days of 10 μM ddC treatment. N. % cell death over a time course of AIM2 activation +/− ddC treatment. Statistical analysis: n=3 or more unless otherwise noted. Statistical significance determined via two-tailed Student’s T test (L), two-way ANOVA with Tukey’s post-test (N), or a one-way ANOVA with Sidak’s post-test (C-G, I, K, M).
Figure 4.
Figure 4.. GSDMD mediates mitochondrial dysfunction and cell death during inflammasome activation in Lrrk2G2019S BMDMs.
A. % cell death following AIM2 activation in WT and Lrrk2G2019S BMDMs +/− 1 μM disulfiram added 1h pre-AIM2 activation. B. As in A but with 20 μM necrosulfamide treatment. C. % cell death following AIM2 activation in WT and Lrrk2G2019S BMDMs transfected with siGsdmd or an untargeted negative control siRNA (siCT). D. Mitochondria (anti-TOM20; green) and GSDMD (anti-GSDMD; red) in WT and Lrrk2G2019S BMDMs 3h post-LPS treatment (top) or 4h post-AIM2 activation. Nuclei visualized by DAPI (blue). (right) Fiji-based analysis of TOM20+ GSDMD aggregates normalized to total TOM20 over a time course of AIM2 stimulation in WT and Lrrk2G2019S BMDMs. E. N-GSDMD mitochondrial association in WT and Lrrk2G2019S BMDMs via biochemical fractionation and immunoblot, with VDAC1 to control for mitochondrial membrane enrichment. (right) N-GSDMD relative to VDAC1 normalized to whole cell lysate. n= 2. F. TMRE staining of WT and Lrrk2G2019S BMDMs +1 μM disulfiram or DMSO (vehicle), followed by 2h AIM2 activation, by flow cytometry. G. as in F but TMRE MFI. H. CellROX (green) staining in WT and Lrrk2G2019S BMDMs +1 μM disulfiram or DMSO (vehicle) at 2h post-AIM2 stimulation (live cell nuclei staining with NucBlue). (right) cellROX MFI. Statistical analysis: n=3 or more unless otherwise noted. Statistical significance determined via a two-tailed Student’s T test (F), a two-way ANOVA with Tukey’s post-test (A-C), or a one-way ANOVA with Sidak’s post-test (E, H, J).
Figure 5.
Figure 5.. N-GSDMD directly mediates depolarization of macrophage mitochondrial membranes following AIM2 activation.
A. GSDMD association (anti-GSDMD; PE, x-axis) with the mitochondrial network measured by flow cytometry of isolated mitochondria 4h after AIM2 activation +1 μM disulfiram or DMSO (vehicle) B. TMRE staining of WT BMDMs treated with 1 μM disulfiram or DMSO (vehicle), followed by AIM2 activation for 4h C. Schematic of recombinant proteins used in in vitro experiments D. GSDMD cleavage in vitro via recombinant wt or mutCASP11 in the presence of mitochondrial extracts from WT and Lrrk2G2019S BMDMs (n=2) E. FACS plot of TMRE staining of mitochondria isolated from WT BMDMs in the presence of full length GSDMD and wtCASP11 or mutCASP11. 1h incubation. Quantitation at lower right. F. As in E. but with mitochondria isolated from WT and Lrrk2G2019S BMDMs. 30 min incubation G. N-GSDMD mitochondrial association in WT and Lrrk2G2019S BMDMs via biochemical fractionation and immunoblot during AIM2 activation +/− 25 μM menadione. VDAC1; control for mitochondrial membrane enrichment. (right) N-GSDMD relative to VDAC1 normalized to WCL H. As in A but 2h after AIM2 activation, WT BMDMs +/− 25 μM menadione Statistical analysis: n=3 or more unless otherwise noted. Statistical significance determined via a one-way ANOVA with Sidak’s post-test (A, B, E, F, H).
Figure 6.
Figure 6.. GSDMD-dependent alteration of mitochondrial homeostasis triggers RIPK1/RIPK3/MLKL-dependent necroptotic cell death in Lrrk2G2019S BMDMs.
A. Cell-intrinsic and cell-extrinsic signaling cascades that trigger necroptosis. Red = steps in the pathway tested for involvement in Lrrk2G2019S cell death B. Phospho-MLKL aggregation at 6h post-AIM2 stimulation in WT and Lrrk2G2019S BMDMs. (right) pMLKL aggregates/nuclei quantified using Fiji. C. As in B but at 24h post-Mtb infection (MOI 2) D. % cell death following AIM2 activation in WT and Lrrk2G2019S BMDMs transfected with an siRNA against Mlkl (siMlkl) or a non-targeting control siRNA (siCT) E. As in D, but +/− the RIPK1 inhibitor GSK2982772 (10 μM) F. As in D, but +/− RIPK3 inhibitor GSK872 (1 μM) G. As in D, but after transfection with siZbp1 H. As in G but with siTrif I. CellRox (green) and NucBlue (blue) staining in WT and Lrrk2G2019S BMDMs 2h post-AIM2 activation +/− RIPK3 inhibitor GSK872 (1 μM) or DMSO (vehicle). MFI on right. J. % cell death following AIM2 activation in WT and Lrrk2G2019S BMDMs +/− the mitochondrial ROS scavenger Necrox-5 (25 μM) K. % cell death following menadione treatment (25 μM) in WT BMDMs after AIM2 activation +/− GSK872 (1 μM) L. Extracellular IL-1β protein levels as measured by ELISA at 6 h post AIM2 stimulation in WT and Lrrk2G2019S BMDMs +/− RIPK3 inhibitor GSK872 (1 μM) Statistical analysis: n=3 or more unless otherwise noted. Statistical significance determined using a two-tailed Student’s T test (B, C), a two-way ANOVA with Tukey’s post-test (D-H, J, K), or a one-way ANOVA with Sidak’s post-test (I, L).
Figure 7.
Figure 7.. Lrrk2G2019S plays an evolutionarily conserved role in promoting hyperinflammation and susceptibility to bacterial pathogens.
A. P.e. infection timeline B. Survival curves of WT (W118), hLRRK2- (UAS-hLRRK2), hLRRK2-G2019S- (UAS-hLRRK2 G2019S), and hLRRK2 G2019S-K1906M- (UAS-hLRRK2 G2019S-K1906M) expressing flies (fat body tissue-specific expression (CGGal4>) and ubiquitous expression (DaGal4>)) over a 10-day period after a 20h P.e. infection C. Innate immune response gene expression after 20h P.e. infection, relative to Act5c, by RT-qPCR D. Intracellular TNF-α protein levels in PBMCs 4h after stimulation with 1 μg/mL LPS. Fold change of MFI in resting vs. stimulated cells E. Mtb infection timeline with number of mice sacrificed at each time point F. Mtb colony forming units (CFUs) recovered from the lung and spleen of WT and Lrrk2G2019S infected mice at day 21 and 77 post-infection. total n = 30. G. As in F but from Lrrk2+/+ and Lrrk2G>S/+ mice, n = 18 H. Inflammatory nodules in the lungs of WT and Lrrk2G2019S Mtb-infected mice at day 21 and 77 post-infection. White arrows indicate lesions I. H&E stain of inflammatory nodules in the lungs of WT and Lrrk2G2019S Mtb-infected mice at day 21 and 77. % inflammation (right). Black arrows indicate regions of inflammation J. H&E stain of neutrophils within an inflammatory nodule in the lung of WT and Lrrk2G2019S mice at day 21 and 77 post-Mtb infection. Arrows indicate degenerate neutrophils (white), lymphocytes (teal), and macrophages (yellow) K. (left) Semiquantitative score of pulmonary inflammation based on granulomatous nodules in none (0), up to 25% (1), 26–50% (2), 51–75% (3) or 76–100% (4) of fields. (right) Pathology scoring of PMNs in the lungs of WT and Lrrk2G2019S Mtb-infected mice at day 21 and 77 L. PMNs in the lungs of WT and Lrrk2G2019S mice at day 21 by flow cytometry M. Inflammatory cytokines transcripts from lung homogenates by RT-qPCR. N. RIPK1, RIPK3, IFNβ, and IL1β protein levels in lung homogenates (50 μg total protein/lane) at day 21 post-Mtb infection; (right) Quantification O. Serum levels of IL-6, IL-17a, IL-1α, and LIX, in WT and Lrrk2G2019S mice via cytokine array at day 21 post-Mtb infection Statistical analysis: n as indicated. Statistical significance determined using either a one-way ANOVA with Sidak’s post-test (C, D), or a Mann-Whitney U test (F, G, I, K-O).

Comment in

References

    1. Agalliu I, San Luciano M, Mirelman A, Giladi N, Waro B, Aasly J, Inzelberg R, Hassin-Baer S, Friedman E, Ruiz-Martinez J, et al. (2015). Higher frequency of certain cancers in LRRK2 G2019S mutation carriers with Parkinson disease: a pooled analysis. JAMA Neurol 72, 58–65. - PMC - PubMed
    1. Anand P, Cermelli S, Li Z, Kassan A, Bosch M, Sigua R, Huang L, Ouellette AJ, Pol A, Welte MA, et al. (2012). A novel role for lipid droplets in the organismal antibacterial response. Elife 1, e00003. - PMC - PubMed
    1. Anand VS, and Braithwaite SP (2009). LRRK2 in Parkinson’s disease: biochemical functions. FEBS J 276, 6428–6435. - PubMed
    1. Athanasopoulos PS, Heumann R, and Kortholt A (2018). The role of (auto)-phosphorylation in the complex activation mechanism of LRRK2. Biol Chem 399, 643–647. - PubMed
    1. Bae JR, and Lee BD (2015). Function and dysfunction of leucine-rich repeat kinase 2 (LRRK2): Parkinson’s disease and beyond. BMB Rep 48, 243–248. - PMC - PubMed

Publication types

Substances