. 2022 Aug:139:213035.
doi: 10.1016/j.bioadv.2022.213035. Epub 2022 Jul 20.

The generation of a lactate-rich environment stimulates cell cycle progression and modulates gene expression on neonatal and hiPSC-derived cardiomyocytes

Affiliations

The generation of a lactate-rich environment stimulates cell cycle progression and modulates gene expression on neonatal and hiPSC-derived cardiomyocytes

Jesús Ordoño et al. Biomater Adv. 2022 Aug.

Abstract

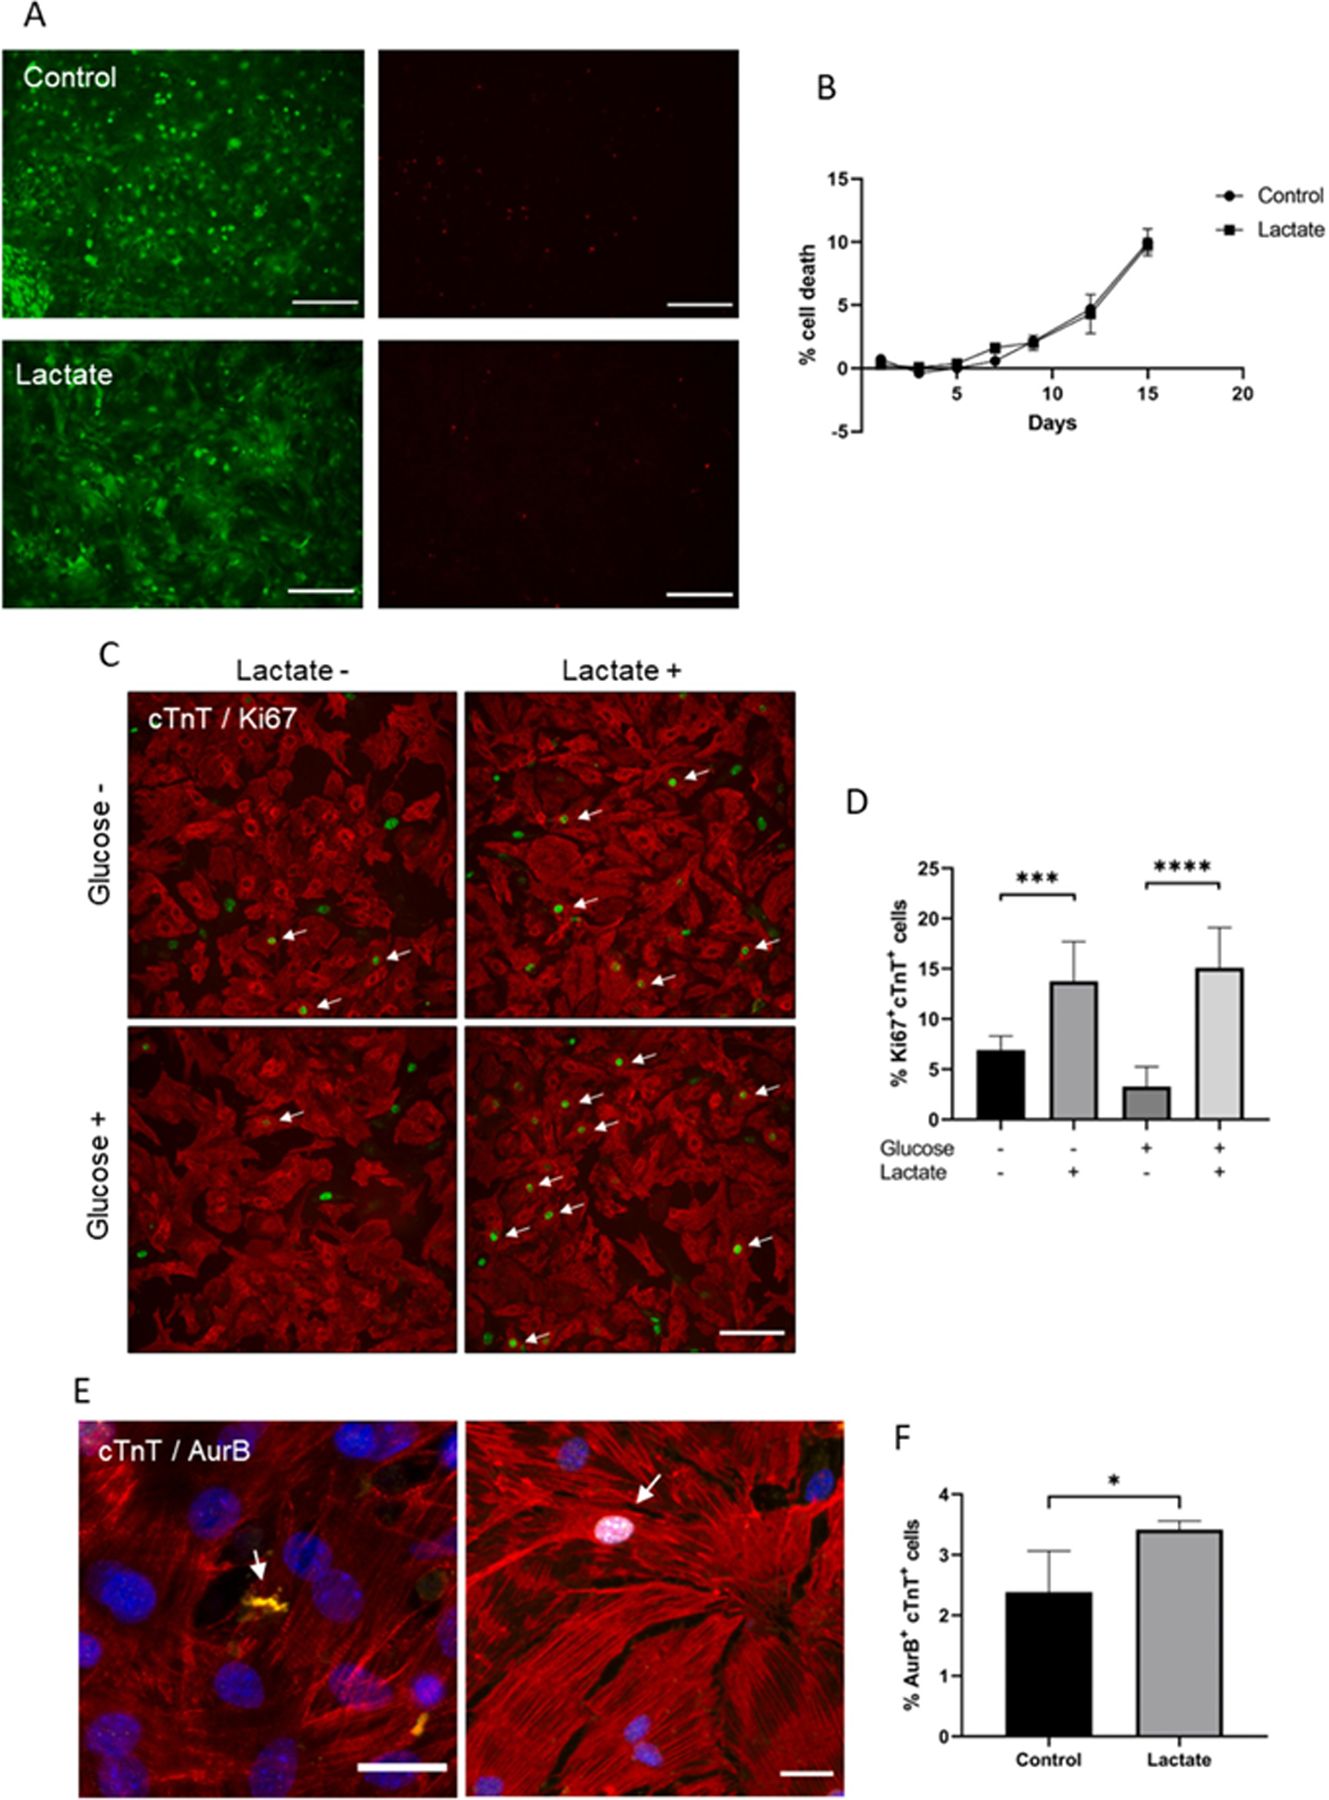
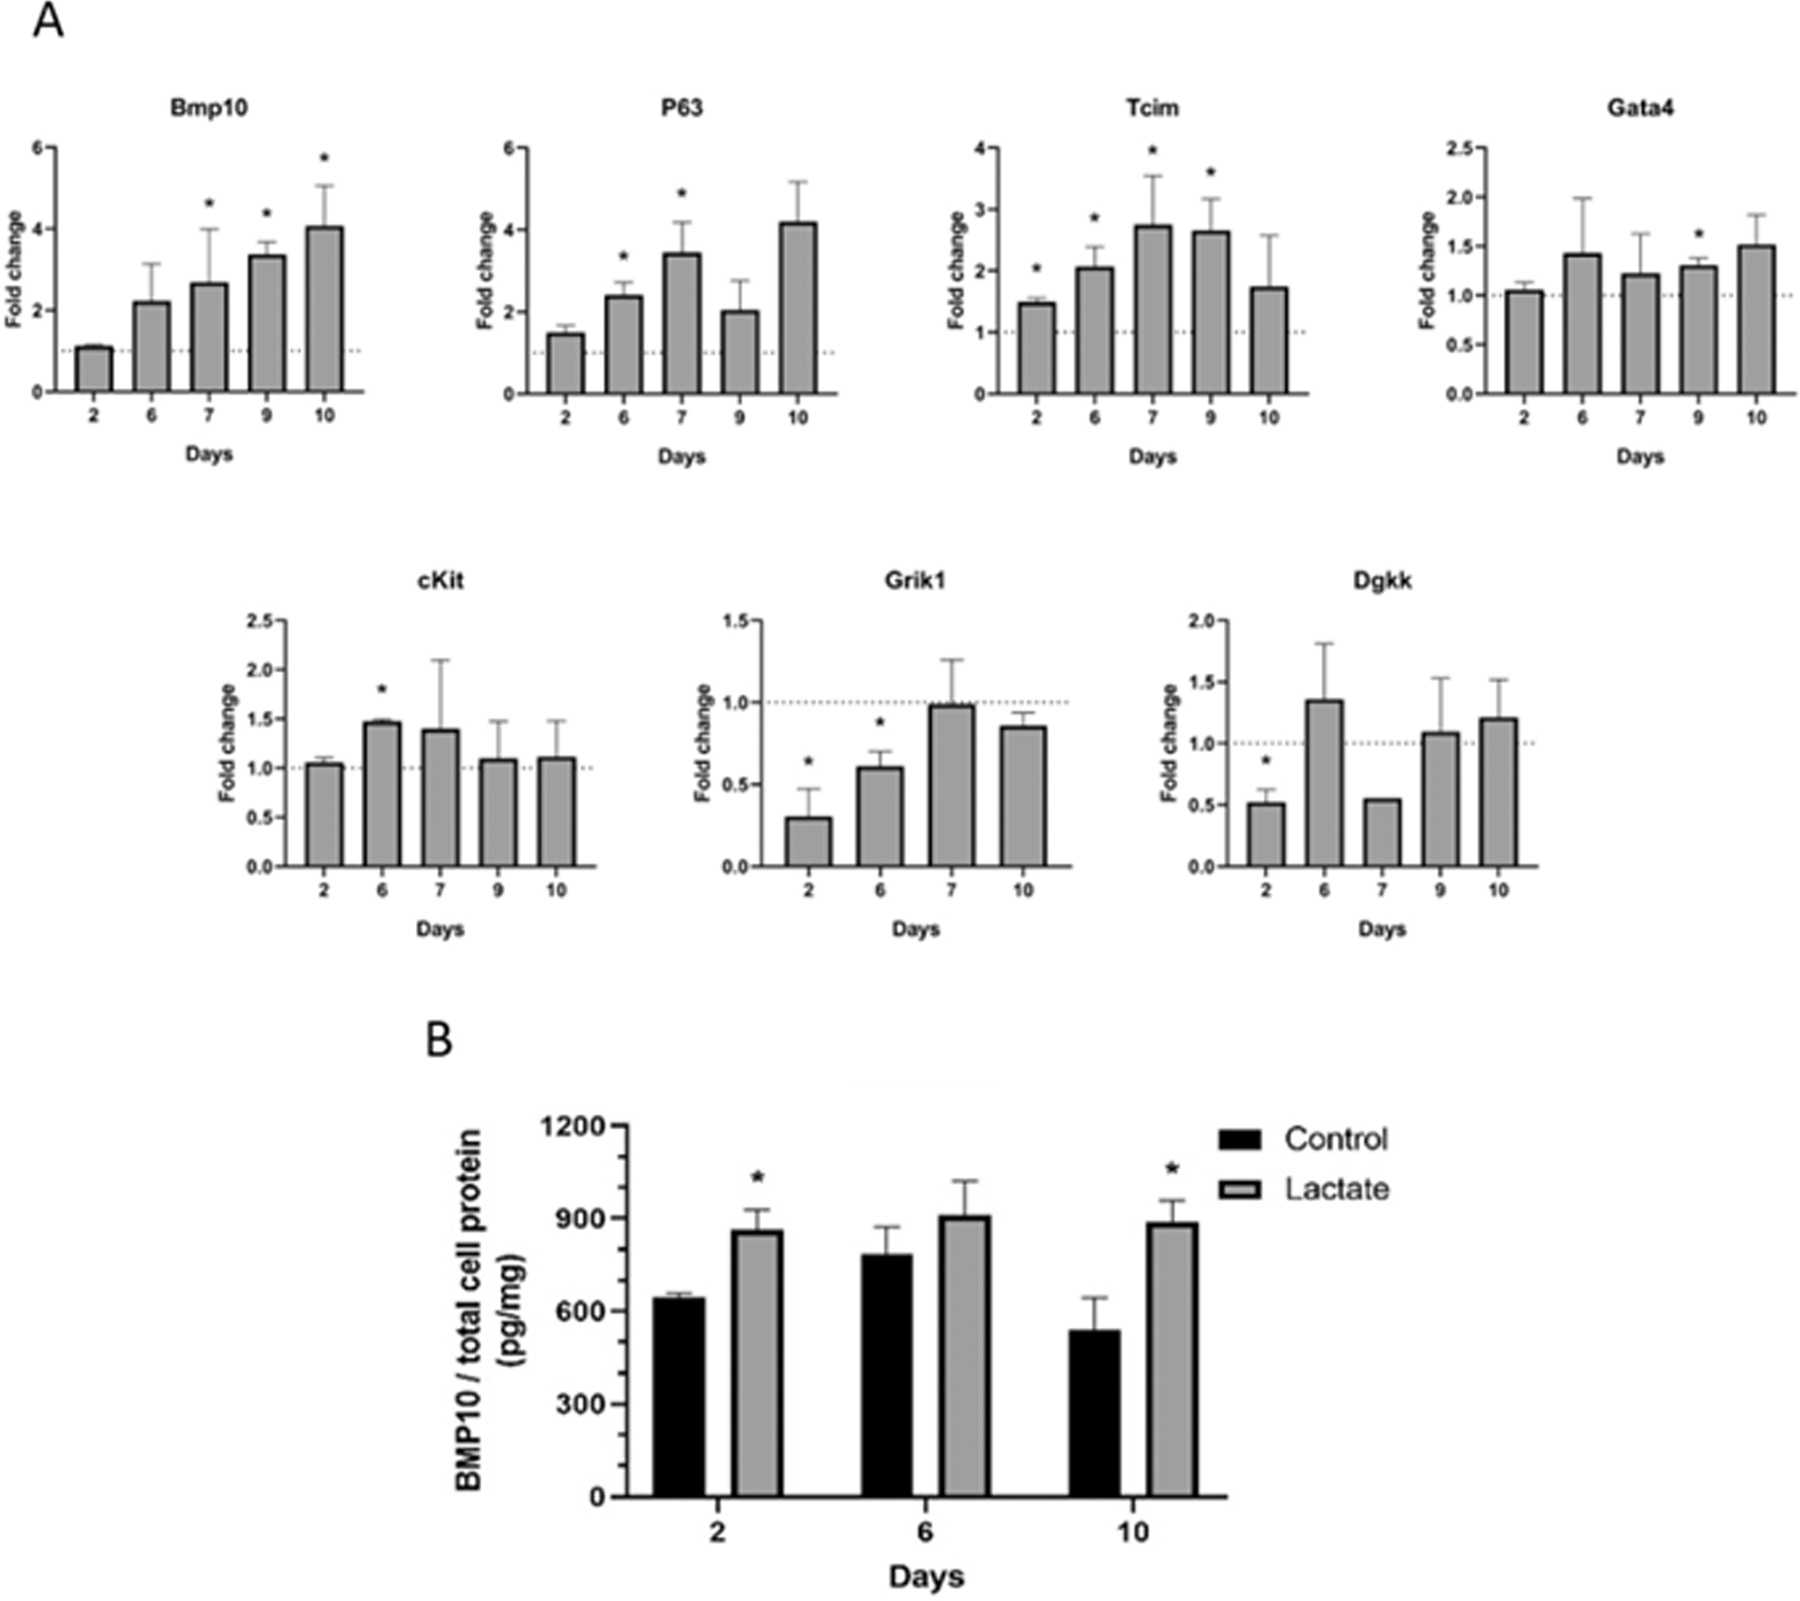
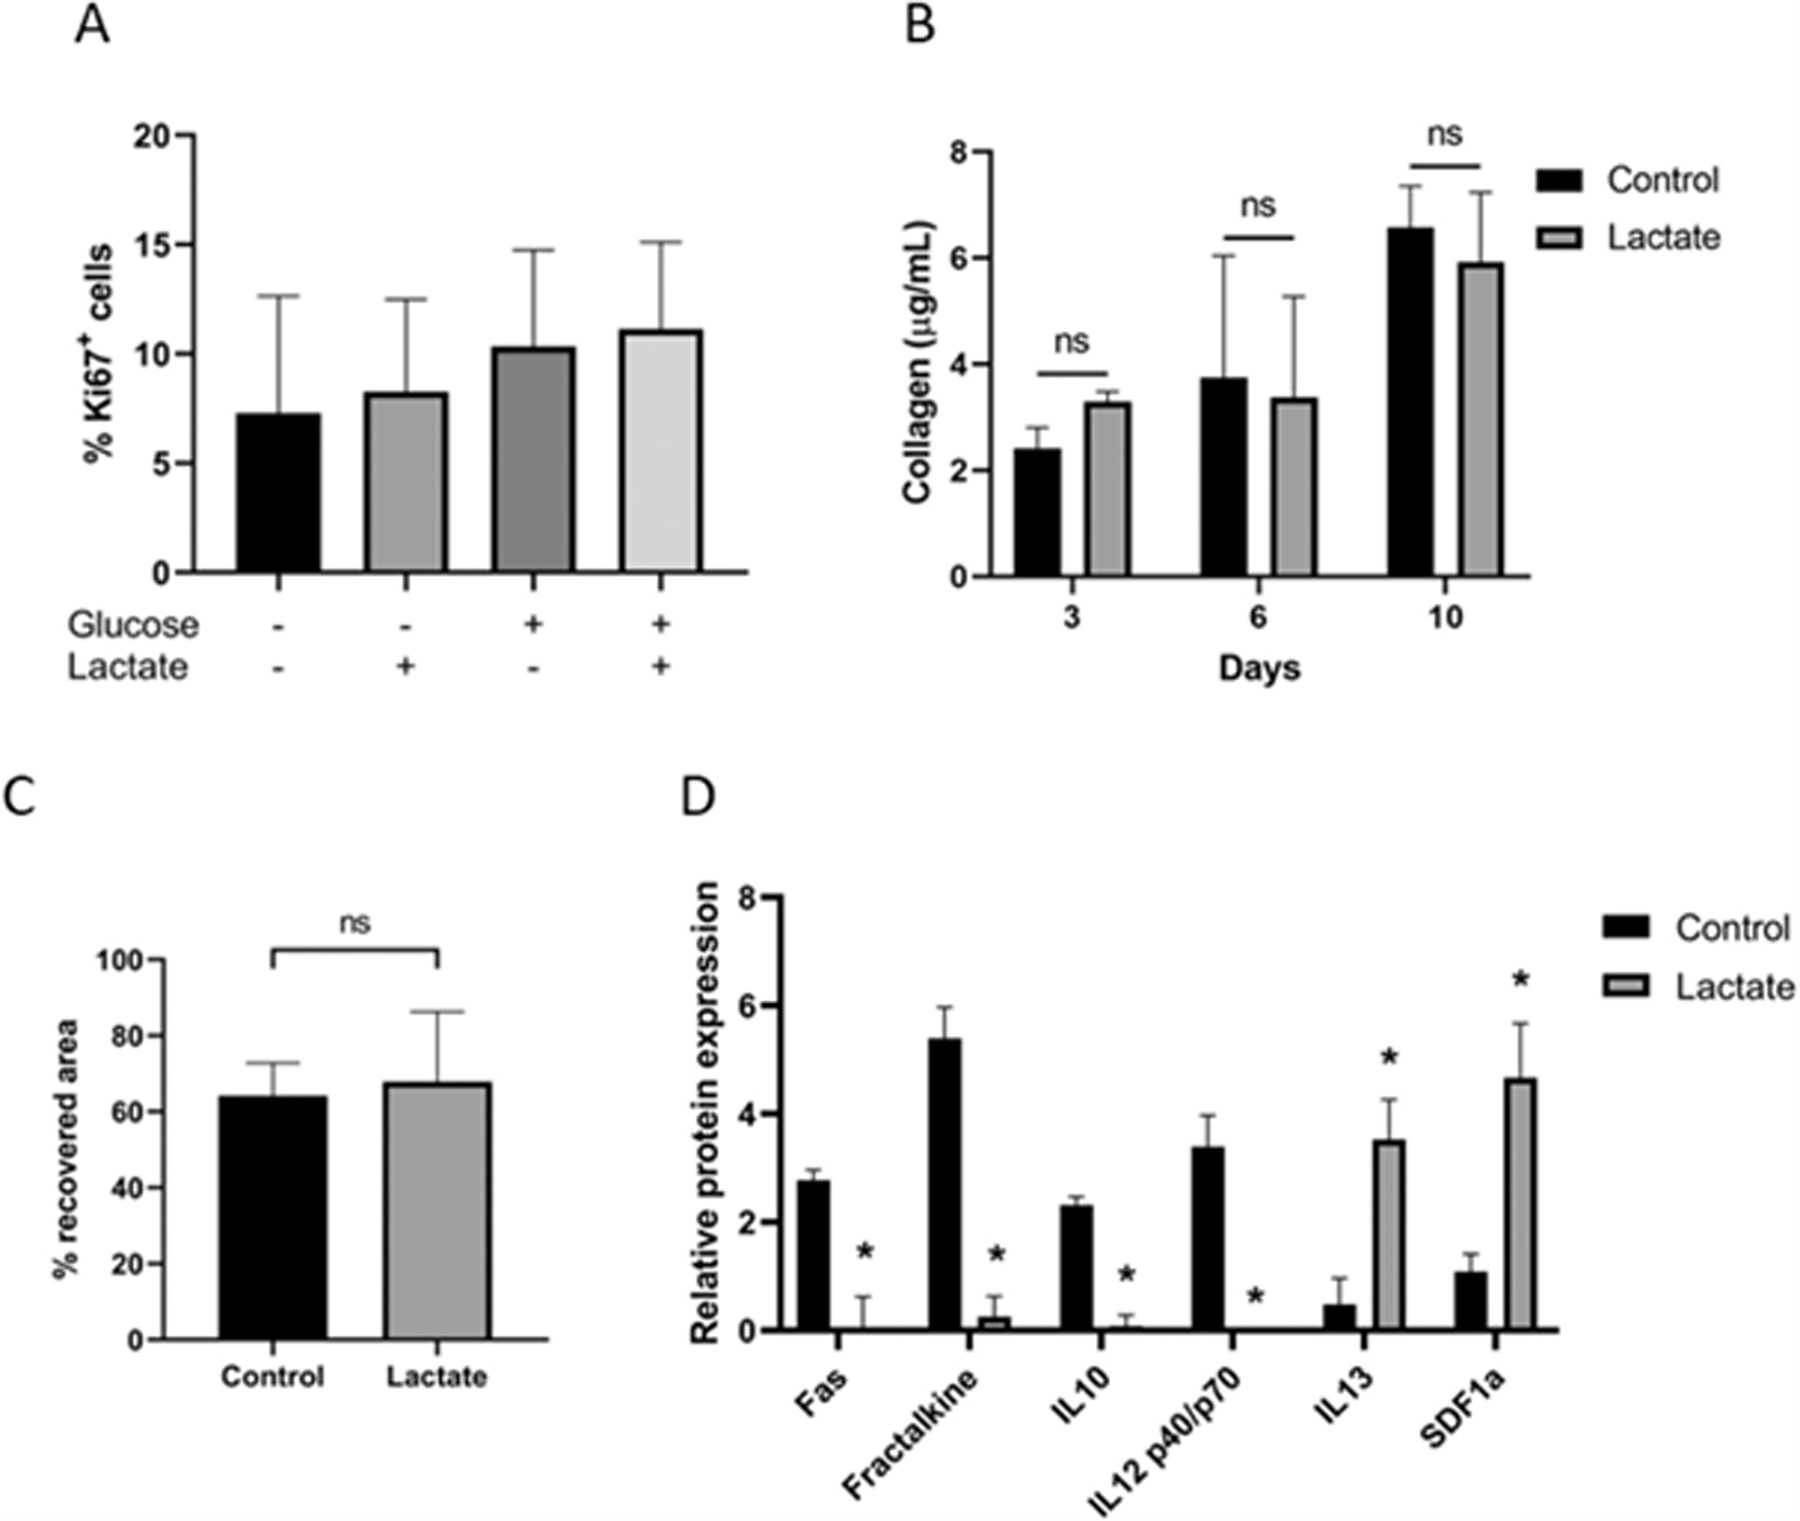
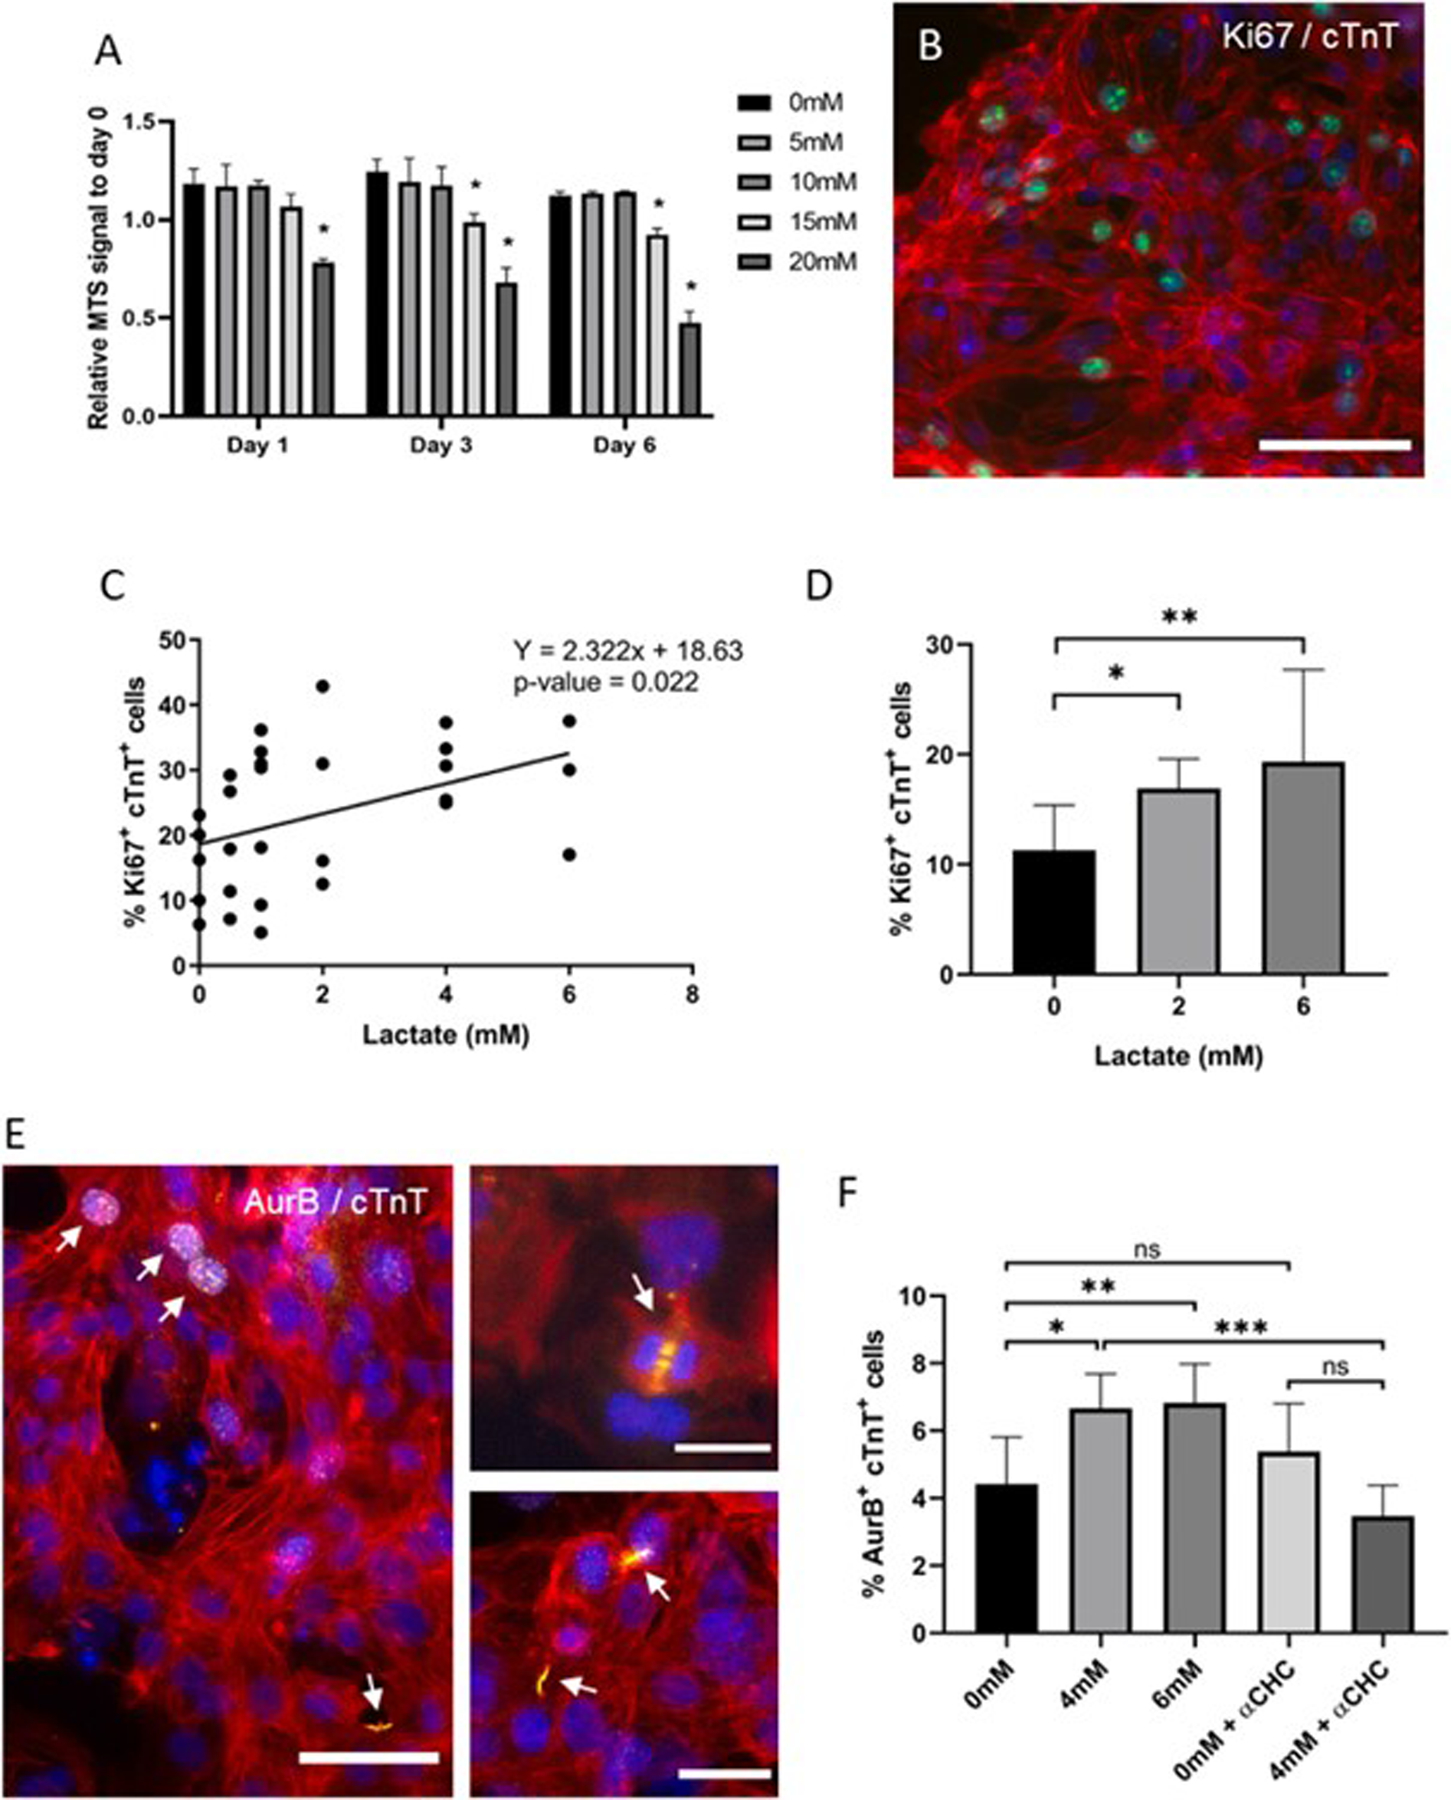
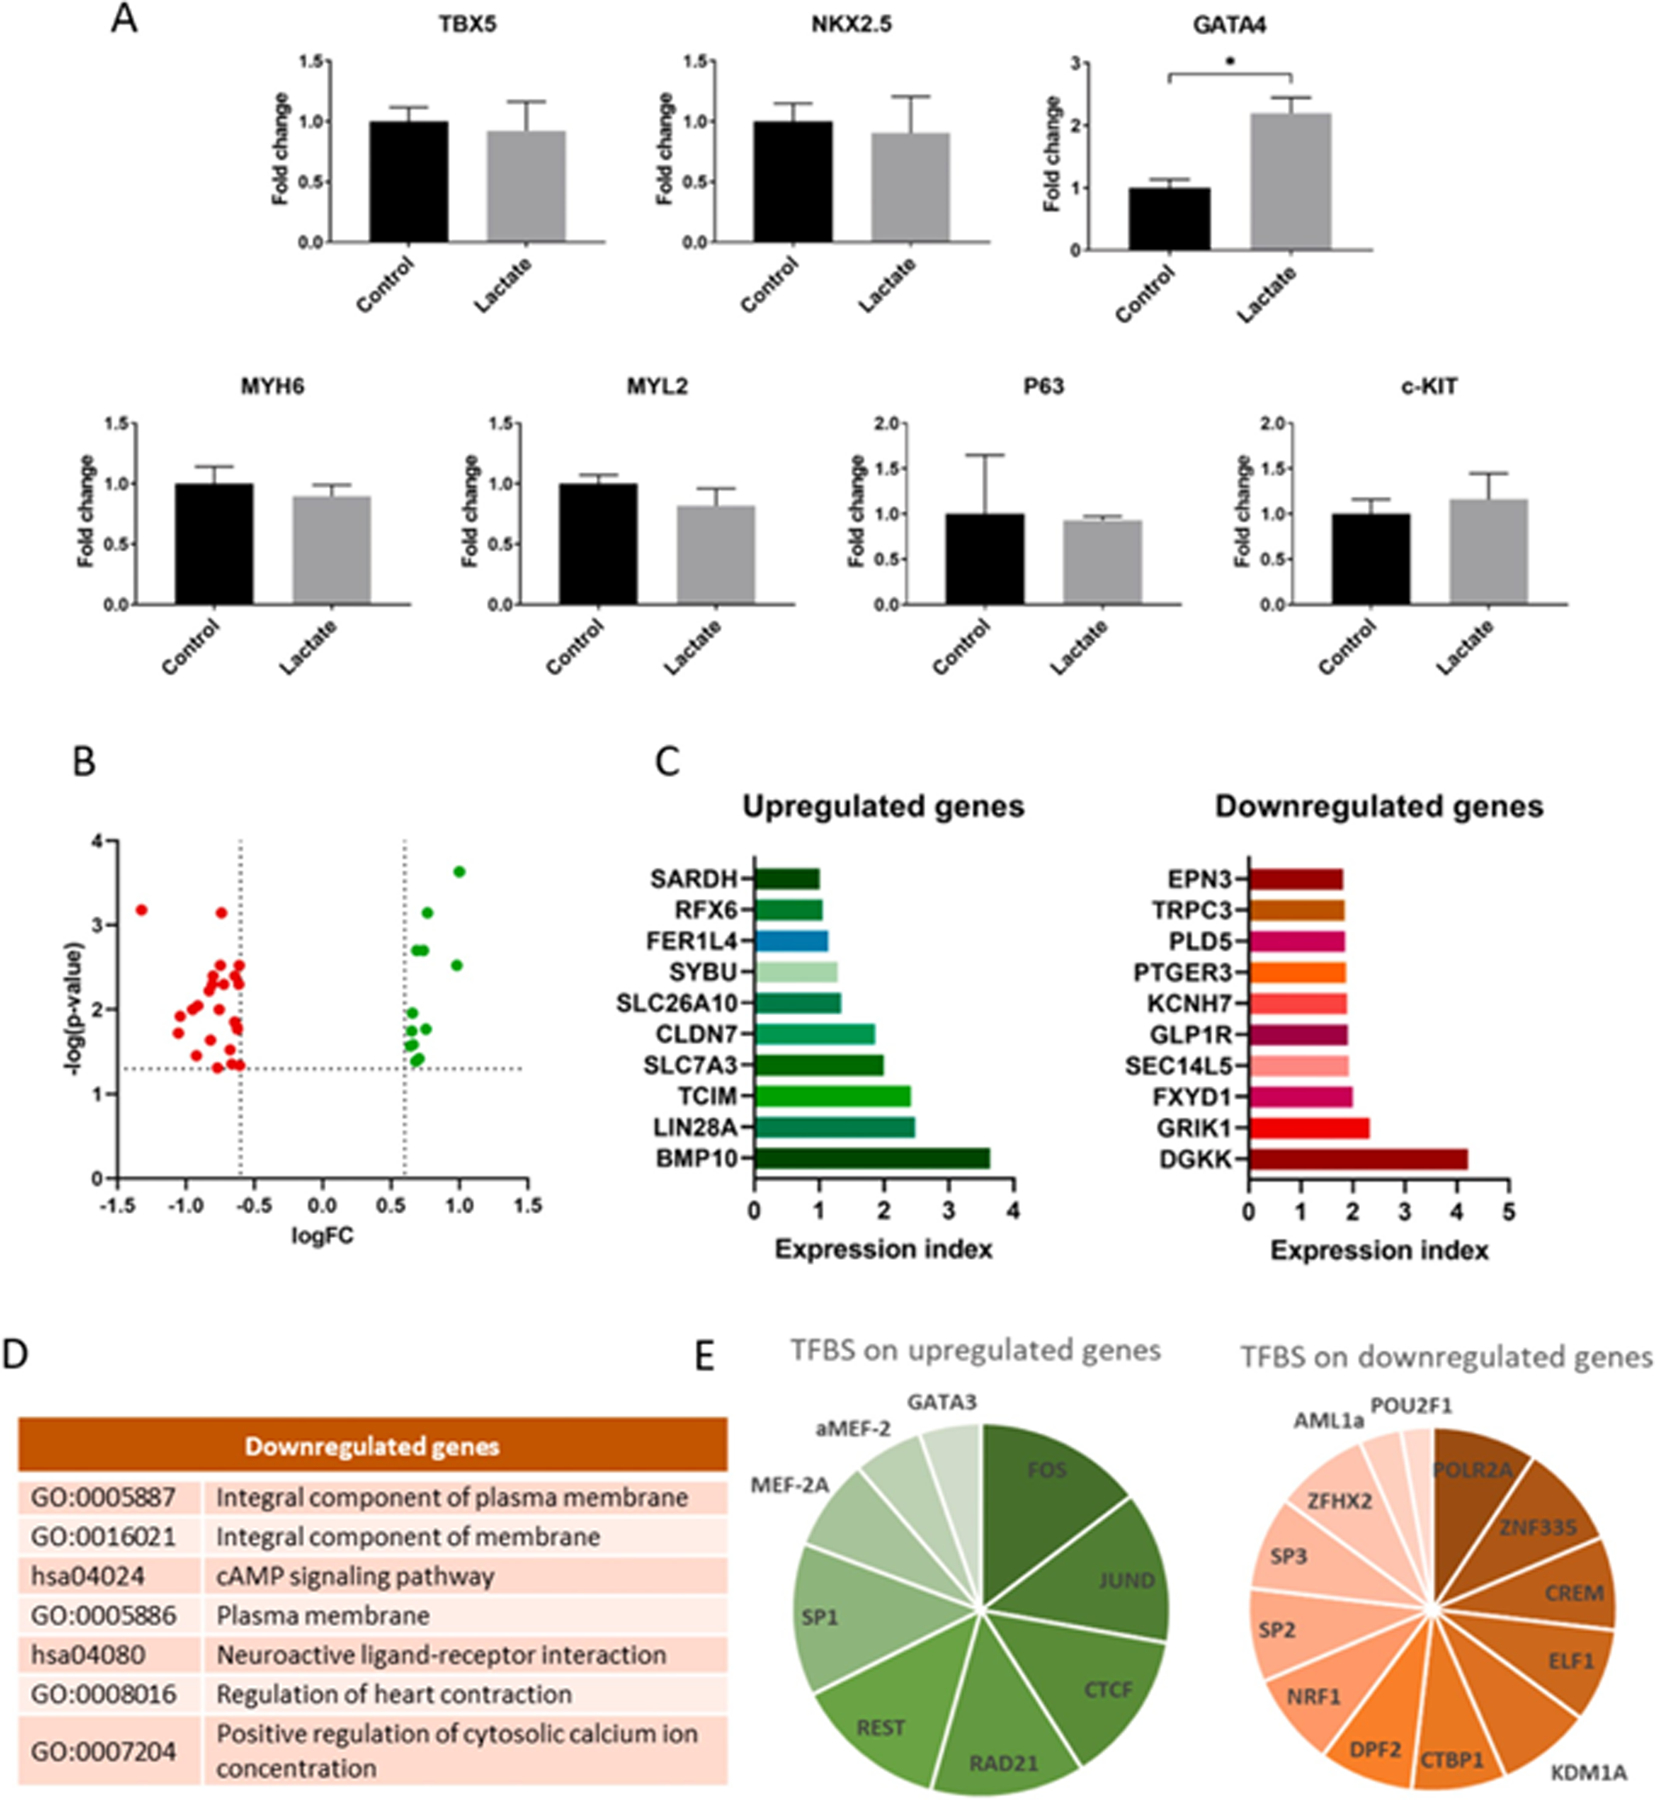
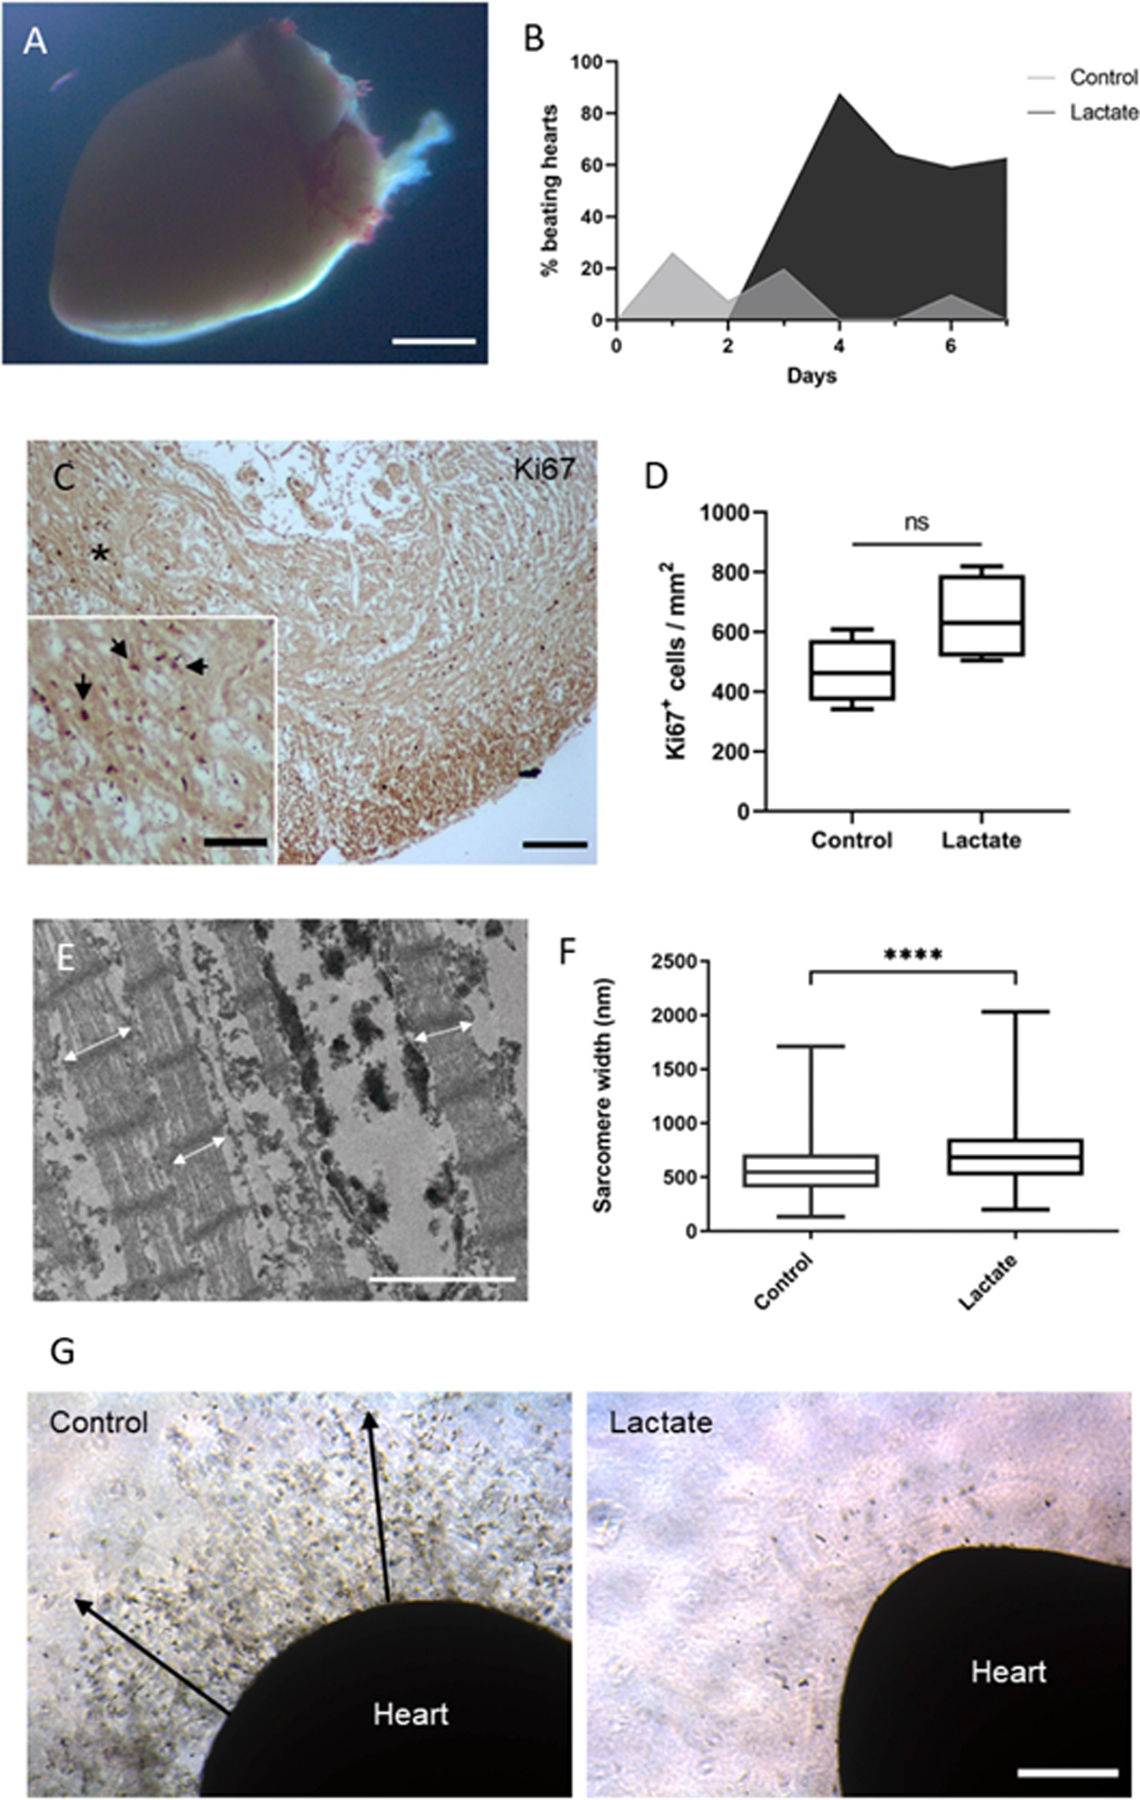
In situ tissue engineering strategies are a promising approach to activate the endogenous regenerative potential of the cardiac tissue helping the heart to heal itself after an injury. However, the current use of complex reprogramming vectors for the activation of reparative pathways challenges the easy translation of these therapies into the clinic. Here, we evaluated the response of mouse neonatal and human induced pluripotent stem cell-derived cardiomyocytes to the presence of exogenous lactate, thus mimicking the metabolic environment of the fetal heart. An increase in cardiomyocyte cell cycle activity was observed in the presence of lactate, as determined through Ki67 and Aurora-B kinase. Gene expression and RNA-sequencing data revealed that cardiomyocytes incubated with lactate showed upregulation of BMP10, LIN28 or TCIM in tandem with downregulation of GRIK1 or DGKK among others. Lactate also demonstrated a capability to modulate the production of inflammatory cytokines on cardiac fibroblasts, reducing the production of Fas, Fraktalkine or IL-12p40, while stimulating IL-13 and SDF1a. In addition, the generation of a lactate-rich environment improved ex vivo neonatal heart culture, by affecting the contractile activity and sarcomeric structures and inhibiting epicardial cell spreading. Our results also suggested a common link between the effect of lactate and the activation of hypoxia signaling pathways. These findings support a novel use of lactate in cardiac tissue engineering, modulating the metabolic environment of the heart and thus paving the way to the development of lactate-releasing platforms for in situ cardiac regeneration.

Keywords: Cardiac tissue engineering; Cardiomyocytes; Cell cycle; Induced pluripotent stem cells; Lactate; Metabolic environment.


Conflict of interest statement

Declaration of competing interest

The authors declare that they have no known competing financial interests or personal relationships that could have appeared to influence the work reported in this paper.

Figures

Fig. 1.
Fig. 1.. Effect of lactate on mouse cardiomyocyte cell cycle activity.
(A) Live/dead assay of cardiomyocytes after 7 days of incubation with 0 or 20 mM of lactate. Green (left) and red (right) channels showing alive and death cells respectively; scale bar: 200 μm. (B) LDH detection on culture media of cardiomyocytes incubated with 0 or 20 mM of lactate. Data are expressed as % of cell death compared to maximum LDH released by lysed cells (100 %). n = 3. (C) Ki67 immunostaining on cardiac cells after 3 days of culture with (+) or without (−) lactate. In this case, glucose-containing (Glucose +) and glucose-depleted (Glucose -) cell culture media was used. Red: cardiac Troponin T (cTnT), green: Ki67. Only Ki67+cTnT+ cells (white arrows) were quantified; scale bar: 100 μm. (D) Quantification of Ki67+cTnT+ cells after 3 days of culture with (+) or without (−) lactate in glucose-containing (Glucose +) or glucose-depleted (Glucose -) cell culture media. Data are represented as % of Ki67+cTnT+ cells to the total number of cTnT+ cells. Results are from 3 independent cell cultures and around 1200 cardiomyocytes were analyzed for each group. One-way ANOVA, ***p < 0.001, ****p < 0.0001. (E) Aurora-B kinase immunostaining on mouse cardiomyocytes. White arrows indicate AurB+cTnT+ cells. Yellow: AurB, red: cTnT, blue: nuclei; scale bar: 25 μm. (F) Quantification of AurB-positive cardiomyocytes after 10 days of culture with 20 mM of lactate supplemented into glucose-containing cell media. Data are represented as % of AurB+cTnT+ to the total number of cTnT+ cells. Results are from 4 independent cell cultures and around 4000 cardiomyocytes were analyzed for each group. Student’s t-test, *p < 0.05.
Fig. 2.
Fig. 2.. Gene expression of mouse cardiomyocytes exposed to lactate.
(A) Relative gene expression on cardiomyocytes cultured with 20 mM lactate as compared to the gene expression levels in the absence of lactate (dashed line). Results are from 1 to 4 independent experiments performed on different days. Data were analyzed using Student’s t-test compared to control without lactate for each timepoint, *p < 0.05. (B) BMP10 protein quantification from cell lysate at different timepoints. Student’s t-test compared to control without lactate of the same timepoint, *p < 0.05; n = 3. All experiments were performed in glucose-containing cell culture media.
Fig. 3.
Fig. 3.. Effect of lactate on cardiac fibroblasts.
(A) Quantification of Ki67-positive cells after 3 days of culture with (+) or without (−) lactate in glucose-containing (+) and glucose-depleted (−) cell culture media. Data were analyzed using a one-way ANOVA and represented as % of Ki67+ cells to the total number of cells. Results are from 3 independent cell cultures and at least 214 Ki67+ cells were counted per group. (B) Quantification of total collagen content on cardiac fibroblasts after 3, 6 and 10 days of culture with 0 or 20 mM of lactate. Data were analyzed with a two-way ANOVA, ns: not significant; n = 2. (C) Wound closure of cells cultured with 0 or 20 mM of lactate. Data were measured as % of recovered area after 24 h of scratching and analyzed with a Student’s t-test. Results are from 8 different regions from 2 independent cell cultures. (D) Quantification of inflammatory cytokines (only significant differences are shown, see also Sup. Table 1). Signal expression of each sample was calibrated according to total protein. Internal positive (100) and negative controls (0) were used to generate numerical values of each sample. Results are from 2 independent experiments performed on different days. Student’s t-test of lactate compared to control condition, *p < 0.05.
Fig. 4.
Fig. 4.. Effect of lactate on hiPSC-cardiomyocyte proliferation.
(A) Cell viability in the presence of different concentrations of lactate. MTS signal intensity was corrected to values from day 0. Data were analyzed using a two-way ANOVA, *p < 0.01, n = 3. (B) Immunofluorescent staining of Ki67 on hiPSC-CM. Green: Ki67, blue: nuclei, red: cTnT; scale bar: 150 μm. (C) Quantification of Ki67+cTnT+ cells following 24 h of culture with different concentrations of lactate. Data are represented as % of Ki67+cTnT+ to the total number of cTnT+ cells and was analyzed using simple linear regression. Results are from at least 3 independent cell cultures and an average of 1500 cardiomyocytes were analyzed for each condition. (D) Quantification of Ki67+cTnT+ cells following 4 days of culture with different concentrations of lactate. Data are represented as % of Ki67+cTnT+ to the total number of cTnT+ cells and was analyzed using a one-way ANOVA, *p < 0.05, **p < 0.01. Results are from at least 3 independent cell cultures and at least 582 cardiomyocytes were counted per group. (E) Aurora-B immunostaining on hiPSC-cardiomyocytes. White arrows indicate AurB+cTnT+ cells. Red: cardiac Troponin T (cTnT), yellow: Aurora-B, blue: nuclei; scale bars: 50 μm (left) and 25 μm (top and bottom right). (F) Quantification of AurB+cTnT+ cells after 7 days of incubation with lactate at 0, 4 or 6 mM concentration. 1 mM of α-cyano-4-hydroxycinnamic acid (αCHC) was used as inhibitor of MCT1. Data are represented as % of AurB+cTnT+ to the total number of cTnT+ cells and it was analyzed using a one-way ANOVA, *p < 0.05, **p < 0.01, ***p < 0.001. Results are from at least 6 independent cell cultures and an average of 4400 cardiomyocytes were counted per group.
Fig. 5.
Fig. 5.. Gene expression and transcriptome analysis of hiPSC-CM.
(A) Relative gene expression of cardiomyocytes cultured with 0 or 6 mM of lactate for 3 days. Results are from 3 independent cell cultures and data were analyzed using a student’s t-test, *p < 0.05. (B) Volcano plot showing differentially expressed (DE) genes from transcriptome sequencing from cardiomyocytes cultured with 0 or 6 mM of lactate during 7 days. Dashed lines represent DE thresholds used (0.6 log fold change cutoff and 0.05 p-value). Green: upregulated genes; red: downregulated genes; FC: fold change. (C) Top 10 up- and downregulated DE genes according to the expression index, the product of log(p-value) and logFC. (D) Gene ontologies (GO) and KEGG pathways associated to top downregulated genes (DAVID database, p < 0.05). (E) Summary of common transcription factors binding sites (TFBS) found on upregulated and downregulated genes, according to the number of genes in which the TFBS is found. All upregulated DE genes were used for the analysis, while only top downregulated genes were used. Data obtained from GeneCards® database. See also Sup.Tables 3 and 4.
Fig. 6.
Fig. 6.. Ex vivo heart culture.
(A) Stereomicroscope image of a cultured neonatal mouse heart embedded in Matrigel® matrix. Scale bar: 1 mm. (B) Fraction of ex vivo hearts showing spontaneous contraction (beating) activity at any region of the organ. 50 neonatal mouse hearts were evaluated. (C) Immunohistochemistry staining of Ki67 on a cross-section of a neonatal mouse heart cultured ex vivo for 9 days. Black arrows indicate positive Ki67 nuclei on a higher magnification image of the (*) region. Scale bar: 100 μm and 50 μm (magnification). (D) Quantification of Ki67-positive cells on tissue sections from ex vivo hearts incubated with 0 or 20 mM of lactate for 9 days. Data were analyzed using a student’s t-test, ns: non-significant, p = 0.097, n = 4 hearts. (E) Transmission electron microscopy image of a cardiac tissue section from an ex vivo cultured heart after 4 days. White arrows indicate sarcomere width. Scale bar: 2 μm. (F) Quantification of sarcomere width from ex vivo hearts incubated with 0 or 20 mM of lactate for 4 days. Data were analyzed with a student’s t-test with Welch’s correction, ****p < 0.0001. n = 4 hearts, and over 800 sarcomeres were measured per group. (G) Optical microscopy images of ex vivo hearts cultured with 0 or 20 mM of lactate for 9 days. Heart cells spread to the surrounding matrix on control hearts (black arrows). Scale bar: 400 μm.

References

    1. Mendis S, Puska P, Norrving B, Global atlas on cardiovascular disease prevention and control, World Heal. Organ (2011) 2–14, https://doi.org/NLM classification: WG 120.
    1. Bobi J, Solanes N, Fernández-Jiménez R, Galán-Arriola C, Dantas AP, Fernández-Friera L, Gálvez-Montó C, Rigol-Monzó E, Agüero J, Ramírez J, Roque M, Bayes-Genís A, Sanchez-Gonzalez J, García-Alvarez A, Sabate M, Roura S, Ibanez B, Rigol M, Intracoronary administration of allogeneic adipose tissue-derived mesenchymal stem cells improves myocardial perfusion but not left ventricle function, in a translational model of acute myocardial infarction, J. Am. Heart Assoc 6 (2017), 10.1161/JAHA.117.005771. - DOI - PMC - PubMed
    1. Aguirre A, Montserrat N, Zacchigna S, Nivet E, Hishida T, Krause MN, Kurian L, Ocampo A, Vazquez-Ferrer E, Rodriguez-Esteban C, Kumar S, Moresco JJ, Yates JR, Campistol JM, Sancho-Martinez I, Giacca M, Izpisua Belmonte JC, In vivo activation of a conserved microRNA program induces mammalian heart regeneration, Cell Stem Cell 15 (2014) 589–604, 10.1016/j.stem.2014.10.003. - DOI - PMC - PubMed
    1. Liu B, Lee BW, Nakanishi K, Villasante A, Williamson R, Metz J, Kim J, Kanai M, Bi L, Brown K, Di Paolo G, Homma S, Sims PA, Topkara VK, Vunjak-Novakovic G, Cardiac recovery via extended cell-free delivery of extracellular vesicles secreted by cardiomyocytes derived from induced pluripotent stem cells, Nat. Biomed. Eng 2 (2018) 293–303, 10.1038/s41551-018-0229-7. - DOI - PMC - PubMed
    1. Tzahor E, Poss KD, Cardiac regeneration strategies: staying young at heart, Science (80-.) 356 (2017) 1035–1039, 10.1126/science.aam5894. - DOI - PMC - PubMed