

Unsupervised machine learning demonstrates the prognostic value of TAPSE/PASP ratio among hospitalized patients with COVID-19
- PMID: 35907784
- PMCID: PMC10687738
- DOI: 10.1111/echo.15432
Unsupervised machine learning demonstrates the prognostic value of TAPSE/PASP ratio among hospitalized patients with COVID-19
Abstract
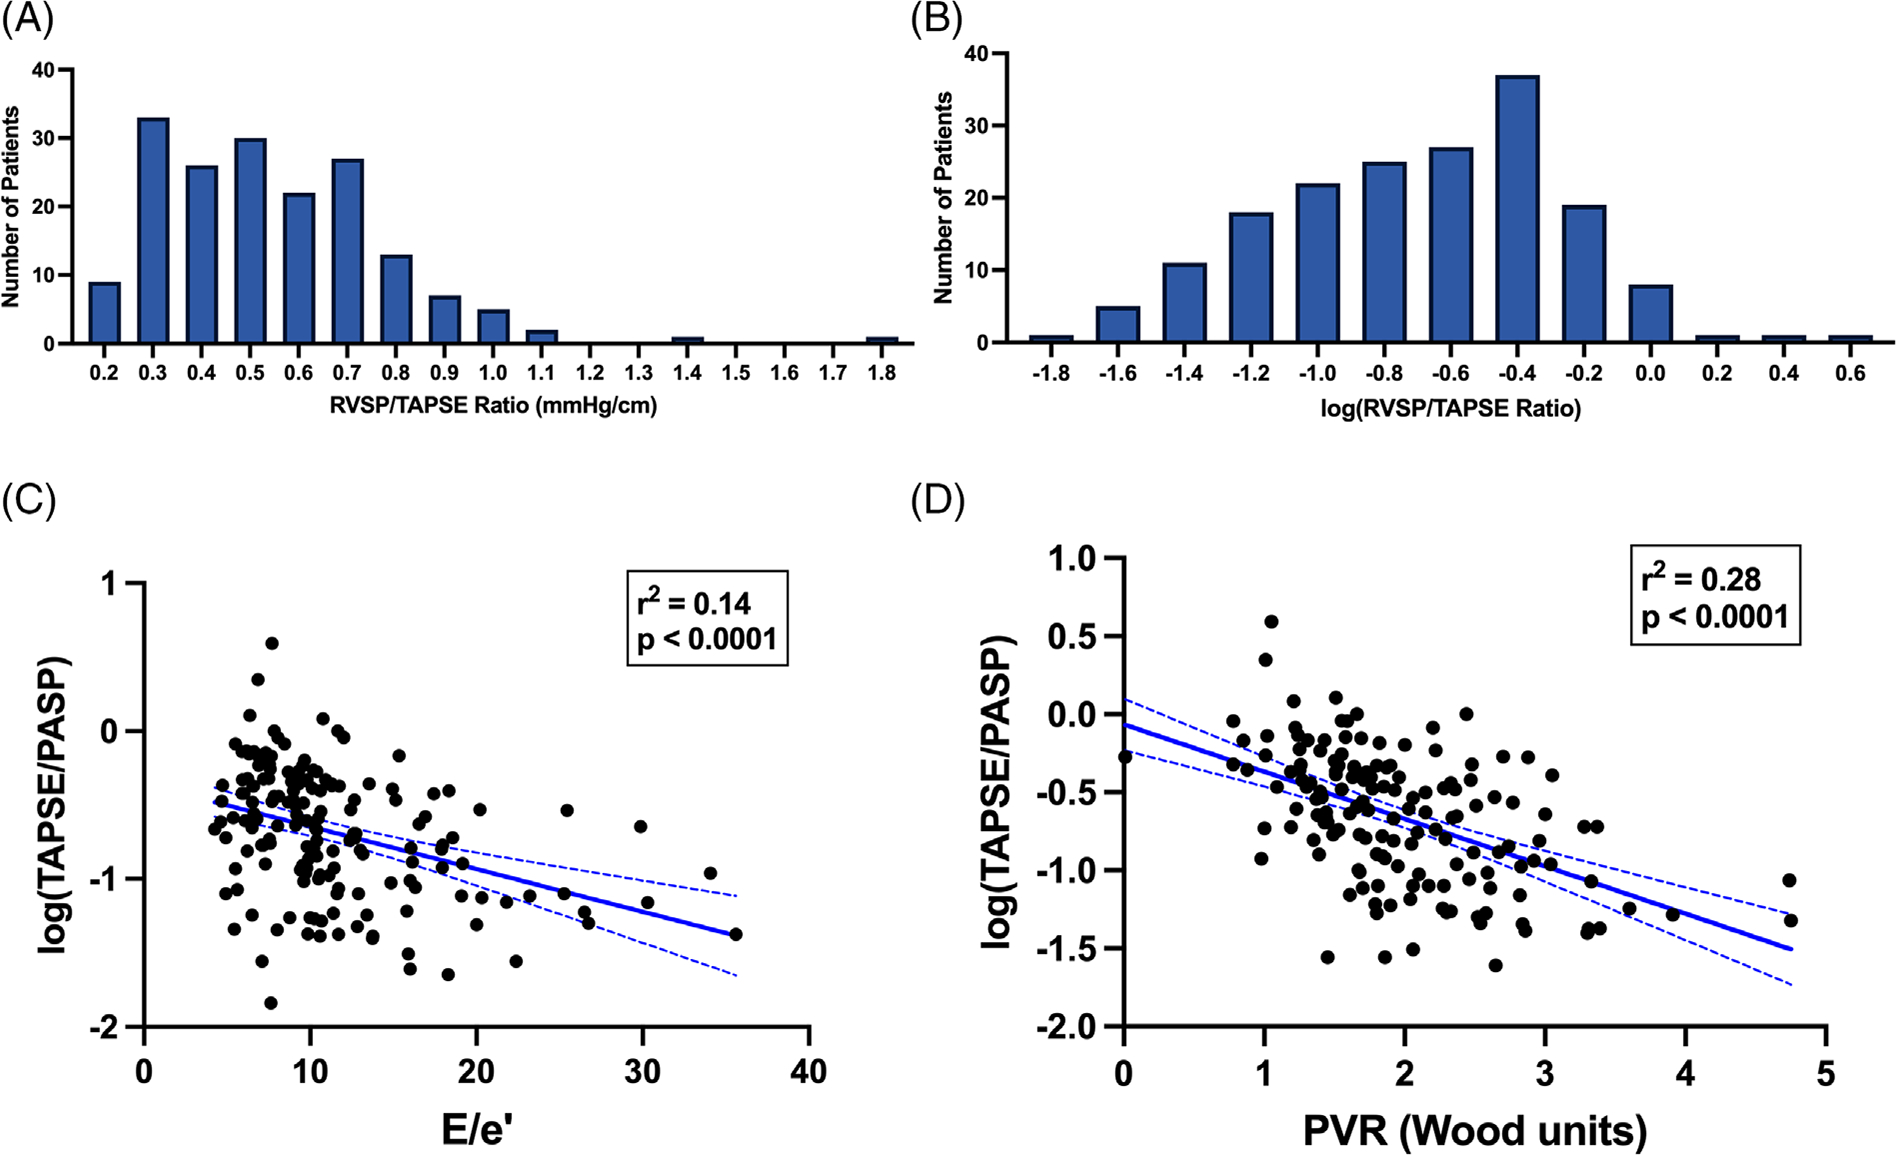
Background: The ratio of tricuspid annular plane systolic excursion (TAPSE) to pulmonary artery systolic pressure (PASP) is a validated index of right ventricular-pulmonary arterial (RV-PA) coupling with prognostic value. We determined the predictive value of TAPSE/PASP ratio and adverse clinical outcomes in hospitalized patients with COVID-19.
Methods: Two hundred and twenty-nine consecutive hospitalized racially/ethnically diverse adults (≥18 years of age) admitted with COVID-19 between March and June 2020 with clinically indicated transthoracic echocardiograms (TTE) that included adequate tricuspid regurgitation (TR) velocities for calculation of PASP were studied. The exposure of interest was impaired RV-PA coupling as assessed by TAPSE/PASP ratio. The primary outcome was in-hospital mortality. Secondary endpoints comprised of ICU admission, incident acute respiratory distress syndrome (ARDS), and systolic heart failure.
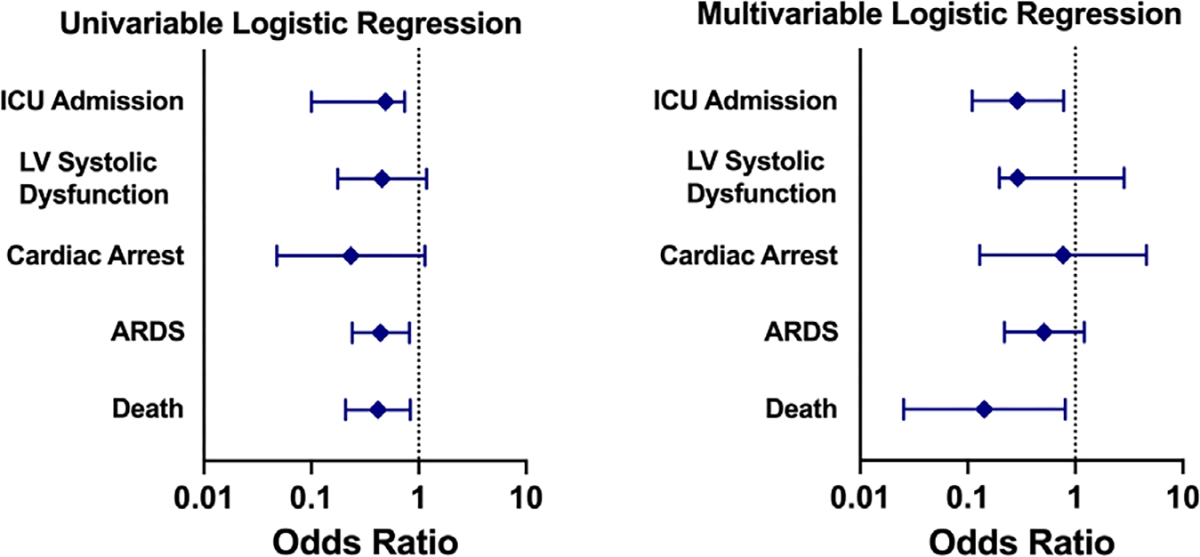
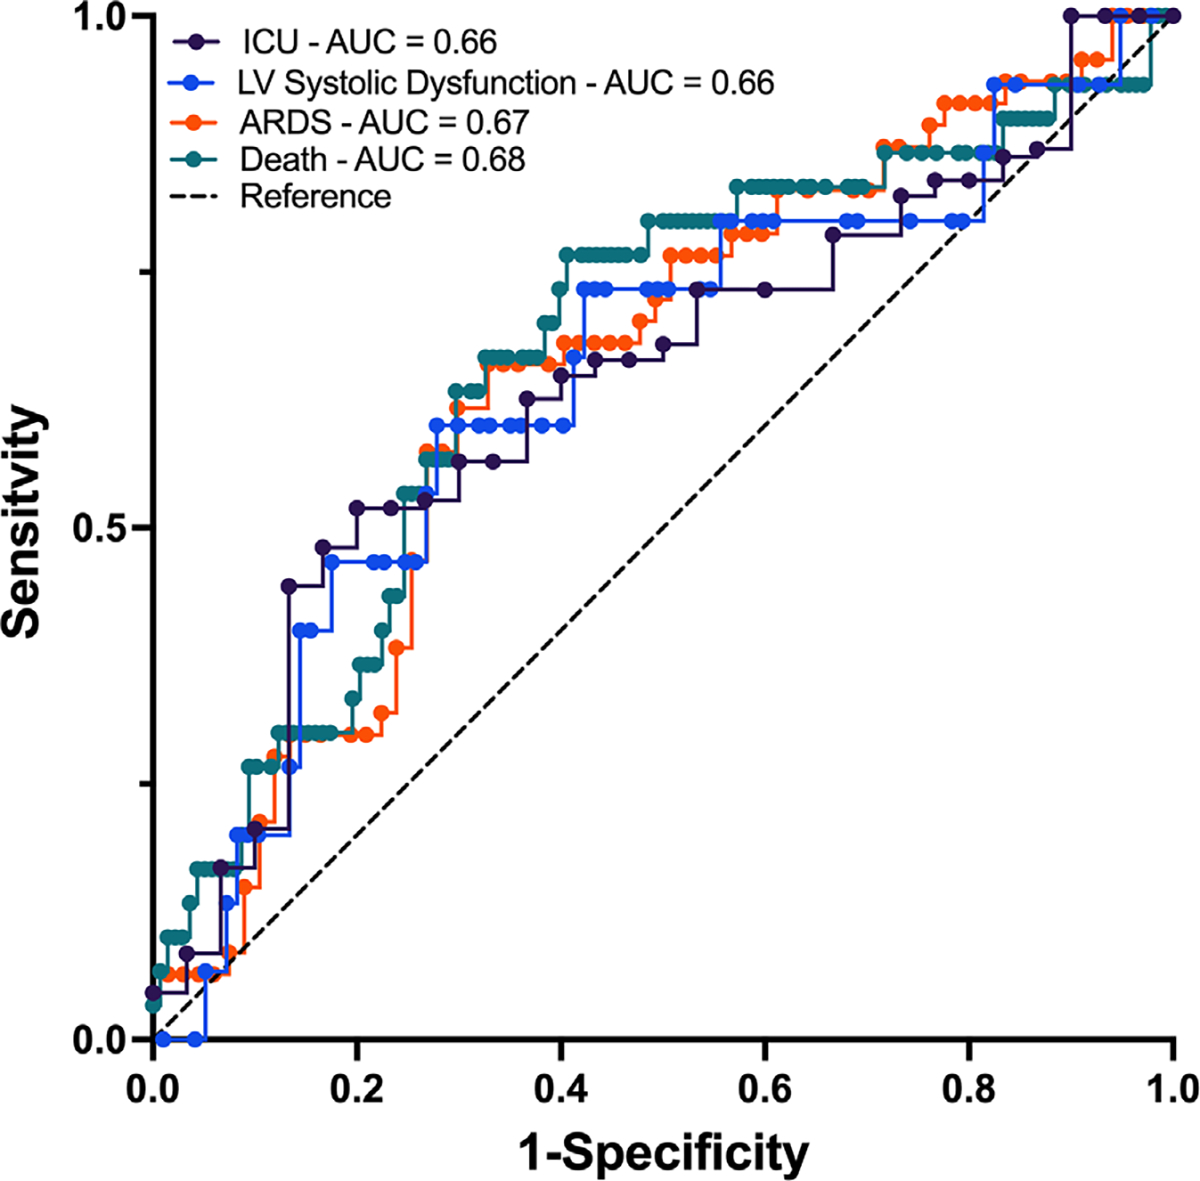
Results: One hundred and seventy-six patients had both technically adequate TAPSE measurements and measurable TR velocities for analysis. After adjustment for age, sex, BMI, race/ethnicity, diabetes mellitus, and smoking status, log(TAPSE/PASP) had a significantly inverse association with ICU admission (p = 0.015) and death (p = 0.038). ROC analysis showed the optimal cutoff for TAPSE/PASP for death was 0.51 mm mmHg-1 (AUC = 0.68). Unsupervised machine learning identified two groups of echocardiographic function. Of all echocardiographic measures included, TAPSE/PASP ratio was the most significant in predicting in-hospital mortality, further supporting its significance in this cohort.
Conclusion: Impaired RV-PA coupling, assessed noninvasively via the TAPSE/PASP ratio, was predictive of need for ICU level care and in-hospital mortality in hospitalized patients with COVID-19 suggesting utility of TAPSE/PASP in identification of poor clinical outcomes in this population both by traditional statistical and unsupervised machine learning based methods.
Keywords: COVID-19; echocardiography; right ventricular failure.
© 2022 Wiley Periodicals LLC.
Conflict of interest statement
CONFLICT OF INTEREST
There is no potential conflict of interest, real or perceived, by the authors.
Figures
References
-
- Vonk Noordegraaf A, Westerhof BE, Westerhof N. The relationship between the right ventricle and its load in pulmonary hypertension. J Am Coll Cardiol. 2017;69:236–243. - PubMed
-
- Sanz J, Sánchez-Quintana D, Bossone E, Bogaard HJ, Naeije R. Anatomy, function, and dysfunction of the right ventricle: JACC state-of-the-art review. J Am Coll Cardiol. 2019;73:1463–1482. - PubMed
-
- Tello K, Axmann J, Ghofrani HA, et al. Relevance of the TAPSE/PASP ratio in pulmonary arterial hypertension. Int J Cardiol. 2018;266:229–235. - PubMed
MeSH terms
Grants and funding
LinkOut - more resources
Full Text Sources
Medical
