. 2022 Jul 30;20(1):352.
doi: 10.1186/s12951-022-01542-2.

Iron oxide and iron oxyhydroxide nanoparticles impair SARS-CoV-2 infection of cultured cells

Affiliations

Iron oxide and iron oxyhydroxide nanoparticles impair SARS-CoV-2 infection of cultured cells

Marta L DeDiego et al. J Nanobiotechnology. .

Abstract

Background: Coronaviruses usually cause mild respiratory disease in humans but as seen recently, some human coronaviruses can cause more severe diseases, such as the Severe Acute Respiratory Syndrome Coronavirus 2 (SARS-CoV-2), the global spread of which has resulted in the ongoing coronavirus pandemic.

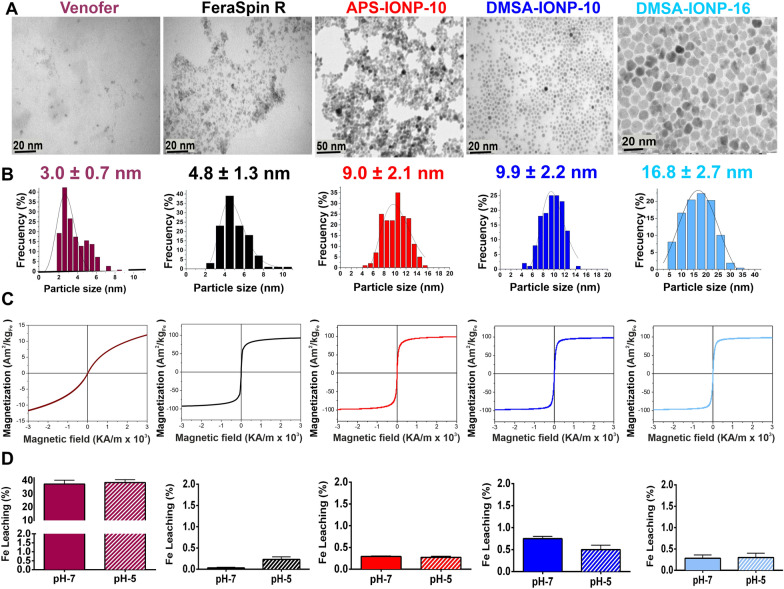
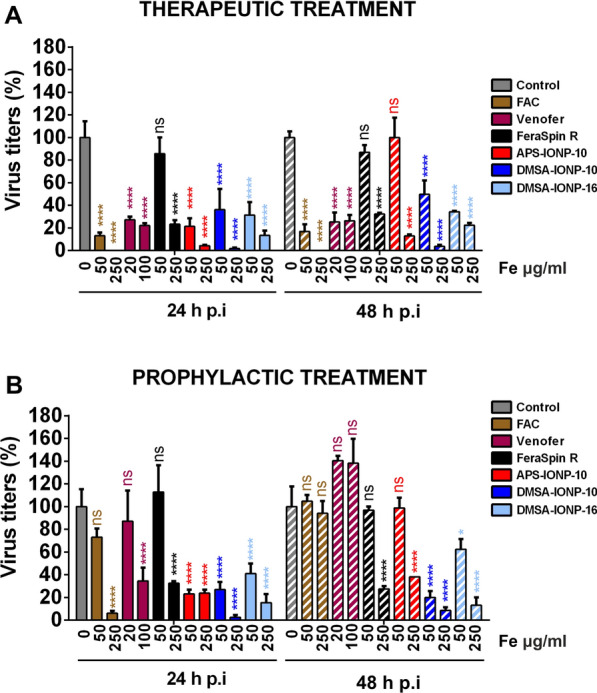
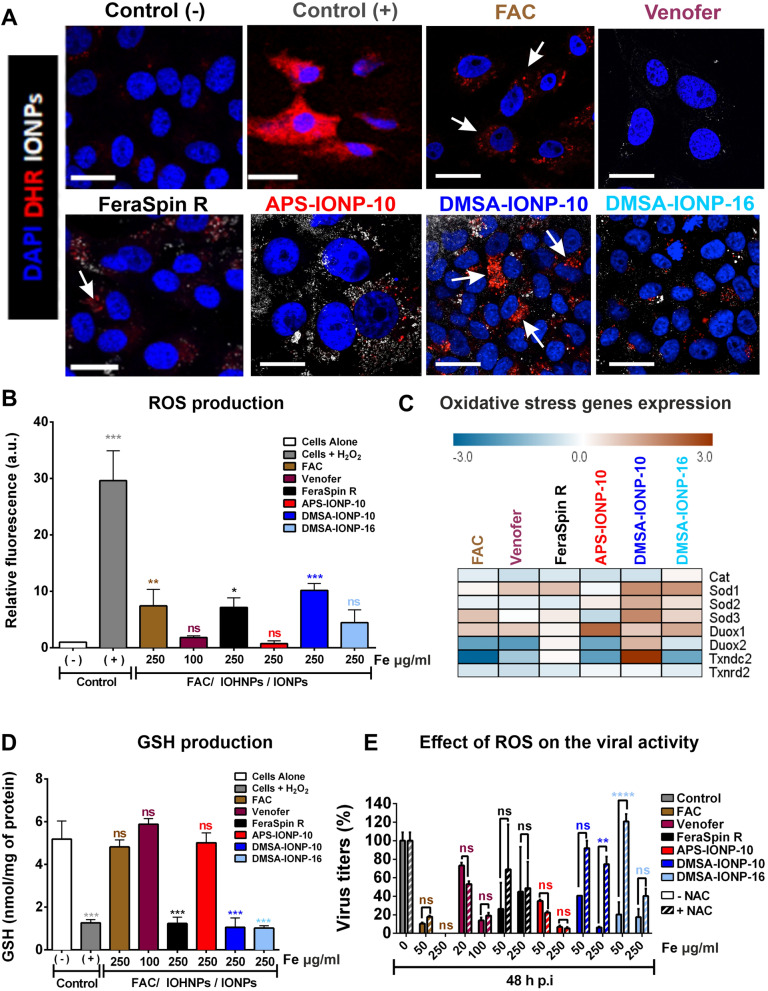
Results: In this study we analyzed the potential of using iron oxide nanoparticles (IONPs) coated with biocompatible molecules like dimercaptosuccinic acid (DMSA), 3-aminopropyl triethoxysilane (APS) or carboxydextran (FeraSpin™ R), as well as iron oxyhydroxide nanoparticles (IOHNPs) coated with sucrose (Venofer®), or iron salts (ferric ammonium citrate -FAC), to treat and/or prevent SARS-CoV-2 infection. At non-cytotoxic doses, IONPs and IOHNPs impaired virus replication and transcription, and the production of infectious viruses in vitro, either when the cells were treated prior to or after infection, although with different efficiencies. Moreover, our data suggest that SARS-CoV-2 infection affects the expression of genes involved in cellular iron metabolism. Furthermore, the treatment of cells with IONPs and IOHNPs affects oxidative stress and iron metabolism to different extents, likely influencing virus replication and production. Interestingly, some of the nanoparticles used in this work have already been approved for their use in humans as anti-anemic treatments, such as the IOHNP Venofer®, and as contrast agents for magnetic resonance imaging in small animals like mice, such as the FeraSpin™ R IONP.

Conclusions: Therefore, our results suggest that IONPs and IOHNPs may be repurposed to be used as prophylactic or therapeutic treatments in order to combat SARS-CoV-2 infection.

Keywords: Anti-anemic; Iron metabolism; Iron oxide nanoparticles; Iron oxyhydroxide nanoparticles; MRI contrast agents; Oxidative stress; SARS-CoV-2; Viral infection; Viral replication.


Conflict of interest statement

The authors have no competing financial interests to declare.

Figures

Fig. 1
Fig. 1
Physicochemical characterization of the different nanoparticles used. A TEM images of the iron oxide nanoparticles used, scale bar: 20–50 nm. B Nanoparticle size distribution and Gaussian fitting. C Magnetization curve at RT for the IONPs showing their superparamagnetic behavior. D Data related to iron leaching from the iron oxide under the specified conditions (pH 7 or 5), depending on the size and on the type of coating
Fig. 2
Fig. 2
Evaluation of FAC, Venofer and IONP toxicity, and quantification of dead Vero E6 cells. A Viability of Vero E6 cells after treatment with FAC, Venofer or IONPs, as measured with the PrestoBlue fluorometric test. B and C TUNEL staining analysis of the proportion of dead Vero E6 cells after incubation with FAC, Venofer and IONPs. Images were taken with a 63X oil objective under a 3X zoom: TUNEL positive cells (green), PI counterstaining (red) and nanoparticles (grey). The positive control cells (+) in B and C were cells treated for 1 h with H2O2 (2 mM) and the results (mean ± SD) are representative of three independent experiments. One-way analysis of variance (ANOVA) and a Student’s t-test were used to assess the TUNEL data, and the asterisks indicate significant differences: *p < 0.05, **p < 0.01 and ***p < 0.001
Fig. 3
Fig. 3
FAC, Venofer and IONP uptake and localization in Vero E6 cells. A and B Evaluation of FAC, Venofer, FeraSpinR, APS-IONP-10, DMSA-IONP-10 and DMSA-IONP-16 internalization by Vero E6 cells after a 3, 6 and 24 h incubation at lower (20 or 50 μgFe/ml) (A) and higher (100 or 250 μgFe/ml) concentrations (B), as measured by ICP-OES. The graph shows the increase in iron content in Vero E6 cells over basal levels (untreated cells). The data (mean ± SD) are representative of three independent experiments. C Representative TEM images of Vero E6 cells after treatment with IONPs. High detail images showing the presence of IONPs in vesicles within the Vero E6 cells: scale bar 1 μm–100 nm. The vesicles containing the nanoparticles are indicated with arrows in the lower magnification images. Scale bar: 100 nm
Fig. 4
Fig. 4
Post-treatment and pre-treatment of cells with FAC, Venofer and IONPs reduces SARS-CoV-2 production. A Vero E6 cells were infected with SARS-CoV-2 and 1 hpi, the cells were treated with FAC, Venofer or the IONPs (FeraSpin R, DMSA-IONP-10, APS-IONP-10, and DMSA-IONP-16) at two different concentrations, or left untreated (control cells). B Vero E6 cells were treated with FAC, Venofer or the IONPs indicated in A, and 24 h after treatment, the cells were infected with SARS-CoV-2. A and B Cell culture supernatants were collected at 24 and 48 h post-infection (hpi) and the viral titer was assessed with a plaque assay. Viral titers were determined and represented relative to the titers in control, untreated cells (%). The data (mean ± SD) are representative of three independent experiments and they were analyzed by two-way ANOVA followed by a Sidak’s multiple comparison test: *p < 0.05; **p < 0.01; ***p < 0.001; ****p < 0.0001; and ns, no significant differences
Fig. 5
Fig. 5
Pre-treatment and post-treatment of cells with FAC, Venofer and IONPs reduces SARS-CoV-2 replication and transcription. A Vero E6 cells were infected with SARS-CoV-2 and 1 hpi, the cells were treated with FAC, Venofer or the IONPs (FeraSpinR, DMSA-IONP-10, APS-IONP-10, and DMSA-IONP-16) at two different concentrations, or left untreated (control cells). B Vero E6 cells were treated with FAC, Venofer or the IONPs indicated in A, and 24 h after treatment, the cells were infected with SARS-CoV-2. A and B Total RNA was extracted at 6 and 16 hpi, and the levels of viral gene 7 sg mRNA, viral gRNA and GAPDH RNA were measured by qRT-PCR. The levels of gene 7 sg mRNA and viral gRNA were normalized to the levels of GAPDH, and represented relative to the levels in control, untreated cells (%). The data (mean ± SD) were representative of three independent experiments and they were evaluated by two-way ANOVA followed by a Sidak’s multiple comparison test: *p < 0.05; **p < 0.01; ***p < 0.001; ****p < 0.0001; and ns, no significant differences
Fig. 6
Fig. 6
Ultrastructural analysis of infected cells treated with DMSA-IONP-10. A Normal condition: untreated and mock-infected Vero E6 cells (Control). B Infected condition: Vero E6 cells were infected at a MOI of 0.001 with SARS-CoV-2 for 24 h. C and D The cells were infected with SARS-CoV-2 and 1 hpi the cells were treated with DMSA-IONPs-10 at 250 μg Fe/ml (C) or alternatively, the cells were treated with DMSA-IONP-10 at 250 μg Fe/ml and then infected (D). In all cases the cells were processed for TEM of ultrathin sections at 24 hpi. Colored arrows indicate the presence of viral particles (in orange), DMVs (in green) and the accumulation of DMSA-IONP-10 inside the Vero E6 cells (in blue). Scale bars: 2 μm, 0.5 μm, and 100 nm, as indicated
Fig. 7
Fig. 7
Oxidative stress and ROS induction in cells after treatment with FAC, Venofer or IONPs. A and B ROS generation observed by DHR fluorescence and quantitative image analysis of DHR fluorescence intensity using Image J software: Control (−), untreated Vero E6 cells; and control (+), Vero E6 cells incubated with 1 mM H2O2. Images were taken with a 63X oil objective under a 3X zoom. C Quantification of oxidative stress gene expression by qRT-PCR (mRNA levels) in Vero E6 cells after treatment with FAC, Venofer or the different IONPs (Venofer, FeraSpin R, APS-IONP-10, DMSA-IONP-10 or DMSA-IONP-16). The expression was compared to that in untreated cells and the data were normalized to the expression of GAPDH. D Glutathione content in untreated [Control (−)] Vero E6 cells, and in Vero E6 cells incubated for 24 h with FAC, Venofer or IONPs, or with 1 mM H2O2 [Control (+)]. E Effect of ROS on the antiviral activity of FAC, Venofer or the IONPs. Confluent monolayers of Vero E6 cells were treated for 24 h with N-acetylcysteine (NAC) or left untreated as a control. The cells were then infected with SARS-CoV-2 (MOI, 0.001) and 1 hpi, the extracellular medium containing the virus was replaced with a suspension of FAC, Venofer and IONPs, together with NAC (200 µM), or with a suspension of the FAC, Venofer or IONPs without NAC as a control. The medium was collected from the cells and titrated at 48 hpi. The data are shown as mean ± SD (n = 3) and analyzed with a two-way analysis of variance (ANOVA) and Tukey’s multiple comparisons test: *p < 0.05, **p < 0.01, ***p < 0.001
Fig. 8
Fig. 8
Schematic representation of the regulation of endogenous iron metabolism. Iron acquisition is dependent on endocytosis of diferric transferrin via the transferrin receptor (TFRC). In acidified endosomes, iron is freed from transferrin and exported into the cytoplasm by DMT1. In the cytosol, excess iron is sequestered within heteropolymers of ferritin H and L chains. Cellular iron efflux is mediated by ferroportin (FPN1) and requires iron oxidation on the extracellular side [56]. HRG1 is another protein that is localized in acidified vesicles and it serves to export heme groups stored in these compartments to the cytosol [57]. When iron levels in the cytoplasm are high, lipocalin (LCN2), in coordination with siderophores as co-factors, interacts with iron and forms a ternary complex [58]. Iron homeostasis is regulated by iron responsive proteins, such as IREB2, by binding to iron-responsive elements (IREs). When iron is limited, IREB2 binds to the IREs of some iron metabolism genes that repress ferritin and ferroportin translation, and that stabilize DMT1 and TFRC mRNA. By contrast, when iron is found in the cell, IREB2 degradation is induced and thus, it cannot bind to IREs and induce ferritin or ferroportin expression, whereas DMT1 and TFRC degradation is induced [59]
Fig. 9
Fig. 9
FAC, Venofer and IONP treatments alter the iron metabolism in Vero E6 cells. A The effect of treatment with FAC, Venofer or IONPs on the expression of genes involved in iron metabolism. B The effect of SARS-CoV-2 infection on genes involved in iron metabolism. C The concentration of intracellular iron in non-infected and SARS-CoV-2-infected cells was measured by ICP-OES. D The effect of FAC, Venofer or IONP treatment on genes involved in iron metabolism in SARS-CoV-2-infected cells. Confluent monolayers of Vero E6 cells were infected with SARS-CoV-2 (MOI, 0.001) and at 1 hpi, the extracellular medium containing the virus was replaced with a suspension of FAC, Venofer or IONPs . Total RNA was purified at 24 hpi, and the expression of SLC11A2, SLC40A1, SLC48A1, TFRC, LCN2 and IREB2 was analyzed by qRT-PCR and normalized to the GAPDH expression in each sample. Data shown as the mean ± SD (n = 5)

Similar articles

Cited by

References

    1. Wang Y, Grunewald M, Perlman S. Coronaviruses: an updated overview of their replication and pathogenesis. Methods Mol Biol. 2020;2203:1–29. doi: 10.1007/978-1-0716-0900-2_1. - DOI - PMC - PubMed
    1. Moriyama M, Hugentobler WJ, Iwasaki A. Seasonality of respiratory viral infections. Annu Rev Virol. 2020;7(1):83–101. doi: 10.1146/annurev-virology-012420-022445. - DOI - PubMed
    1. Wacharapluesadee S, Tan CW, Maneeorn P, Duengkae P, Zhu F, Joyjinda Y, et al. Evidence for SARS-CoV-2 related coronaviruses circulating in bats and pangolins in Southeast Asia. Nat Commun. 2021;12(1):972. doi: 10.1038/s41467-021-21240-1. - DOI - PMC - PubMed
    1. Fehr AR, Channappanavar R, Perlman S. Middle east respiratory syndrome: emergence of a pathogenic human coronavirus. Annu Rev Med. 2017;68:387–399. doi: 10.1146/annurev-med-051215-031152. - DOI - PMC - PubMed
    1. Hu B, Guo H, Zhou P, Shi ZL. Characteristics of SARS-CoV-2 and COVID-19. Nat Rev Microbiol. 2021;19(3):141–154. doi: 10.1038/s41579-020-00459-7. - DOI - PMC - PubMed

Grants and funding

LinkOut - more resources