. 2022 Jul 30;12(1):13108.
doi: 10.1038/s41598-022-17055-9.

Stimulation with acoustic white noise enhances motor excitability and sensorimotor integration

Affiliations

Stimulation with acoustic white noise enhances motor excitability and sensorimotor integration

Giovanni Pellegrino et al. Sci Rep. .

Abstract

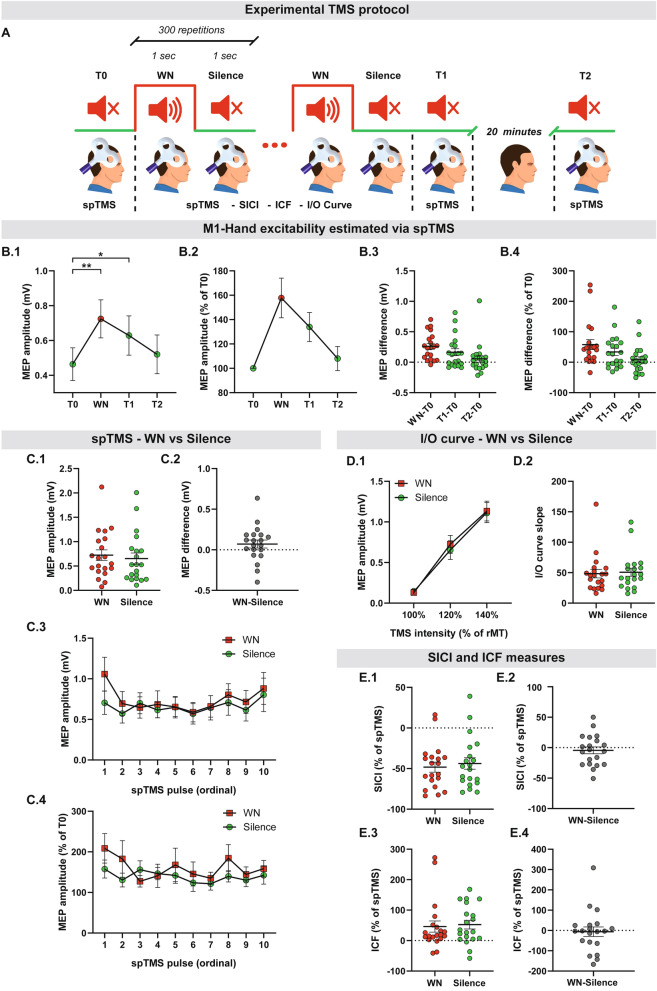
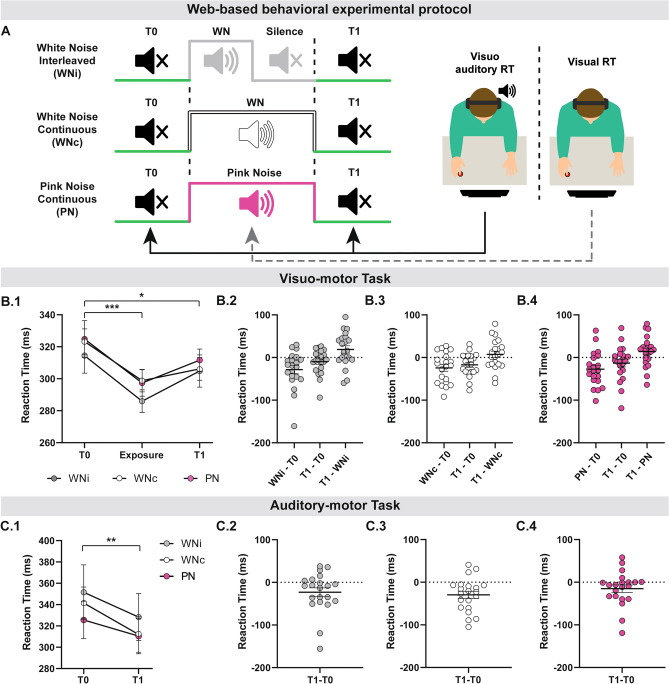
Auditory white noise (WN) is widely used in neuroscience to mask unwanted environmental noise and cues, e.g. TMS clicks. However, to date there is no research on the influence of WN on corticospinal excitability and potentially associated sensorimotor integration itself. Here we tested the hypothesis, if WN induces M1 excitability changes and improves sensorimotor performance. M1 excitability (spTMS, SICI, ICF, I/O curve) and sensorimotor reaction-time performance were quantified before, during and after WN stimulation in a set of experiments performed in a cohort of 61 healthy subjects. WN enhanced M1 corticospinal excitability, not just during exposure, but also during silence periods intermingled with WN, and up to several minutes after the end of exposure. Two independent behavioural experiments highlighted that WN improved multimodal sensorimotor performance. The enduring excitability modulation combined with the effects on behaviour suggest that WN might induce neural plasticity. WN is thus a relevant modulator of corticospinal function; its neurobiological effects should not be neglected and could in fact be exploited in research applications.


Conflict of interest statement

The authors declare no competing interests.

Figures

Figure 1
Figure 1
Cortical and Corticospinal Excitability. (A) Experimental design. Subjects were exposed to a sequence of WN (1 s) interleaved with Silence (1 s), repeated 300 times. Corticospinal excitability was assessed for the hotspot of the right M1-Hand abductor digiti minimi (ADM) at multiple time-points: before WN exposure (T0), during WN (WN), during silence (Silence), immediately after the end of the sequence (T1) and 20 min later (T2). Cortical excitability was assessed during WN (WN) and during silence (Silence). spTMS = single pulse TMS, rMT = resting motor threshold, SICI = short-latency intra cortical inhibition, ICF = intra cortical facilitation, I/O curve = input/output curve. (B) M1-Hand excitability estimated via spTMS. As compared to T0, corticospinal excitability was significantly higher during WN exposure (WN about 60% higher than T0) and soon after the WN-Silence sequence (T1, about 40% higher than T0). Statistical analysis was performed only on data illustrated in (B1), while (B2), (B3) and (B4) are shown for visualization purpose only. (B1) absolute MEP amplitude; (B2) MEP amplitude as percentage of T0. (B3) Individual absolute MEP difference between conditions. (B4) Individual normalized MEP differences between conditions. (C) There was no significant spTMS excitability difference between WN and Silence. (C1) Individual absolute MEP amplitude for WN and Silence. (C2) Individual WN-Silence absolute MEP difference. (C3) Absolute MEP amplitude over the duration of WN and Silence. The x-axis indicates the sequence of TMS pulse. Corticospinal excitability level remained stable during the entire auditory exposure and did not show any online significant difference between WN and Silence. Data is reported as average ± SEM across subjects. (C4) As for (C3), but data was normalized over T0 excitability. (D) There was no significant I/O curve difference between WN and Silence (D1) Absolute MEP amplitude at different TMS intensities for WN and Silence. (D2) Individual values of I/O curve slope for WN and Silence. (E) SICI and ICF were not significantly different between WN and Silence. (E1) SICI individual values for WN and Silence. (E2) SICI WN-Silence intrasubject difference. (E3) ICF individual values for WN and Silence. (E4) ICF WN-Silence intrasubject difference. Variability is expressed as standard error of the mean. * denotes p < 0.05; ** denotes p < 0.001.
Figure 2
Figure 2
Effects of WN on behaviour. (A) Schematic representations of the behavioural tasks. The order of the tasks was randomized across subjects but kept constant within subject pre and post WN. The Maximum Finger Force Task and Finger Abduction Dexterity tasks aimed at assessing WN effects on pure, self-paced and self-initiated motor performance. The Maximum Finger Force Task consisted in pressing with maximal strength the right index finger against a force sensor. The Finger Abduction Dexterity Task consisted in abducting as fast as possible the right index finger. The Hybrid Reaction Time Task was meant to assess WN effects on complex sensory-motor integration. Subjects were cued through three different sensory routes (visual, auditory, tactile) to press as quickly as possible a keyboard key with their right index finger. They were seated on an armchair, had in-ear headphones, and median nerve skin electrodes connected to a stimulator. Subjects were asked to fixate a cross. The visual cue was a red circle, which disappeared at the time of the keyboard press; the acoustic cue was a pure sound; the tactile stimulus was an electric pulse. Thirty stimuli for each stimulus type were delivered in a random order. (B) WN significantly improved the Hybrid Reaction Time Task performance, similarly for the three tasks. Statistical analysis was performed only on data illustrated in (B1), while (B2) is shown for visualization purpose only. (B1) Individual performance for tactile, visual and auditory RT tasks. (B2) Intrasubject Post vs Pre difference in performance for tactile, visual and auditory RT tasks. (C,D) WN had no significant effects on Maximum Finger Force Task and Finger Abduction Dexterity Task performance. All panels show the individual performance for WN and Silence and the intrasubject WN-Silence performance difference. (C1) Speed individual values. (C2) Speed Post–Pre intrasubject difference. Variability is expressed as standard error of the mean. (D1) Maximum Force individual values. (D2) Maximum Force Post–Pre intrasubject difference. ** denotes p < 0.001.
Figure 3
Figure 3
Web-based behavioural experiment. (A) Schematic representation of web-based behavioural task. This experiment was designed to assess WNi, (White Noise Interleaved), WNc (White Noise Continuous) and PN (Pink Noise) effects on complex sensory-motor integration. The order of conditions was randomized across subjects. Subjects were cued through two different sensory routes (visual, auditory) to press as quickly as possible a keyboard key with their right index finger. Visuo-motor RT was performed at T0, during auditory exposure and at T1. Auditory-motor RT was performed at T0 and T1. Subjects were at home, seated in front of their PC screen with earplugs/phones. Subjects were asked to fixate at a cross. The visual cue was a red circle; the acoustic cue was a pure sound. (B) Visuo-motor task. WNi, WNc and PN improved performance of visuo-motor task, both during and after exposure to auditory noise. (B1) Mean ± SER performance across subjects, by condition (WNi, WNc, PN), before (T0), during (Exposure) and after (T1) exposure to auditory noise. (B2) WNi intrasubject RT differences. (B3) WNc intrasubject RT differences. (B4) PN intrasubject RT differences. (C) Auditory-Motor task. WNi, WNc and PN improved performance of auditory-motor task. (C1) Mean ± SER performance across subjects by condition (WNi, WNc, PN), before (T0) and after (T1) exposure to auditory noise; (C2) WNi intrasubject RT difference; (C3) WNc intrasubject RT difference; (C4) PN intrasubject RT differences. Variability is expressed as standard error of the mean. *,** and *** denote p < 0.05, p < 0.001 and p < 0.001 respectively.

Similar articles

Cited by

References

    1. Giambattistelli F, et al. The spontaneous fluctuation of the excitability of a single node modulates the internodes connectivity: A TMS-EEG study. Hum. Brain Mapp. 2014;35:1740–1749. doi: 10.1002/hbm.22288. - DOI - PMC - PubMed
    1. Noda Y. Toward the establishment of neurophysiological indicators for neuropsychiatric disorders using transcranial magnetic stimulation-evoked potentials: A systematic review. Psychiatry Clin. Neurosci. 2020;74:12–34. doi: 10.1111/pcn.12936. - DOI - PubMed
    1. Bonato C, Miniussi C, Rossini PM. Transcranial magnetic stimulation and cortical evoked potentials: A TMS/EEG co-registration study. Clin. Neurophysiol. 2006;117:1699–1707. doi: 10.1016/j.clinph.2006.05.006. - DOI - PubMed
    1. Nikouline V, Ruohonen J, Ilmoniemi RJ. The role of the coil click in TMS assessed with simultaneous EEG. Clin. Neurophysiol. 1999;110:1325–1328. doi: 10.1016/S1388-2457(99)00070-X. - DOI - PubMed
    1. Tiitinen H, et al. Separation of contamination caused by coil clicks from responses elicited by transcranial magnetic stimulation. Clin. Neurophysiol. 1999;110:982–985. doi: 10.1016/S1388-2457(99)00038-3. - DOI - PubMed

Publication types