. 2022 Jul 30;12(1):120.
doi: 10.1186/s13578-022-00849-9.

LncRNA CRLM1 inhibits apoptosis and promotes metastasis through transcriptional regulation cooperated with hnRNPK in colorectal cancer

Affiliations

LncRNA CRLM1 inhibits apoptosis and promotes metastasis through transcriptional regulation cooperated with hnRNPK in colorectal cancer

Zhe Wang et al. Cell Biosci. .

Abstract

Background: Colorectal liver metastases (CRLM) continue to have a low survival rate. The number of CRLM regulators and clinical indicators remains limited. Long non-coding RNAs (lncRNAs) are a new master regulator of cell invasion and metastasis. However, the function and regulation mechanism of lncRNAs in colorectal cancer (CRC) metastasis are yet unknown.

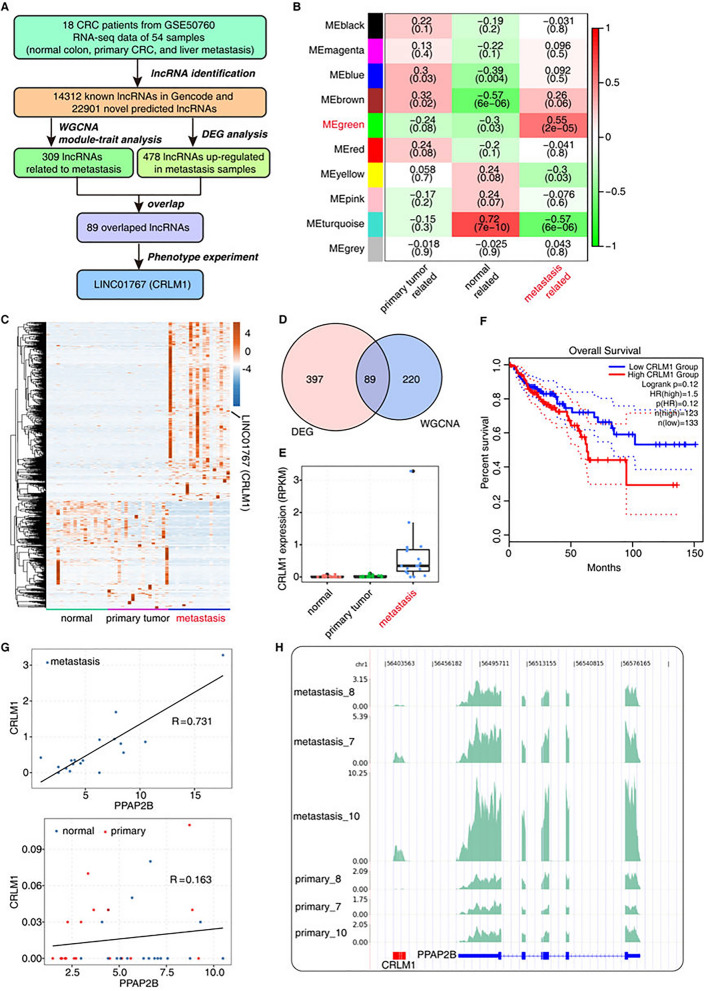
Methods: To screen and identify CRLM-related lncRNAs, public transcriptome data were used. Gain and loss of function experiments were carried out to investigate the biological activities of lncRNA CRLM1 in vitro and in vivo. RNA sequencing (RNA-seq), chromatin isolation by RNA purification (ChIRP), immunofluorescence (IF), quantitative real-time PCR (qRT-PCR), western blotting, and rescue experiments were performed to explore the molecular mechanism of CRLM1. Moreover, identified the proteins, DNAs, and RNAs that interact with CRLM1.

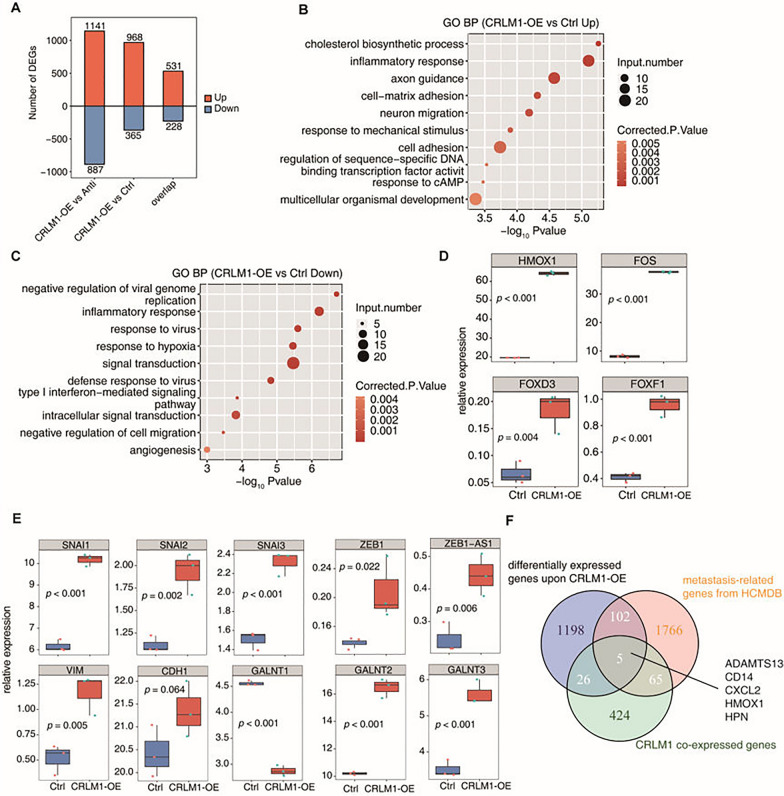
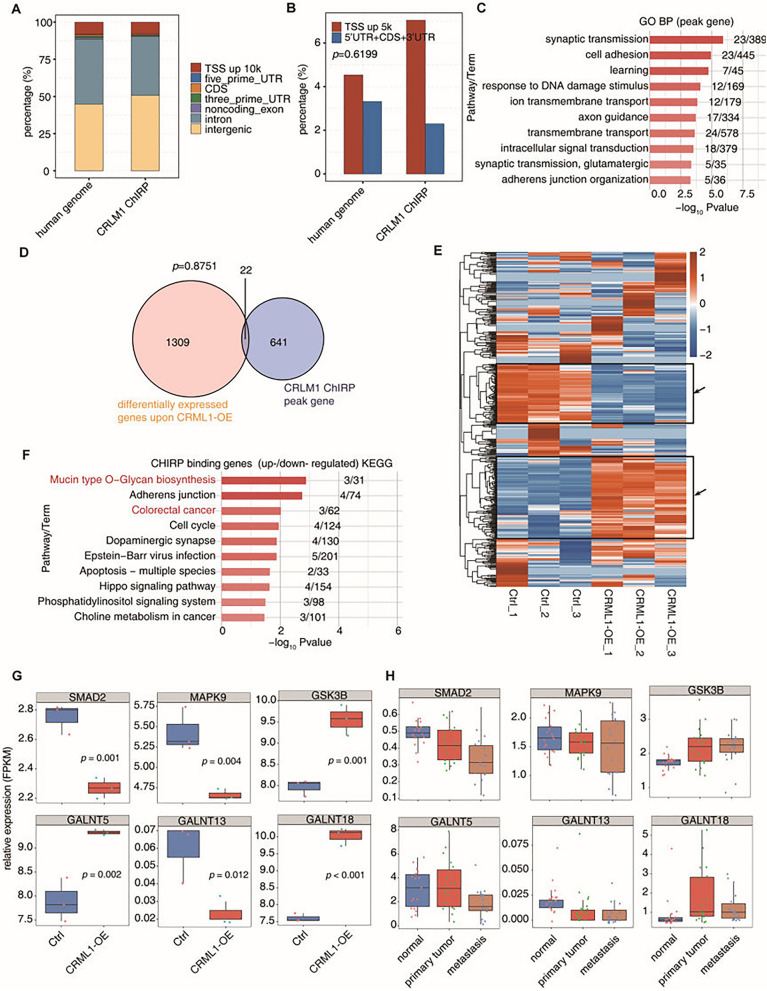
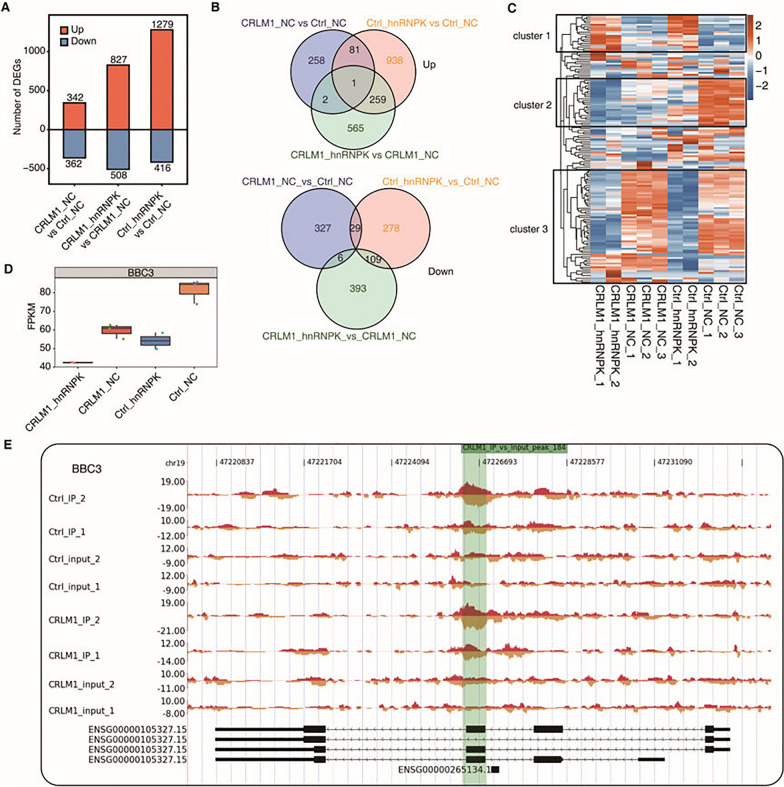
Results: The investigation of lncRNA expression dynamics in CRLM, primary CRC, and normal tissues in this work resulted in identifying a series of lncRNAs associated with metastasis, including CRLM1. CRLM1 inhibited apoptosis of CRC cells and promoted liver metastasis in Balb/C nude mice. CRLM1 was weakly associated with the chromatin regions of genes involved in cell adhesion and DNA damage, and this association was bidirectionally correlated with CRLM1-regulated pro-metastatic gene expression. CRLM1 physically interacts with the hnRNPK protein and promotes its nuclear localization. CRLM1 effectively enhances hnRNPK promoter occupancy and co-regulates the expression of a panel of metastatic genes.

Conclusions: The finding of the clinically significant lncRNA CRLM1 in promoting metastasis and regulating gene expression suggests a potential biomarker and target for CRLM therapy.

Keywords: Colorectal cancer; Gene expression; Metastasis; hnRNPK; lncRNA CRLM1.


Conflict of interest statement

The authors have no conflicts of interest to declare.

Figures

Fig. 1
Fig. 1
CRLM1 is overexpressed in colorectal liver metastases and associated with poor survival. A Strategy of lncRNA CRLM1 identification by WGCNA and DEG analysis. B Module-trait association. Each row corresponds to a module and each column corresponds to a specific trait: normal related, primary tumor related, and metastasis tumor related. The color of the cell indicates the correlation coefficient between the module and trait, dark red color indicates high degree of positive correlation, and dark green indicates high degree of negative correlation between each module and trait. The numbers in the cell indicate the module-trait correlation value (top) and p value (below). C The unsupervised hierarchical clustering heatmap of 54 samples based on DElncRNAs between metastasis group and primary group. D Venn diagram of up-regulated lncRNAs in metastasis (vers. Primary) and the most metastasis-related module (MEgreen) detected by WGCNA. E Boxplot of expression level of CRLM1 in normal samples, primary and metastasis tumor samples. F Kaplan–Meier analysis for overall survival of patient with high or low CRLM1 in the colorectal cancer from TCGA dataset. G Expression of CRLM1 and the adjacent gene PPAP2B is positive correlated in metastasis. H Visualization of CRLM1 and the adjacent gene PPAP2B
Fig. 2
Fig. 2
CRLM1 inhibits CRC cell apoptosis and promotes metastasis in vitro and in vivo. A, B The relative expression of CRLM1 was detected in HCT116 and SW620 cell lines after transfection with overexpressed CRLM1 plasmid (a) or si- CRLM1 (b) by qRT-PCR. C, D The apoptosis rate was analyzed by flow cytometry after downregulation of CRLM1 (C) and the quantification data (D). E–H The migratory ability of HCT116 (E) and SW620 (F) cell lines were detected by wound healing assays after overexpression or knockdown of CRLM1 (magnification, ×200, scale bar, 100 μm) and the quantification data (G, H). I–K Transwell assay was used to measure CRC cells invasion abilities after overexpression or knockdown of CRLM1 (magnification, ×200, scale bar, 100 μm) (I) and the quantification data (J, K). LO Liver metastasis were taken from Balb/c nude mice injected with CRLM1-OE or sh-CRLM1 SW620 cells into the distal tip of the spleens for 4 weeks (n = 4 for each group). The images of liver metastasis (L, N) and the quantification data (M, O). Data are shown as mean ± SD, *P < 0.05, **P < 0.01, ***P < 0.001
Fig. 3
Fig. 3
CRLM1-OE converts the CRC cell transcriptome to the metastasis state. A The number of DEGs among different groups. The number of up-regulated and down-regulated DE lncRNAs was showed in bar plot. “overlap” indicates the co-regulated genes between CRLM1 vs Anti and CRLM1 vs Ctrl. B, C The top 10 representative GO Biological Process terms of up- (B) and down-regulated genes (C) between CRLM1-OE and Ctrl. D Boxplots showing expression status of 4 differentially expressed TFs comparing CRLM1-OE with Ctrl samples. E Boxplots showing expression status of 10 EMT-related genes comparing CRLM1-OE with Ctrl samples. F Venn diagram of differentially expressed genes upon CRLM1-OE, metastasis-related genes from HCMDB database and CRLM1 co-expressed genes
Fig. 4
Fig. 4
CRLM1–chromatin interaction and its effect on gene expression. A Percentage of CRLM1-bound peaks in different genomic regions. B Percentage of CRLM1-bound peaks in 5 kb of TSS upstream was compared to that in gene body exclude intron region. C The top 10 representative GO Biological Process terms of all CRLM1 binding genes. D Venn diagram of CRLM1 binding genes by ChIRP-DNA and differentially expressed genes upon CRLM1-OE. E The unsupervised hierarchical clustering heatmap showing the expression level of CRLM1-bound genes by ChIRP-DNA from CRLM1-OE and Ctrl samples. F The top 10 representative GO Biological Process terms of CRLM1-bound genes which were regulated by CRLM1-OE (genes in black box of D). G Boxplots showing expression status of six CRLM1-bound genes which were regulated by CRLM1-OE genes from CRLM1-OE and Ctrl samples. H Boxplots showing expression status of six CRLM1-bound genes which were regulated by CRLM1-OE genes from 54 GEO samples
Fig. 5
Fig. 5
CRLM1 interacts with hnRNPK and promotes its nuclear localization. A CRLM1–protein interaction network. Histone, RNA binding proteins (RBP), transcriptional factors (TF) and other proteins are grouped separately. Hexagon indicates the metastasis-related genes from HCMDB database. The protein association networks were constructed using STRING. B Western validation of HNRNPK protein retrieved by CRLM1. C hnRNPK RIP-qPCR. D Predicted second structure of CRLM1 which contains hnRNPK binding motif at 403 to 410. E Localization of CRLM1 and hnRNPK in HCT116-NC and HCT116-CRLM1 cells by fluorescence in situ hybridization and immunofluorescence. Blue represents DAPI staining of the nucleus, green represents GFP staining of the cytoplasm, red represents Cy3-labeled probe against CRLM1 RNA and yellow represents Aluor 647 against hnRNPK-antibody. F The hnRNPK protein from purified nuclear fractions and cytosolic fraction in HCT116 and SW620 cells transfected with CRLM1-OE was examined using western blotting
Fig. 6
Fig. 6
CRLM1 promotes hnRNPK promoter occupancy. A Illustration of the working model. B Genic regions of hnRNPK binding peaks without CRLM1 (Ctrl) and with CRLM1-OE. C Venn diagram of hnRNPK binding genes without CRLM1 and with CRLM1-OE. D Venn diagram of hnRNPK binding genes with CRLM1-OE and metastasis-related genes from HCMDB database. E Global visualization of hnRNPK signals in Ctrl (left) and CRLM1 (right) around gene TSS by ngs.plot. F Example for CRLM1-promoted hnRNPK binding profiles
Fig. 7
Fig. 7
CRLM1 and hnRNPK co-regulates gene expression. A The number of DEGs among different groups. The number of up-regulated and down-regulated DE lncRNAs was showed in bar plot. B Venn diagram of co-up (up panel) and co-down (down panel) regulated genes among three groups in A. C The top 10 KEGG pathways of co-regulated DEGs between CRLM1 vs Ctrl and Ctrl_hnRNPK vs Ctrl. D The unsupervised hierarchical clustering heatmap of hnRNPK binding genes with CRLM1-OE. E Top 10 KEGG pathways of genes from cluster2 of D. F Box plot showing the expression profile of BBC3. G Visualization of hnRNPK binding profiles on BBC3
Fig. 8
Fig. 8
CRLM1-hnRNPK cooperatively regulates the expression of metastasis-related genes and promotes CRC cell metastasis. A CRLM1 and hnRNPK co-up-regulated genes. These genes were screened out through the criteria: fold change (FC) of CRLM1_hnRNPK vs CRLM1_NC ≥ 1.2, FDR ≤ 0.05; FC of CRLM1_NC vs Ctrl_NC ≥ 1.5, FDR ≤ 0.05; FC of Ctrl_hnRNPK vs Ctrl_NC ≥ 0.67 and ≤ 1.5. B CRLM1 and hnRNPK co-down-regulated genes. Criteria were same as (A) except the direction is opposite. C, D The top 10 KEGG pathways (C) and top 10 representative GO Biological Process terms (D) of all CRLM1 and hnRNPK co-regulated genes. E BBC3, SMAD6, BMP7 and SMURF2 protein expression in CRLM1-OE cells with hnRNPK knockdown by immunoblotting. F BBC3, SMAD6, BMP7 and SMURF2 mRNA expression in CRLM1-OE cells with hnRNPK knockdown by qRT-PCR. G-J The ability of CRC cell migration was detected by wound healing assay after transfection or co-transfection with corresponding vectors or siRNAs (magnification, ×200, scale bar, 100 mμ) (G, I) and the quantification data (H, J). K–N The invasion ability of CRC cells transfected or co-transfected with corresponding vectors or siRNAs was measured by transwell assay (magnification, ×200, scale bar, 100 μm) (K, L) and the quantification data (M, N). O, P hnRNPK knockdown inhibited liver metastasis of CRLM1-OE SW620 cells (n = 4 for each group). The images of liver metastasis (O) and the quantification data (P). Data are shown as mean ± SD, *P < 0.05, **P < 0.01, ***P < 0.001

Similar articles

Cited by

References

    1. Siegel RL, Miller KD, Goding Sauer A, Fedewa SA, Butterly LF, Anderson JC, et al. Colorectal cancer statistics. CA Cancer J Clin. 2020;70(3):145–164. doi: 10.3322/caac.21601. - DOI - PubMed
    1. Bray F, Ferlay J, Soerjomataram I, Siegel RL, Torre LA, Jemal A. Global cancer statistics 2018: GLOBOCAN estimates of incidence and mortality worldwide for 36 cancers in 185 countries. CA Cancer J Clin. 2018;68(6):394–424. doi: 10.3322/caac.21492. - DOI - PubMed
    1. Markowitz SD, Bertagnolli MM. Molecular origins of cancer: molecular basis of colorectal cancer. N Engl J Med. 2009;361(25):2449–2460. doi: 10.1056/NEJMra0804588. - DOI - PMC - PubMed
    1. Fearon ER. Molecular genetics of colorectal cancer. Annu Rev Pathol. 2011;6:479–507. doi: 10.1146/annurev-pathol-011110-130235. - DOI - PubMed
    1. Takayama T, Miyanishi K, Hayashi T, Sato Y, Niitsu Y. Colorectal cancer: genetics of development and metastasis. J Gastroenterol. 2006;41(3):185–192. doi: 10.1007/s00535-006-1801-6. - DOI - PubMed