. 2022 Jul 30;12(1):13119.
doi: 10.1038/s41598-022-17264-2.

An analysis of alternative forced oscillation technique reporting and validation methods for within- and between-sessions in healthy adults

Affiliations

An analysis of alternative forced oscillation technique reporting and validation methods for within- and between-sessions in healthy adults

Jennifer H Therkorn et al. Sci Rep. .

Abstract

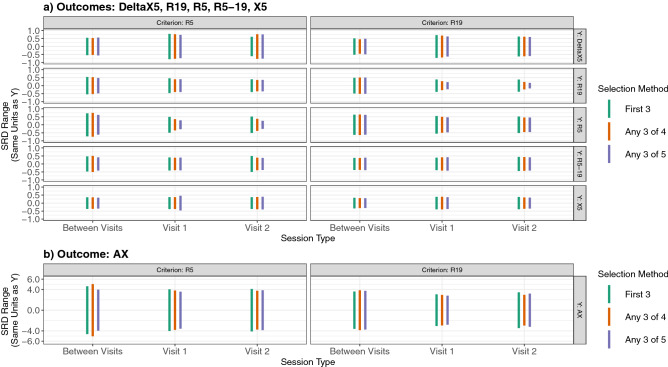
Forced oscillation technique (FOT) provides unique information on respiratory system mechanical properties complementing pulmonary function testing. However, a lack of evidence guiding acquisition/reporting of parameters has slowed clinical FOT adoption. Current European Respiratory Society (ERS) standards recommend 3-5 trials per session comprising three trials with a coefficient of variation (CoV) ≤ 10% for low-frequency resistance. We present an analysis of different combinations of trial selection methods and session validity thresholding variables (low- and mid-frequency resistance and reactance [R5, R19, X5], low-frequency reactance area [AX] and tidal volume) comparing proportion of subjects achieving valid data across two test sessions (7 ± 3 days apart) and within and between session measurement variabilities. 126 (98%) subjects achieved valid data across both sessions (2666 trials). With R5 or R19 as criteria and selection of any three trials from ≥ 4 attempts, ≥ 75% of subjects achieved validity. Furthermore, with R5 or R19 criteria and selection of any trials from ≥ 5 attempts, CoVs for resistance outcomes were reduced within session while variabilities of FOT outcomes between sessions remained consistent. Within session differences in measurement variabilities were not clinically meaningful. Our analyses support current ERS reporting recommendations for healthy adults. Future work should apply this analytic approach to patient populations.


Conflict of interest statement

The authors declare no competing interests.

Figures

Figure 1
Figure 1
Proportion of subjects with valid data as a function of selection method. Percent (y-axis) and number (top of bars) of subjects able to achieve valid data for each selection method and criteria combination across both sessions. The percentages are out of a total of 129 (number of subjects attempting trials in both sessions). Valid data refers to trials passing three levels of quality assurance: (1) software checks, (2) investigator checks, and (3) session validity following trial selection and application of the thresholding criteria variable (CoV ≤ 10%). Reference lines (black dashed lines) are drawn at 50% and 75%.
Figure 2
Figure 2
Minimum smallest real difference (SRD) range within and between sessions for each trial selection method stratified into two vertical sets of panels by coefficient of variation thresholding criteria and six horizontal sets of panels by outcome used as model fit response (Y’s). The horizontal sets of panels stratified by outcome were split into sections “a” and “b” to account for the different y-axis scale associated with reactance area, AX. SRD units are the same as the outcomes, so the y-axis scales vary by outcome metric as follows. In panel “a”: outcomes (low- (5 Hz) and mid-frequency (19 Hz) resistance (R5, R19) and reactance (X5), frequency dependence of resistance (R5-19), delta X5 (∆ = X5 inspiratory—X5 expiratory;), cm H2O ·s/L). In panel “b”: reactance area (AX, cm H2O/L). SRD was calculated as either the within or between session standard deviation (i.e., root mean square error (RMSE) from model fits) multiplied by √2 × 1.96 (SRD = RMSE × 2.77). What is termed here as the minimum SRD range was calculated as zero (i.e., assuming no difference between measurements using the same approach) ± SRD. Therefore, smaller minimum SRD ranges represent less measurement variability and greater sensitivity to detect a true difference,.

Similar articles

Cited by

References

    1. Dandurand RJ, Lavoie J-P, Lands LC, Hantos Z, Group TOHS. Comparison of oscillometry devices using active mechanical test loads. ERJ Open Res. 2019;5:00160–02019. doi: 10.1183/23120541.00160-2019. - DOI - PMC - PubMed
    1. Kalchiem-Dekel O, Hines SE. Forty years of reference values for respiratory system impedance in adults: 1977–2017. Respir. Med. 2018;136:37–47. doi: 10.1016/j.rmed.2018.01.015. - DOI - PubMed
    1. King GG, et al. Technical standards for respiratory oscillometry. Eur. Respir. J. 2020;55:1900753. doi: 10.1183/13993003.00753-2019. - DOI - PubMed
    1. Harkness LM, et al. Within-session variability as quality control for oscillometry in health and disease. ERJ Open Res. 2021;7:00074–02021. doi: 10.1183/23120541.00074-2021. - DOI - PMC - PubMed
    1. Therkorn JH, Toto DR, Falvo MJ. A comparison of alternative selection methods for reporting spirometric parameters in healthy adults. Sci. Rep. 2021;11:14945. doi: 10.1038/s41598-021-94120-9. - DOI - PMC - PubMed

Publication types