. 2022 Jul 30;20(1):169.
doi: 10.1186/s12915-022-01360-w.

Full-length transcriptomic analysis in murine and human heart reveals diversity of PGC-1α promoters and isoforms regulated distinctly in myocardial ischemia and obesity

Affiliations

Full-length transcriptomic analysis in murine and human heart reveals diversity of PGC-1α promoters and isoforms regulated distinctly in myocardial ischemia and obesity

Daniel Oehler et al. BMC Biol. .

Abstract

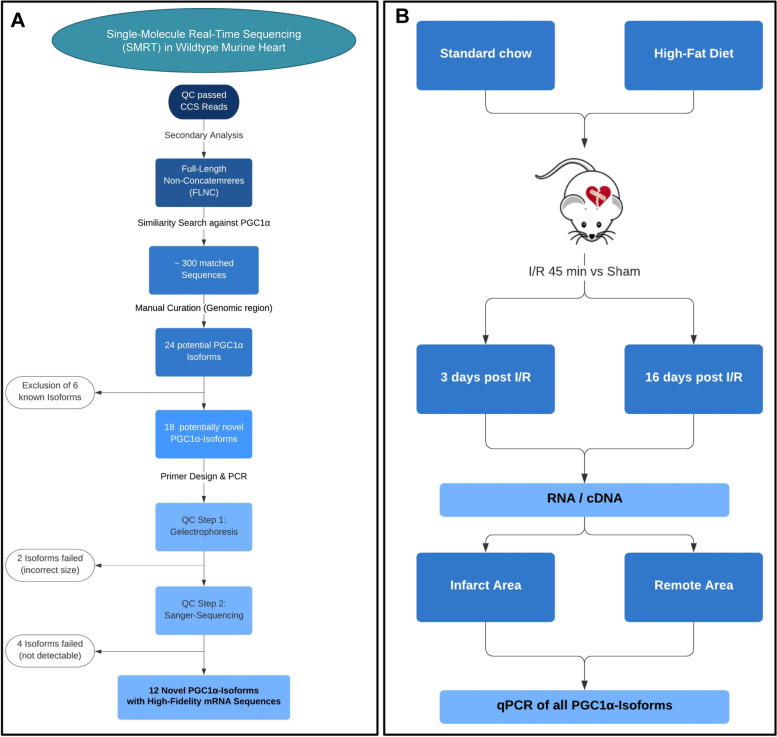
Background: Peroxisome proliferator-activated receptor gamma coactivator-1 alpha (PGC-1α) acts as a transcriptional coactivator and regulates mitochondrial function. Various isoforms are generated by alternative splicing and differentially regulated promoters. In the heart, total PGC-1α deficiency knockout leads to dilatative cardiomyopathy, but knowledge on the complexity of cardiac isoform expression of PGC-1α remains sparse. Thus, this study aims to generate a reliable dataset on cardiac isoform expression pattern by long-read mRNA sequencing, followed by investigation of differential regulation of PGC-1α isoforms under metabolic and ischemic stress, using high-fat-high-sucrose-diet-induced obesity and a murine model of myocardial infarction.

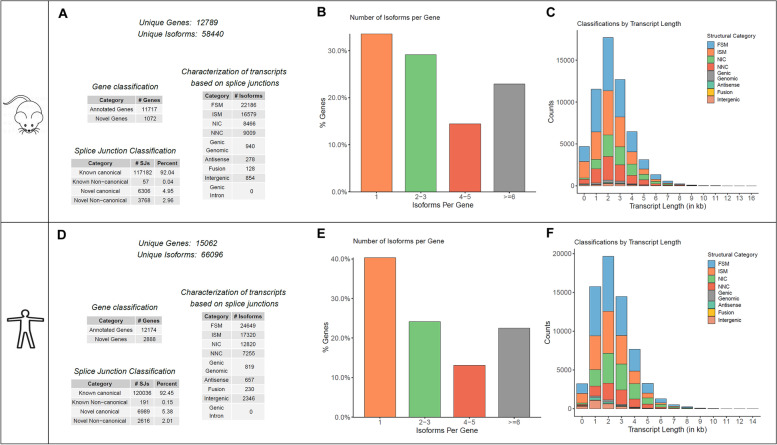
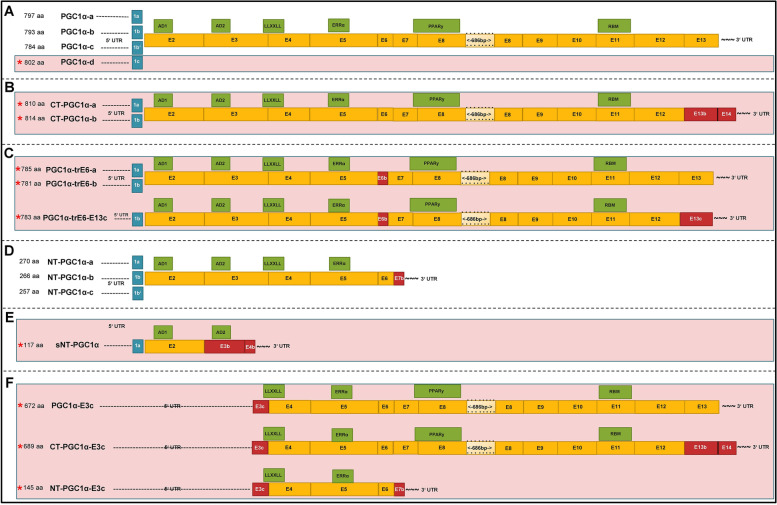
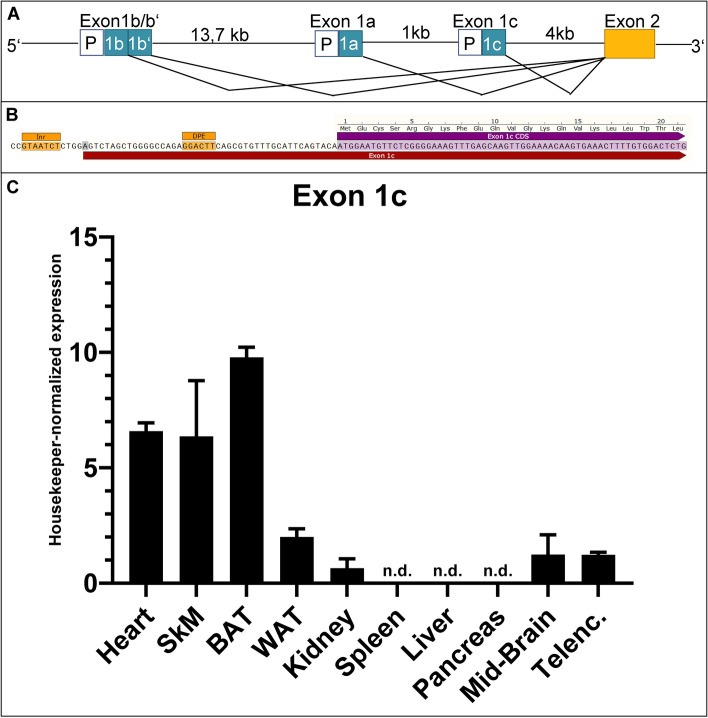
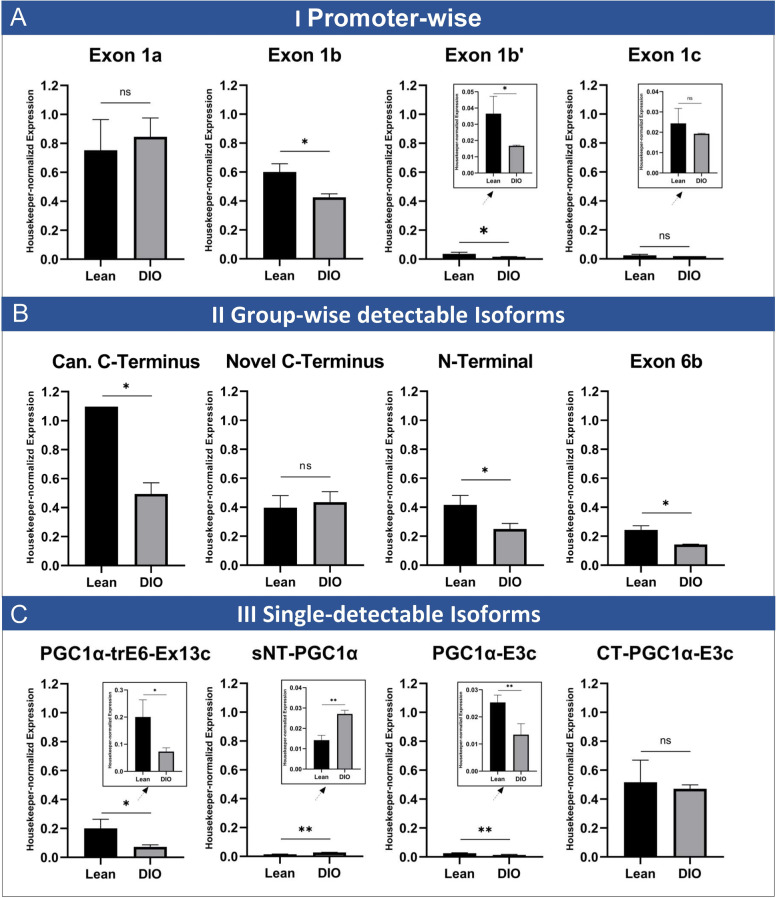
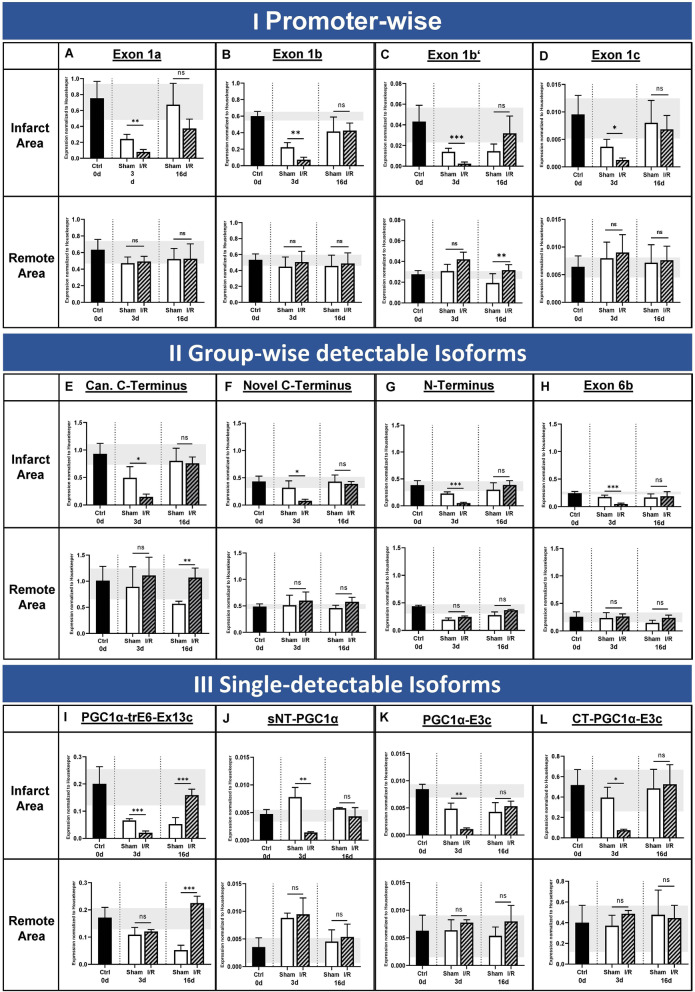
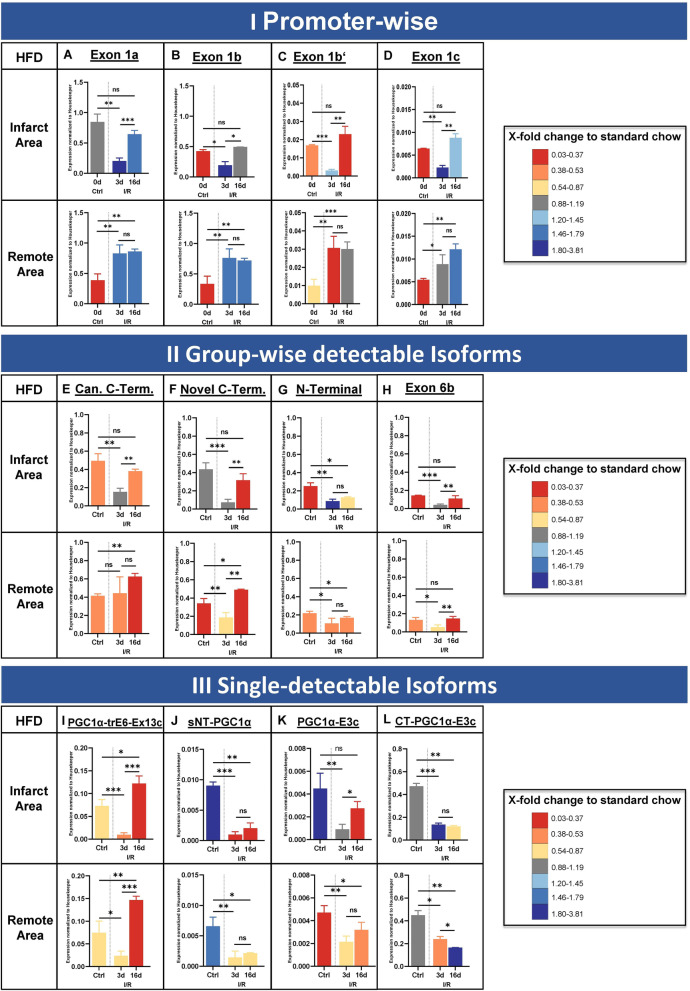
Results: Murine (C57Bl/6J) or human heart tissue (obtained during LVAD-surgery) was used for long-read mRNA sequencing, resulting in full-length transcriptomes including 58,000 mRNA isoforms with 99% sequence accuracy. Automatic bioinformatic analysis as well as manual similarity search against exonic sequences leads to identification of putative coding PGC-1α isoforms, validated by PCR and Sanger sequencing. Thereby, 12 novel transcripts generated by hitherto unknown splicing events were detected. In addition, we postulate a novel promoter with homologous and strongly conserved sequence in human heart. High-fat diet as well as ischemia/reperfusion (I/R) injury transiently reduced cardiac expression of PGC-1α isoforms, with the most pronounced effect in the infarcted area. Recovery of PGC-1α-isoform expression was even more decelerated when I/R was performed in diet-induced obese mice.

Conclusions: We deciphered for the first time a complete full-length transcriptome of the murine and human heart, identifying novel putative PGC-1α coding transcripts including a novel promoter. These transcripts are differentially regulated in I/R and obesity suggesting transcriptional regulation and alternative splicing that may modulate PGC-1α function in the injured and metabolically challenged heart.

Keywords: Diet-induced obesity; Ischemia/reperfusion; Long-read sequencing; PGC-1α.


Conflict of interest statement

The authors declare that they have no competing interests.

Figures

Fig. 1
Fig. 1
Workflow overview. A Strategy for detection and validation of PGC-1α isoforms by SMRT sequencing in mice. Starting from raw data from SMRT sequencing, primary and secondary analyses were performed, resulting in full-length non-concatemers (FLNC). Then, a similarity search against PGC-1α was performed, yielding in 18 potential novel PGC-1α transcripts, resulting in 12 high-fidelity novel PGC-1α isoforms after quality control. B Strategy for investigating into differential expression of PGC-1α isoforms by diet-induced obesity and ischemia/reperfusion (I/R) injury in mice followed by qPCR. Mice fed either a standard chow or high-fat diet underwent I/R or sham surgery. Then, tissue from the infarct area and the remote area (distant from the infarcted area) as baseline as well as 3 and 16 days post I/R was collected and used for expression analysis using qPCR
Fig. 2
Fig. 2
Analysis of SMRT sequencing in murine and human heart. Unique genes and isoforms and their characterization from automated analysis of murine (A–C) and human (D–F) datasets. Shown is the numeric classification of found genes and isoforms (A and D), number of isoforms per gene (B and E) and length-distribution of transcripts (C and F). Details see text
Fig. 3
Fig. 3
Overview over PGC-1α isoforms in murine heart (passed QC). PGC-1α isoforms (mRNA) after SMRT sequencing which passed QC filtering (Fig. 1): Differing starting exons 1a, b, b’ or c (blue boxes), canonical main exons (orange boxes), novel/altered exons (red boxes) and functional domains (green boxes, details see text). Length of boxes indicates relative length of nucleotides (true to scale, with exception of exon 8: shortened bp marked), asterisks and red background layer indicating novel isoforms. A Isoforms consisting of either exon 1a, b, b’ or the novel exon 1c followed by only canonical main exons. B Isoforms starting with exon 1a or b followed by canonical exon 2 to exon 12 and then followed by a novel exon 13b and novel exon 14 (new C-terminal end). C Isoforms with starting exon 1a or b and novel exon 6b, ending in the canonical C-terminal end (two isoforms) or with a novel exon 13c (one isoform). D N-terminal isoforms (known), with either starting with exon 1a, b or b’ and ending preliminary due to an alternative exon 7b. E Novel N-terminal isoform, shorter than the known (see D; therefore prefixed with ‘s’), ending in a novel exon 3b / exon 4b. This isoform is the shortest isoform in the overall pattern. F Novel isoform group consisting of different splicing events upstream exon 3, resulting in a shift of the start codon inside exon 3 with valid open reading frame. Three variants exist, differing in the 5′-end (either canonical C-, novel C- or N-terminal end)
Fig. 4
Fig. 4
Organ-specific expression profile of E1c-transcript (exon 1c). A Graphical illustration of PGC-1α-promoters and corresponding starting exons. The canonical promoter, responsible for exon 1a, lies between the alternative (known) promoter (regulating exons 1b and b’) and the new putative promoter site controlling novel exon 1c. B Novel predicted promoter site associated to exon 1c. Prediction (using ‘ElemeNT’57) of mammalian initiator element (Inr) and corresponding downstream promoter element (DPE) around the transcription start site (marked in grey) of exon 1c. C Expression data of DNA samples derived from qPCR with primers targeting new Exon1c-Exon2-Junction in heart, skeletal muscle (SkM), brown adipose tissue (BAT), white adipose tissue (WAT), kidney, spleen, liver, pancreas, mid-brain and telencephalon (Telenc.), normalized to housekeeper (NUDC) and factorized by 1000 for better visualization. Highest expression can be observed in BAT and muscle tissue (heart, SkM); lower, but detectable, expression levels in kidney, WAT and brain. No detection (n.d.) of the new junction could be seen in liver, pancreas and spleen
Fig. 5
Fig. 5
PGC-1α isoform expression in heart in lean or diet-induced obesity (DIO) mice. Housekeeper-normalized expression levels at baseline for either lean mice (black bars) or mice with diet-induced obesity (DIO, grey bars). Shown is isoform expression for PGC-1α starting exons (A), for the four group-wise testable isoforms (B) and for the four single-detectable isoforms (C). A Isoform expression by promoter usage. While expression levels for exon 1a and exon 1c are similar between both conditions, transcripts containing exon 1b and exon 1b’ are significantly lower expressed in DIO. B Expression of group-wise detectable isoforms. While isoforms with novel C-terminal end are unchanged between both diets, the other group-wise detectable isoforms show significantly lower expression in DIO. C Expression for isoforms which are single-detectable through PCR. While CT-PGC-1α-E3c is equally expressed under both conditions, the other single-detectable isoforms show significantly reduced expression in DIO. Data acquired by qPCR using cDNA using primers covering specific starting exon 1 (a, b, b’ or c) and exon 2 resp. using primers covering specific exon-exon junctions. Expression values are normalized to housekeeper NUDC. n = 4 each, bars depict mean values, error bars represent SD. Significance calculated by unpaired Student’s t test (ns p > 0.05, *p ≤ 0.05, **p ≤ 0.01, ***p ≤ 0.001)
Fig. 6
Fig. 6
PGC-1α isoform expression in heart at baseline and 3- and 16 days post I/R. Expression levels at baseline (black bars) and 3 or 16 days post sham surgery (sham, white bars) or ischemia / reperfusion injury (I/R, striped bars) for different PGC-1α starting exons (A–D), for the four group-wise testable isoforms (E–H) and for the four single-detectable isoforms (I–L). Housekeeper-normalized expression values in infarct area (upper row) and remote area (bottom row). A Exon 1a, originating from the canonical promoter. B, C Exons 1b and 1b’, under control of the alternative (known) promoter. D Novel exon 1c, originating from a new promoter site. E Isoforms with canonical C-terminal ending. F Isoforms with novel C-terminal ending. G N-terminal isoforms. H Isoforms with the novel exon 6b. I PGC-1α-trE6-Ex13c. J sNT-PGC-1α. K PGC-1α-E3c. L CT-PGC-1α-E3c. I/R leads to downregulation of canonical and novel PGC-1α starting exons as well as most of the single- and group-wise-detectable PGC-1α isoforms 3 days post I/R, suggesting a general downregulation of PGC-1α in infarct area 3 days post I/R. At 16 days post I/R, a recovery can be observed. Moreover, PGC-1α-trE6-Ex13c is showing ‘overcompensative’ behaviour in infarcted and remote area. In all other isoforms, the expression in the remote area is not affected, neither at day 3 nor 16 days post infarction. Detailed description, see text. Data acquired by qPCR using cDNA using primers covering specific starting exon 1 (a, b, b’ or c) and exon 2 resp. using primers covering specific exon-exon junctions. Expression values are normalized to housekeeper NUDC. n = 4 each, bars depict mean values, error bars represent SD. Significance calculated by unpaired Student’s t test (ns p > 0.05, *p ≤ 0.05, **p ≤ 0.01, ***p ≤ 0.001)
Fig. 7
Fig. 7
Impact of high-fat diet on promoter-specific expression. Expression levels for diet-induced obesity at baseline (Ctrl) and 3 or 16 days post ischemia / reperfusion injury (I/R) for different PGC-1α starting exons (A–D), for the four group-wise testable isoforms (E–H) and for the four single-detectable isoforms (I–L). Housekeeper-normalized expression values in area-at-risk (upper row) and remote area (bottom row). Colours of bars represent fold-change difference between high-fat (HFD) compared to standard chow (SD) diet, colour scheme likewise to heat map illustrations (i.e. dark green means higher, dark red means lesser expression in HFD compared to SD). A Exon 1a, originating from the canonical promoter. B, C Exons 1b and 1b’, under control by the alternative (known) promoter. D Novel exon 1c, originating from a new promoter site. E Isoforms with canonical C-terminal ending. F Isoforms with novel C-terminal ending. G Isoforms with N-terminal isoforms. H Isoforms with the novel exon 6b. I PGC-1α-trE6-Ex13c. J sNT-PGC-1α. K PGC-1α-E3c. L CT-PGC-1α-E3c. The recovery of expression in the infarct zone after 16 days (ratio between 3 and 16 days) under high-fat diet is impaired, leading to a continuing downregulation of exon 1a and b. For the group-wise detectable isoforms, the downregulation is dominant in the infarct zone and less in the remote area in direct comparison of expression values. Most of the isoforms recover expression values compared over time with exception of the N-terminal isoforms in infarct area. Data acquired by qPCR using primers covering specific exon-exon junctions. Expression values are normalized to housekeeper NUDC. n = 4 each, bars depict mean values, error bars represent SD. Significance calculated by unpaired Student’s t test (ns p ≤ 0.05, *p ≤ 0.05, **p ≤ 0.01, ***p ≤ 0.001)

Similar articles

Cited by

References

    1. Ruas JL, White JP, Rao RR, Kleiner S, Brannan KT, Harrison BC, et al. A PGC-1α isoform induced by resistance training regulates skeletal muscle hypertrophy. Cell. 2012;151(6):1319–1331. doi: 10.1016/j.cell.2012.10.050. - DOI - PMC - PubMed
    1. Martínez-Redondo V, Jannig PR, Correia JC, Ferreira DM, Cervenka I, Lindvall JM, et al. Peroxisome proliferator-activated receptor γ coactivator-1 α isoforms selectively regulate multiple splicing events on target genes. J Biol Chem. 2016;291(29):15169–15184. doi: 10.1074/jbc.M115.705822. - DOI - PMC - PubMed
    1. Martínez-Redondo V, Pettersson AT, Ruas JL. The hitchhiker's guide to PGC-1α isoform structure and biological functions. Diabetologia. 2015;58(9):1969–1977. doi: 10.1007/s00125-015-3671-z. - DOI - PubMed
    1. Safdar A, Little JP, Stokl AJ, Hettinga BP, Akhtar M, Tarnopolsky MA. Exercise increases mitochondrial PGC-1 α content and promotes nuclear-mitochondrial cross-talk to coordinate mitochondrial biogenesis. J Biol Chem. 2018;293(13):4953. doi: 10.1074/jbc.EC118.002682. - DOI - PMC - PubMed
    1. Léveillé M, Besse-Patin A, Jouvet N, Gunes A, Sczelecki S, Jeromson S, et al. PGC-1α isoforms coordinate to balance hepatic metabolism and apoptosis in inflammatory environments. Mol Metab. 2020;34:72–84. doi: 10.1016/j.molmet.2020.01.004. - DOI - PMC - PubMed

Publication types

MeSH terms

Substances

LinkOut - more resources