. 2022 Jul 30;5(1):770.
doi: 10.1038/s42003-022-03679-0.

The gut microbiome variability of a butterflyfish increases on severely degraded Caribbean reefs

Affiliations

The gut microbiome variability of a butterflyfish increases on severely degraded Caribbean reefs

Friederike Clever et al. Commun Biol. .

Abstract

Environmental degradation has the potential to alter key mutualisms that underlie the structure and function of ecological communities. How microbial communities associated with fishes vary across populations and in relation to habitat characteristics remains largely unknown despite their fundamental roles in host nutrition and immunity. We find significant differences in the gut microbiome composition of a facultative coral-feeding butterflyfish (Chaetodon capistratus) across Caribbean reefs that differ markedly in live coral cover (∼0-30%). Fish gut microbiomes were significantly more variable at degraded reefs, a pattern driven by changes in the relative abundance of the most common taxa potentially associated with stress. We also demonstrate that fish gut microbiomes on severely degraded reefs have a lower abundance of Endozoicomonas and a higher diversity of anaerobic fermentative bacteria, which may suggest a less coral dominated diet. The observed shifts in fish gut bacterial communities across the habitat gradient extend to a small set of potentially beneficial host associated bacteria (i.e., the core microbiome) suggesting essential fish-microbiome interactions may be vulnerable to severe coral degradation.


Conflict of interest statement

The authors declare no competing interests.

Figures
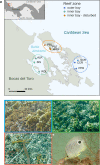
Fig. 1
Fig. 1. Study area and fish species.
a Map of the Bahía Almirante (Bocas del Toro, Panamá) indicating the position of the nine reefs where samples were collected (generated using GSHHG version 2.3.7 https://www.soest.hawaii.edu/pwessel/gshhg/). Data: Friederike Clever. b Outer bay reefs with highest levels of live coral cover, c inner bay reefs with intermediate levels of coral cover, and d reefs located in the inner bay disturbed zone were highly impacted by a hypoxic event in 2010. e The study species foureye butterflyfish (Chaetodon capistratus). Photographs by Matthieu Leray.
Fig. 2
Fig. 2. Benthic communities.
Composition and percent coral cover of benthic communities across nine reefs and three reef zones illustrating a habitat gradient: a PCoA representing dissimilarities in benthic community composition based on Bray–Curtis. Reefs are color-coded by reef zone, substrate groups are depicted in black; b percent live coral cover across reef zones from high coral cover at the outer bay to very low cover on disturbed reefs at the inner bay. Diamond shapes depict means.
Fig. 3
Fig. 3. Alpha diversity.
Differences in diversity (mean ± SE) of ASVs between the whole gut microbiome (ac) and the core gut microbiome (df) of Chaetodon capistratus across reefs. Alpha diversity was measured based on Hill numbers using three metrics that put more or less weight on common species. The observed richness (a, d) does not take into account relative abundances. Shannon exponential (b, e) weighs ASVs by their frequency. Simpson multiplicative inverse (c, f) overweighs abundant ASVs. Significance depicts differences in alpha diversity among reef zones (Kruskal–Wallis test with post hoc Dunn test). Diamonds depict means.
Fig. 4
Fig. 4. Multivariate dispersion.
Compositional variability of the whole gut microbiome (af) and core gut microbiome (gl) of Chaetodon capistratus across reefs. Compositional variability is measured as the distance to the centroid (mean ± SE) of each group (fish at each reef) in multivariate space. Multivariate analyses were computed with non-phylogenetic (Jaccard: panels a, g; Modified Gower: panels b, h; and Bray–Curtis: panels c, i) and phylogenetic (Unifrac: panels d, j; Generalized Unifrac: e, k; Weighted Unifrac f, l) metrics that differ in how much weight they give to relative abundances. On one end of the spectrum, Jaccard and Unifrac only use presence-absence data, whereas on the other end of the spectrum Bray–Curtis and Weighted Unifrac give a lot of weight to abundant ASVs in dissimilarity calculations. Significance depicts differences in multivariate dispersion between reef zones (ANOVA). Diamonds depict means.
Fig. 5
Fig. 5. PERMANOVA.
Proportion of the variance explained in Permutational Analysis of Variance (PERMANOVA) comparing the composition of the whole gut microbiome (a) and the core gut microbiome (b) of Chaetodon capistratus. Three independent PERMANOVA analyses were conducted. The “zone” model compares gut microbiomes among the three zones of the bay (inner bay, inner bay disturbed, and outer bay). The “position” model contrasts the composition of gut microbiomes of fish collected at reefs inside and outside of the bay. The “cover” model compares gut microbiomes of fish on disturbed and undisturbed reefs inside of the bay. Three non-phylogenetic (circles) and three phylogenetic (triangles) dissimilarity metrics were used. They place more (red) or less (blue) weight on relative abundances.
Fig. 6
Fig. 6. PIME filtering zones 65% prevalence.
Comparison of fish gut microbiomes among three reef zones. The whole fish gut microbial dataset was filtered using Prevalence Interval for Microbiome Evaluation (PIME) to detect which ASVs were responsible for differences among zones. Using machine learning, PIME de-noises the data by reducing within-group variability. Based on the algorithm, we selected a 65% prevalence cut-off resulting in a filtered dataset of 17 ASVs at a low error rate (OOB = 2.25) and high model accuracy (97.75%).
Fig. 7
Fig. 7. Microbial community analysis.
Microbial community analysis workflow illustrating how we subsetted the whole fish gut microbiome dataset to delineate the core gut microbiome and gut microbial communities by zone, respectively. To identify the core microbiome, we used indicator analysis between the whole fish gut microbiome and the environmental sample fraction consisting of samples of potential fish prey taxa and the surrounding seawater. Diversity analysis was done for the whole and core fish gut microbiome, respectively. The whole fish gut microbiome was filtered for prevalence with a machine learning-based algorithm (PIME) to detect community differences among zones that reflect fish-microbiome responses to the habitat gradient. Created with BioRender.com. The fish icon is adapted from a color photograph of Chaetodon capistratus obtained from https://biogeodb.stri.si.edu/caribbean/en/pages with permission by D R Robertson. Icons of benthic organisms obtained from the IAN Symbol Libraries: Tracey Saxby and Joanna Woerner, Integration and Application Network (ian.umces.edu/media-library). https://creativecommons.org/licenses/by-sa/4.0/.

References

    1. Kiers ET, Palmer TM, Ives AR, Bruno JF, Bronstein JL. Mutualisms in a changing world: an evolutionary perspective. Ecol. Lett. 2010;13:1459–1474. doi: 10.1111/j.1461-0248.2010.01538.x. - DOI - PubMed
    1. Idjadi J, Edmunds P. Scleractinian corals as facilitators for other invertebrates on a Caribbean reef. Mar. Ecol. Prog. Ser. 2006;319:117–127. doi: 10.3354/meps319117. - DOI
    1. Norström A, Nyström M, Lokrantz J, Folke C. Alternative states on coral reefs: beyond coral–macroalgal phase shifts. Mar. Ecol. Prog. Ser. 2009;376:295–306. doi: 10.3354/meps07815. - DOI
    1. Richardson LE, Graham NAJ, Pratchett MS, Eurich JG, Hoey AS. Mass coral bleaching causes biotic homogenization of reef fish assemblages. Glob. Chang. Biol. 2018;24:3117–3129. doi: 10.1111/gcb.14119. - DOI - PubMed
    1. Wilson SK, Graham NAJ, Pratchett MS, Jones GP, Polunin NVC. Multiple disturbances and the global degradation of coral reefs: are reef fishes at risk or resilient? Glob. Chang. Biol. 2006;12:2220–2234. doi: 10.1111/j.1365-2486.2006.01252.x. - DOI

Publication types