

Mycobacterium tuberculosis/Mycobacterium bovis triggered different variations in lipid composition of Bovine Alveolar Macrophages
- PMID: 35908111
- PMCID: PMC9338951
- DOI: 10.1038/s41598-022-17531-2
Mycobacterium tuberculosis/Mycobacterium bovis triggered different variations in lipid composition of Bovine Alveolar Macrophages
Abstract
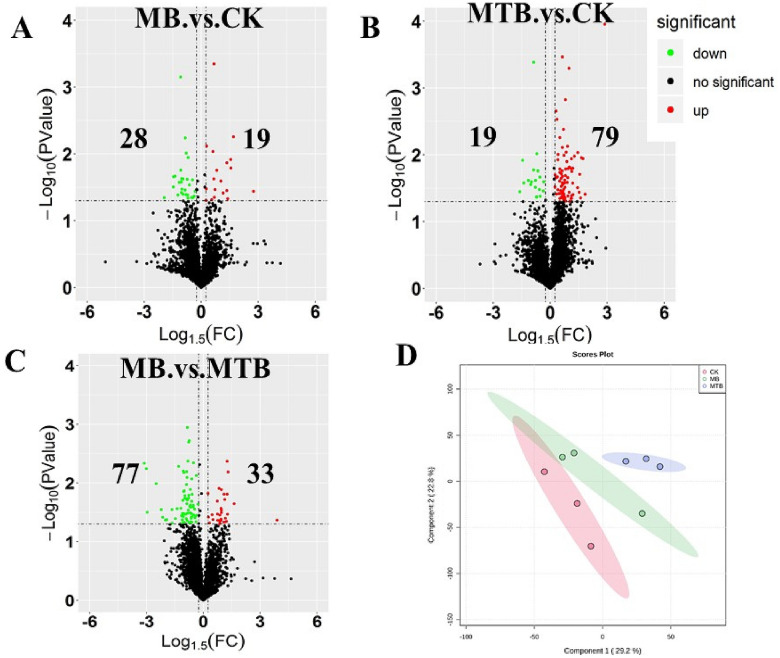
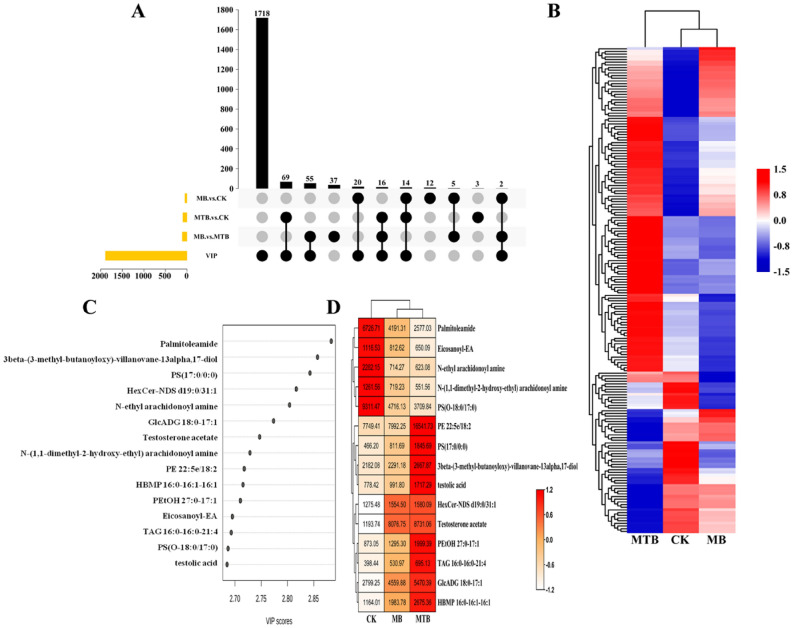
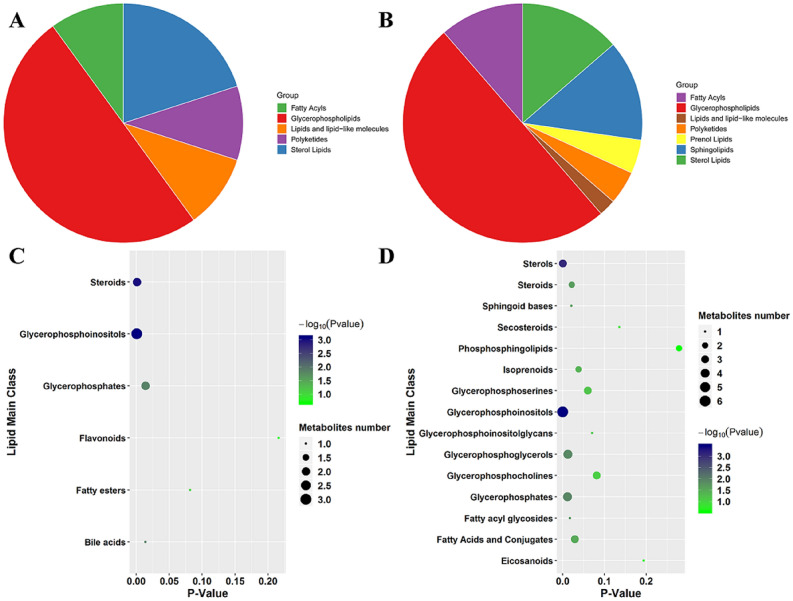
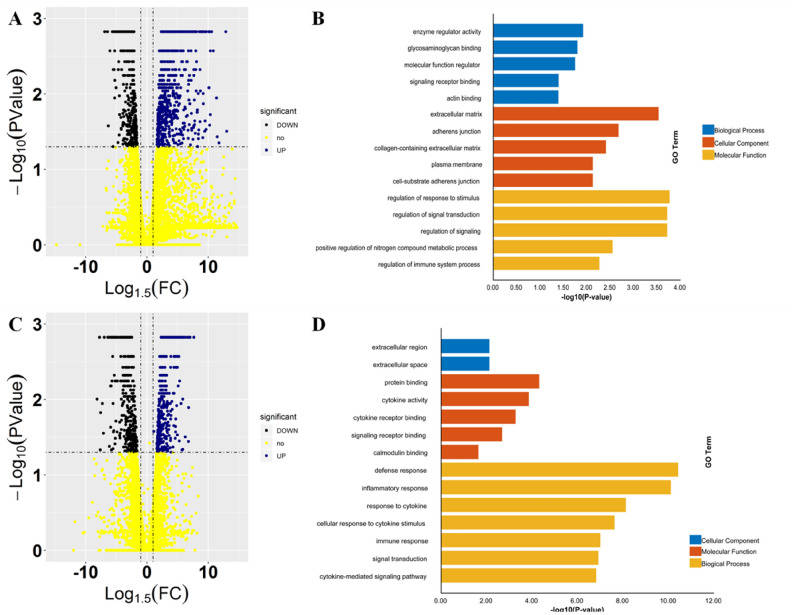
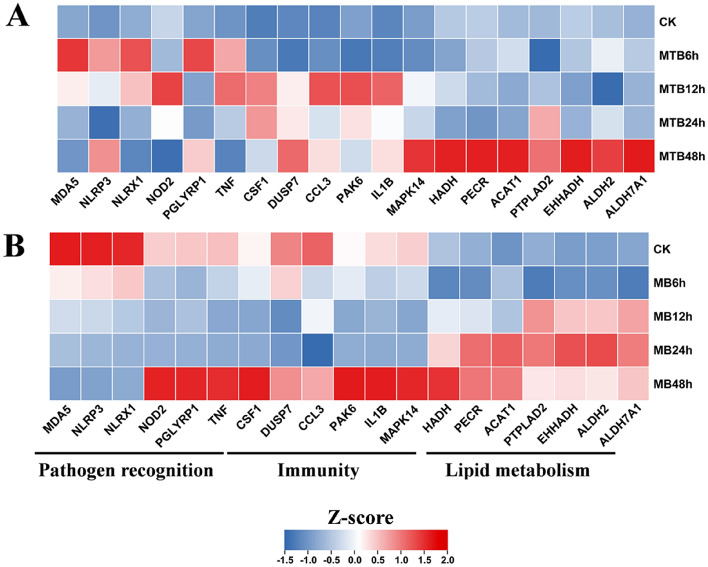
The lipid composition performs important functions in interaction between macropha-ge and Mycobacterium tuberculosis (MTB)/Mycobacterium bovis (MB). Current understanding regarding the lipid responses of bovine alveolar macrophage (BAM) to MTB/MB is quite limited. The present study conducted lipidomics and transcriptome to assess alterations in BAM lipid compositions upon MB and MTB infection. We found that both MTB and MB induced glycerophospholipids accumulation in BAM, and MTB induced more alterations in lipid composition. MTB could affect the contents of various lipids, especially ceramide phosphocholines, polystyrene (PS) (17:0/0:0), testolic acid and testosterone acetate. Meanwhile, MB particularly induced accumulation of 1-alkyl,2-acylglycerophosphoinositols. Both MB and MTB suppressed the contents of palmitoleamide, N-ethyl arachidonoyl amine, N-(1,1-dimethyl-2-hydroxy-ethyl) arachidonoyll amine, eicosanoyl-EA, and PS (O-18:0/17:0) in BAM. Additionally, transcriptome analysis revealed that only MTB triggered genes involved in immune signaling and lipid related pathways in BAM. And MTB mainly activated genes CXCL2 and CXCL3 relevant to NOD-like receptor, IL-17 and TNF to further induce lipid accumulation in BAM, which in turn promoted the formation of foam cells. Meanwhile, time course RT-qPCR results showed that MTB was recognized by BAM to triggered dramatic immune responses, whereas MB could effectively escape the recognition system of BAM, leading rearrangement of lipid metabolisms in BAM at early infection stage. Altogether, the results of the present study provided evidence for changes in lipid metabolism of MTB/MB attacked BAM and contributed to the detection and treatment of zoonotic tuberculosis.
© 2022. The Author(s).
Conflict of interest statement
The authors declare no competing interests.
Figures


Similar articles
-
Lipidomics revealed the global lipid responses of primary bovine alveolar macrophages to infections of Mycobacterium tuberculosis and Mycobacterium bovis.Int Immunopharmacol. 2022 Mar;104:108407. doi: 10.1016/j.intimp.2021.108407. Epub 2021 Dec 17. Int Immunopharmacol. 2022. PMID: 34924313
-
Comparative proteome analysis revealed the differences in response to both Mycobacterium tuberculosis and Mycobacterium bovis infection of bovine alveolar macrophages.Front Cell Infect Microbiol. 2023 Nov 1;13:1266884. doi: 10.3389/fcimb.2023.1266884. eCollection 2023. Front Cell Infect Microbiol. 2023. PMID: 38029268 Free PMC article.
-
The bovine alveolar macrophage DNA methylome is resilient to infection with Mycobacterium bovis.Sci Rep. 2019 Feb 6;9(1):1510. doi: 10.1038/s41598-018-37618-z. Sci Rep. 2019. PMID: 30728374 Free PMC article.
-
Mycobacterium tuberculosis Infection-Driven Foamy Macrophages and Their Implications in Tuberculosis Control as Targets for Host-Directed Therapy.Front Immunol. 2020 May 12;11:910. doi: 10.3389/fimmu.2020.00910. eCollection 2020. Front Immunol. 2020. PMID: 32477367 Free PMC article. Review.
-
Not too fat to fight: The emerging role of macrophage fatty acid metabolism in immunity to Mycobacterium tuberculosis.Immunol Rev. 2021 May;301(1):84-97. doi: 10.1111/imr.12952. Epub 2021 Feb 8. Immunol Rev. 2021. PMID: 33559209 Review.
Cited by
-
Estimated Prevalence of Tuberculosis in Ruminants from Slaughterhouses in Constantine Province (Northeastern Algeria): A 10-Year Retrospective Survey (2011-2020).Life (Basel). 2023 Mar 17;13(3):817. doi: 10.3390/life13030817. Life (Basel). 2023. PMID: 36983972 Free PMC article.
-
Comparative analysis of WC1.1+ and WC1.2+ γδ T cell subset responses from cattle naturally infected with Mycobacterium bovis to repeat stimulation with mycobacterial antigens.PLoS One. 2024 Dec 12;19(12):e0311854. doi: 10.1371/journal.pone.0311854. eCollection 2024. PLoS One. 2024. PMID: 39666627 Free PMC article.
-
Exploring intracellular anti-mycobacterium activity of lactoferricin-loaded niosomes: proteomics insights into Immunomodulation.Sci Rep. 2025 May 30;15(1):19029. doi: 10.1038/s41598-025-04673-2. Sci Rep. 2025. PMID: 40447732 Free PMC article.
-
The Effect of the Feeding System on Fat Deposition in Yak Subcutaneous Fat.Int J Mol Sci. 2023 Apr 17;24(8):7381. doi: 10.3390/ijms24087381. Int J Mol Sci. 2023. PMID: 37108542 Free PMC article.
References
MeSH terms
Substances
LinkOut - more resources
Full Text Sources
Miscellaneous
